Power line hearing draws ample opposition

By McClatchy Tribune News
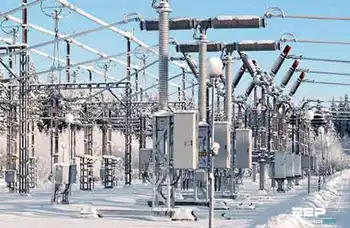

Arc Flash Training - CSA Z462 Electrical Safety

Our customized live online or in‑person group training can be delivered to your staff at your location.

  • Live Online
  • 6 hours Instructor-led
  • Group Training Available
Regular Price:
$249
Coupon Price:
$199
Reserve Your Seat Today
If one day's show of opposition can influence the outcome of public hearings on Allegheny Energy Inc.'s proposed $1.2 billion high-voltage transmission line across Southwestern Pennsylvania and two other states, the project could be in bad shape.

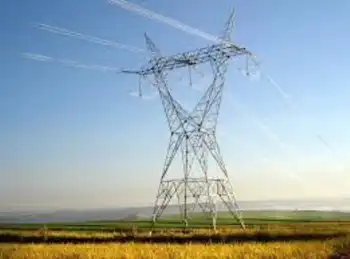
Critics of the 240-mile Trans-Allegheny Interstate Line made their presence known inside and outside Downtown's State Office Building during the start of three weeks of Public Utility Commission hearings that will feature highly technical, expert witness testimony.

More than 60 opponents sat in the hearing room or carried signs and placards outside the building. Keith Neill, who with his brother Curtis owns 100 acres in North Strabane, Washington County, said his property value will be damaged should the power line be built.

"We've attended the public hearings, my brother has had discussions with the Allegheny Energy people, but they weren't fruitful," said Neill, dressed in a black T-shirt with bold yellow letters spelling "Stop the Towers".

"I expect to split time at the hearings with my brother," Neill said.

Public Utility Commission Administrative Law Judges Michael A. Nemec and Mark Hoyer oversee the hearings. They will make recommendations to the PUC, which will decide whether to approve the power line plan. The Trans-Allegheny project includes a primary 500-kilovolt line stretching from near Eighty Four, Washington County, into West Virginia, then east to Loudoun County, Va., about 35 miles west of Washington.

Three, smaller 138-kilovolt lines are proposed within the Pennsylvania portion of the project. Allegheny Energy's share of the bill is about $850 million. The Greensburg-based energy company contends that all but 1.2 miles of the project in Pennsylvania address local reliability needs.

"This evidentiary hearing will give us the opportunity to demonstrate the careful evaluation undertaken to address reliability issues," said David E. Flitman, president of Allegheny Energy's power transmission-distribution unit, in a statement. Opponents of the project object on health and aesthetic grounds, along with potential lower property values should a line cross or a transmission tower sit on their property.

Another reason in-state opponents are against the Trans-Allegheny line is they don't see a need for a large power line. Pepper Hamilton LLP attorney Willard Burns pressed the need issue during cross-examination of Allegheny Energy witness Steven Herling, a planning vice president for PJM Interconnection of Valley Forge.

PJM coordinates and operates the power transmission grid in all or parts of 13 states, including Pennsylvania and the District of Columbia - an area serviced by 17 power companies and with a population of 51 million.

"We want to focus on the need for the 500 kV line. The basis of Allegheny's assumptions is the alleged fear of blackouts if the line isn't built - and that's ridiculous, said Burns, who represents the Conservation Council of Pennsylvania at the hearing. "Everyone loses power every now and then. The blackout talk just is a smokescreen."

Related News

Africa's Electricity Unlikely To Go Green This Decade

Africa 2030 Energy Mix Forecast finds electricity generation doubling, with fossil fuels dominant, non-hydro renewables under 10%, hydro vulnerable to droughts, and machine-learning analysis of planned power plants shaping climate and investment decisions.


Key Points

An analysis predicting Africa's 2030 power mix, with fossil fuels dominant, limited renewables growth, and hydro risks.

✅ ML model assesses 2,500 planned plants' commissioning odds

✅ Fossil fuels ~66% of generation; non-hydro RE <10% by 2030

✅ Policy shifts and finance reallocation to scale solar and wind


New research today from the University of Oxford predicts that total electricity generation across the African continent will double by 2030, with fossil fuels continuing to dominate the energy mix posing potential risk to global climate change commitments.

The study, published in Nature Energy, uses a state-of-the art machine-learning technique to analyse the pipeline of more than 2,500 currently-planned power plants and their chances of being successfully commissioned. It shows the share of non-hydro renewables in African electricity generation is likely to remain below 10% in 2030, although this varies by region.

'Africa's electricity demand is set to increase significantly as the continent strives to industrialise and improve the wellbeing of its people, which offers an opportunity to power this economic development and expand universal electricity access through renewables' says Galina Alova, study lead author and researcher at the Oxford Smith School of Enterprise and the Environment.

'There is a prominent narrative in the energy planning community that the continent will be able to take advantage of its vast renewable energy resources and rapidly decreasing clean technology prices to leapfrog to renewables by 2030 but our analysis shows that overall it is not currently positioned to do so.'

The study predicts that in 2030, fossil fuels will account for two-thirds of all generated electricity across Africa. While an additional 18% of generation is set to come from hydro-energy projects across Africa. These have their own challenges, such as being vulnerable to an increasing number of droughts caused by climate change.

The research also highlights regional differences in the pace of the transition to renewables across Sub-Saharan Africa, with southern Africa leading the way. South Africa alone is forecast to add almost 40% of Africa's total predicted new solar capacity by 2030.

'Namibia is committed to generate 70% of its electricity needs from renewable sources, including all the major alternative sources such as hydropower, wind and solar generation, by 2030, as specified in the National Energy Policy and in Intended Nationally Determined Contributions under Paris Climate Change Accord,' says Calle Schlettwein, Namibia Minister of Water (former Minister of Finance and Minister of Industrialisation). 'We welcome this study and believe that it will support the refinement of strategies for increasing generation capacity from renewable sources in Africa and facilitate both successful and more effective public and private sector investments in the renewable energy sector.'

Minister Schlettwein adds: 'The more data-driven and advanced analytics-based research is available for understanding the risks associated with power generation projects, the better. Some of the risks that could be useful to explore in the future are the uncertainties in hydrological conditions and wind regimes linked to climate change, and economic downturns such as that caused by the COVID-19 pandemic.'

The study further suggests that a decisive move towards renewable energy in Africa would require a significant shock to the current system. This includes large-scale cancellation of fossil fuel plants currently being planned. In addition, the study identifies ways in which planned renewable energy projects can be designed to improve their success chances for example, smaller size, fitting ownership structure, and availability of development finance for projects.

'The development community and African decision makers need to act quickly if the continent wants to avoid being locked into a carbon-intense energy future' says Philipp Trotter, study author and researcher at the Smith School. 'Immediate re-directions of development finance from fossil fuels to renewables are an important lever to increase experience with solar and wind energy projects across the continent in the short term, creating critical learning curve effects.'


Related News

View more

Energy minister unveils Ontario's plan to address growing energy needs

Powering Ontario's Growth accelerates clean electricity, pairing solar, wind, and hydro with energy storage, efficiency investments, and new nuclear, including SMRs, to meet rising demand and net-zero goals while addressing supply planning across the province.


Key Points

Ontario's clean energy plan adds renewables, storage, efficiency, and nuclear to meet rising electricity demand.

✅ Over $1B for energy-efficiency programs through 2030+

✅ Largest clean power procurement in Canadian history

✅ Mix of solar, wind, hydro, storage, nuclear, and SMRs


Energy Minister Todd Smith has announced a new plan that outlines the actions the government is taking to address the province's growing demand for electricity.

The government is investing over a billion dollars in "energy-efficiency programs" through 2030 and beyond, Smith said in Windsor.

Experts at Ontario's Independent Electricity System recommended the planning start early to meet demand they predict will require the province to be able to generate 88,000 megawatts (MW) in 20 years.

"That means all of our current supply ... would need to double to meet the anticipated demand by 2050," he said during the announcement.

"While we may not need to start building today, government and those in the energy sector need to start planning immediately, so we have new clean, zero emissions projects ready to go when we need them."

The project is called Powering Ontario's Growth and will advance new clean energy generation from a number of sources, including solar, hydroelectric and wind.

He said this would be the biggest acquisition of clean energy in Canada's history.

Smith made the announcement at Hydro One's Keith Transmission Station.

He said the new planned procurement of green power will pair well with recent energy storage procurements, so that power generated by solar panels, for example, can be stored and injected into the system when needed.

NDP Opposition Leader Marit Stiles said Monday's announcement lacks specifics.

"It's light on details, including key questions of cost, climate impact, waste management and financial risk," said Stiles.

"Ford's Conservatives should be playing catch-up after undermining clean energy in their first term. Instead, they're offering generalities and a vague sense of what they might do."

The Green Party criticized the move Monday afternoon, noting that clean, affordable electricity remains a key Ontario election issue today.

"Ontario is facing an energy crunch – and the Ford government is making it worse by choosing more expensive, dirtier options," said MPP for Guelph Mike Schreiner in the statement.

He said Premier Doug Ford has "grossly" mismanaged the province's energy supply by cancelling 750 renewable energy projects and slashing efficiency programs.

"Now, faced with an opportunity to become a leader in a world that's rapidly embracing renewable energy, this government has chosen to funnel taxpayer dollars into polluting fossil gas plants and expensive new nuclear that will take decades to come online," said Schreiner.

Smith announced last week the plan for three more small modular reactors at the site of the Darlington nuclear power plant. The province also shared its intention to add a third nuclear generating station to Bruce Power near Kincardine. 

"With this backwards approach, the Ford government is squandering a once-in-a-generation opportunity to make Ontario a global leader in attracting investment dollars and creating better jobs in the trillion-dollar clean energy sector," said Schreiner.


Related News

View more

Which of the cleaner states imports dirty electricity?

Hourly Electricity Emissions Tracking maps grid balancing areas, embodied emissions, and imports/exports, revealing carbon intensity shifts across PJM, ERCOT, and California ISO, and clarifying renewable energy versus coal impacts on health and climate.


Key Points

An hourly method tracing generation, flows, and embodied emissions to quantify carbon intensity across US balancing areas.

✅ Hourly traces of imports/exports and generation mix

✅ Consumption-based carbon intensity by balancing area

✅ Policy insights for renewables, coal, health costs


In the United States, electricity generation accounts for nearly 30% of our carbon emissions. Some states have responded to that by setting aggressive renewable energy standards; others are hoping to see coal propped up even as its economics get worse. Complicating matters further is the fact that many regional grids are integrated, and as America goes electric the stakes grow, meaning power generated in one location may be exported and used in a different state entirely.

Tracking these electricity exports is critical for understanding how to lower our national carbon emissions. In addition, power from a dirty source like coal has health and environment impacts where it's produced, and the costs of these aren't always paid by the parties using the electricity. Unfortunately, getting reliable figures on how electricity is produced and where it's used is challenging, even for consumers trying to find where their electricity comes from in the first place, leaving some of the best estimates with a time resolution of only a month.

Now, three Stanford researchers—Jacques A. de Chalendar, John Taggart, and Sally M. Benson—have greatly improved on that standard, and they have managed to track power generation and use on an hourly basis. The researchers found that, of the 66 grid balancing areas within the United States, only three have carbon emissions equivalent to our national average, and they have found that imports and exports of electricity have both seasonal and daily changes. de Chalendar et al. discovered that the net results can be substantial, with imported electricity increasing California's emissions/power by 20%.

Hour by hour
To figure out the US energy trading landscape, the researchers obtained 2016 data for grid features called balancing areas. The continental US has 66 of these, providing much better spatial resolution on the data than the larger grid subdivisions. This doesn't cover everything—several balancing areas in Canada and Mexico are tied in to the US grid—and some of these balancing areas are much larger than others. The PJM grid, serving Pennsylvania, New Jersey, and Maryland, for example, is more than twice as large as Texas' ERCOT, in a state that produces and consumes the most electricity in the US.

Despite these limitations, it's possible to get hourly figures on how much electricity was generated, what was used to produce it, and whether it was used locally or exported to another balancing area. Information on the generating sources allowed the researchers to attach an emissions figure to each unit of electricity produced. Coal, for example, produces double the emissions of natural gas, which in turn produces more than an order of magnitude more carbon dioxide than the manufacturing of solar, wind, or hydro facilities. These figures were turned into what the authors call "embodied emissions" that can be traced to where they're eventually used.

Similar figures were also generated for sulfur dioxide and nitrogen oxides. Released by the burning of fossil fuels, these can both influence the global climate and produce local health problems.

Huge variation
The results were striking. "The consumption-based carbon intensity of electricity varies by almost an order of magnitude across the different regions in the US electricity system," the authors conclude. The low is the Bonneville Power grid region, which is largely supplied by hydropower; it has typical emissions below 100kg of carbon dioxide per megawatt-hour. The highest emissions come in the Ohio Valley Electric region, where emissions clear 900kg/MW-hr. Only three regional grids match the overall grid emissions intensity, although that includes the very large PJM (where capacity auction payouts recently fell), ERCOT, and Southern Co balancing areas.

Most of the low-emissions power that's exported comes from the Pacific Northwest's abundant hydropower, while the Rocky Mountains area exports electricity with the highest associated emissions. That leads to some striking asymmetries. Local generation in the hydro-rich Idaho Power Company has embodied emissions of only 71kg/MW-hr, while its imports, coming primarily from Rocky Mountain states, have a carbon content of 625kg/MW-hr.

The reliance on hydropower also makes the asymmetry seasonal. Local generation is highest in the spring as snow melts, but imports become a larger source outside this time of year. As solar and wind can also have pronounced seasonal shifts, similar changes will likely be seen as these become larger contributors to many of these regional grids. Similar things occur daily, as both demand and solar production (and, to a lesser extent, wind) have distinct daily profiles.

The Golden State
California's CISO provides another instructive case. Imports represent less than 30% of its total electric use in 2016, yet California electricity imports provided 40% of its embodied emissions. Some of these, however, come internally from California, provided by the Los Angeles Department of Water and Power. The state itself, however, has only had limited tracking of imported emissions, lumping many of its sources as "other," and has been exporting its energy policies to Western states in ways that shape regional markets.

Overall, the 2016 inventory provides a narrow picture of the US grid, as plenty of trends are rapidly changing our country's emissions profile, including the rise of renewables and the widespread adoption of efficiency measures and other utility trends in 2017 that continue to evolve. The method developed here can, however, allow for annual updates, providing us with a much better picture of trends. That could be quite valuable to track things like how the rapid rise in solar power is altering the daily production of clean power.

More significantly, it provides a basis for more informed policymaking. States that wish to promote low-emissions power can use the information here to either alter the source of their imports or to encourage the sites where they're produced to adopt more renewable power. And those states that are exporting electricity produced primarily through fossil fuels could ensure that the locations where the power is used pay a price that includes the health costs of its production.


Related News

View more

Canada Faces Critical Crunch in Electrical Supply

Canada Electricity Supply Crunch underscores grid reliability risks, aging infrastructure, and rising demand, pushing upgrades in transmission, energy storage, smart grid technology, and renewable energy integration to protect industry, consumers, and climate goals.


Key Points

A nationwide power capacity shortfall stressing the grid, raising outage risks and slowing the renewable transition.

✅ Demand growth and aging infrastructure strain transmission capacity

✅ Smart grid, storage, and interties improve reliability and flexibility

✅ Accelerated renewables and efficiency reduce fossil fuel reliance


Canada, known for its vast natural resources and robust energy sector, is now confronting a significant challenge: a crunch in electrical supply. A recent report from EnergyNow.ca highlights the growing concerns over Canada’s electricity infrastructure, revealing that the country is facing a critical shortage that could impact both consumers and industries alike. This development raises pressing questions about the future of Canada’s energy landscape and its implications for the nation’s economy and environmental goals.

The Current Electrical Supply Dilemma

According to EnergyNow.ca, Canada’s electrical supply is under unprecedented strain due to several converging factors. One major issue is the rapid pace of economic and population growth, particularly in urban centers. This expansion has increased demand for electricity, putting additional pressure on an already strained grid. Compounding this issue are aging infrastructure and a lack of sufficient investment in modernizing the electrical grid to meet current and future needs, with interprovincial frictions such as the B.C. challenge to Alberta's export restrictions further complicating coordination.

The report also points out that Canada’s reliance on certain types of energy sources, including fossil fuels, exacerbates the problem. While the country has made strides in renewable energy, including developments in clean grids and batteries across provinces, the transition has not kept pace with the rising demand for electricity. This imbalance highlights a crucial gap in Canada’s energy strategy that needs urgent attention.

Economic and Social Implications

The shortage in electrical supply has significant economic and social implications. For businesses, particularly those in energy-intensive sectors such as manufacturing and technology, the risk of power outages or unreliable service can lead to operational disruptions and financial losses. Increased energy costs due to supply constraints could also affect profit margins and competitiveness on both domestic and international fronts, with electricity exports at risk amid trade tensions.

Consumers are not immune to the impact of this electrical supply crunch. The potential for rolling blackouts or increased energy prices, as debates over electricity rates and innovation continue nationwide, can strain household budgets and affect overall quality of life. Additionally, inconsistent power supply can affect essential services, including healthcare facilities and emergency services, highlighting the critical nature of reliable electricity for public safety and well-being.

Investment and Infrastructure Upgrades

Addressing the electrical supply crunch requires significant investment in infrastructure and technology, and recent tariff threats have boosted support for Canadian energy projects that could accelerate these efforts. The EnergyNow.ca report underscores the need for modernizing the electrical grid to enhance capacity and resilience. This includes upgrading transmission lines, improving energy storage solutions, and expanding the integration of renewable energy sources such as wind and solar power.

Investing in smart grid technology is also essential. Smart grids use digital communication and advanced analytics to optimize electricity distribution, detect outages, and manage demand more effectively. By adopting these technologies, Canada can better balance supply and demand, reduce the risk of blackouts, and improve overall efficiency in energy use.

Renewable Energy Transition

Transitioning to renewable energy sources is a critical component of addressing the electrical supply crunch. While Canada has made progress in this area, the pace of change needs to accelerate under the new Clean Electricity Regulations for 2050 that set long-term targets. Expanding the deployment of wind, solar, and hydroelectric power can help diversify the energy mix and reduce reliance on fossil fuels. Additionally, supporting innovations in energy storage and grid management will enhance the reliability and sustainability of renewable energy.

The EnergyNow.ca report highlights several ongoing initiatives and projects aimed at increasing renewable energy capacity. However, these efforts must be scaled up and supported by both public policy and private investment to ensure that Canada can meet its energy needs and climate goals.

Policy and Strategic Planning

Effective policy and strategic planning are crucial for addressing the electrical supply challenges, with an anticipated electricity market reshuffle in at least one province signaling change ahead. Government action is needed to support infrastructure investment, incentivize renewable energy adoption, and promote energy efficiency measures. Collaborative efforts between federal, provincial, and municipal governments, along with private sector stakeholders, will be key to developing a comprehensive strategy for managing Canada’s electrical supply.

Public awareness and engagement are also important. Educating consumers about energy conservation practices and encouraging the adoption of energy-efficient technologies can contribute to reducing overall demand and alleviating some of the pressure on the electrical grid.

Conclusion

Canada’s electrical supply crunch is a pressing issue that demands immediate and sustained action. The growing demand for electricity, coupled with aging infrastructure and a lagging transition to renewable energy, poses significant challenges for the country’s economy and daily life. Addressing this issue will require substantial investment in infrastructure, advancements in technology, and effective policy measures. By taking a proactive and collaborative approach, Canada can navigate this crisis and build a more resilient and sustainable energy future.


Related News

View more

Hot Houston summer and cold winter set new electricity records

US Electricity Demand 2018-2050 projects slower growth as energy consumption, power generation, air conditioning, and electric heating shift with efficiency standards, commercial floor space, industrial load, and household growth across the forecast horizon.


Key Points

A forecast of US power use across homes, commercial space, industrial load, and efficiency trends from 2018 to 2050.

✅ 2018 generation hit record; residential sales up 6%.

✅ Efficiency curbs demand; growth lags population and floor space.

✅ Commercial sales up 2%; industrial demand fell 3% in 2018.


Last year's Houston cold winter and hot summer drove power use to record levels, especially among households that rely on electricity for air conditioning during extreme weather conditions.

Electricity generation increased 4 per cent nationwide in 2018 and produced 4,178 million megawatt hours, driven in part by record natural gas generation across the U.S., surpassing the previous peak of 4,157 megawatt hours set in 2007, the Energy Department reported.

U.S. households bought 6 percent more electricity in 2018 than they did the previous year, despite longer-term declines in national consumption, reflecting the fact 87 percent of households cool their homes with air conditioning and 35 percent use electricity for heating.

Electricity sales to the commercial sector increased 2 percent in 2018 compared to the previous year while the industrial sector bought 3 percent less last year.

Going forward, the Energy Department forecasts that electricity consumption will grow at a slower pace than in recent decades, aligning with falling sales projections as technology improves and energy efficiency standards moderate consumption.

The economy and population growth are primary drivers of demand and the government predicts the number of households will grow at 0.7 percent per year from now until 2050 but electricity demand will grow only by 0.4 percent annually.

Likewise, commercial floor space is expected to increase 1 percent per year from now until 2050 but electricity sales will increase only by half that amount.

Globally, surging electricity demand is putting power systems under strain, providing context for these domestic trends.


Related News

View more

Solar power growth, jobs decline during pandemic

COVID-19 Solar Job Losses are erasing five years of workforce growth, SEIA reports, with U.S. installations and capacity down, layoffs accelerating, 3 GW expected in Q2, and policy support key for economic recovery.


Key Points

COVID-19 Solar Job Losses describe the pandemic-driven decline in U.S. solar employment, installations, and capacity.

✅ SEIA reports a 38% national drop in solar jobs

✅ Q2 installs projected at 3 GW, below forecasts

✅ Layoffs outpace U.S. economy without swift policy aid


Job losses associated with the COVID-19 crisis have wiped out the past five years of workforce growth in the solar energy field, according to a new industry analysis.

The expected June 2020 solar workforce of 188,000 people across the United States is 114,000 below the pre-pandemic forecast of 302,000 workers, a shortfall tied to the solar construction slowdown according to the Solar Energy Industries Association, which said in a statement Monday that the solar industry is now losing jobs at a faster rate than the U.S. economy.

In Massachusetts, the loss of 4,284 solar jobs represents a 52 percent decline from previous projections, according to the association’s analysis.

The national 38 percent drop in solar jobs coincides with a 37 percent decrease in expected solar installations in the second quarter of 2020, and similar pressures have put wind investments at risk across the sector, the association stated. The U.S. is now on track to install 3 gigawatts of new capacity this quarter, though subsequent forecasts anticipated solar and storage growth as investments returned, and the association said the decrease from the expected capacity is equivalent to the electricity needed to power 288,000 homes.

“Thousands of solar workers are being laid off each week, but with swift action from Congress, we know that solar can be a crucial part of our economic recovery,” with proposals such as the Biden solar plan offering a potential policy path, SEIA President and CEO Abigail Ross Hopper said in a statement, as recent analyses point to US solar and wind growth under supportive policies.

Subsequent data showed record U.S. panel shipments as the market rebounded.


Related News

View more

Sign Up for Electricity Forum’s Newsletter

Stay informed with our FREE Newsletter — get the latest news, breakthrough technologies, and expert insights, delivered straight to your inbox.

Electricity Today T&D Magazine Subscribe for FREE

Stay informed with the latest T&D policies and technologies.
  • Timely insights from industry experts
  • Practical solutions T&D engineers
  • Free access to every issue

Live Online & In-person Group Training

Advantages To Instructor-Led Training – Instructor-Led Course, Customized Training, Multiple Locations, Economical, CEU Credits, Course Discounts.

Request For Quotation

Whether you would prefer Live Online or In-Person instruction, our electrical training courses can be tailored to meet your company's specific requirements and delivered to your employees in one location or at various locations.