Remembering the Great Ice Storm

By National Post


CSA Z462 Arc Flash Training - Electrical Safety Essentials

Our customized live online or in‑person group training can be delivered to your staff at your location.

  • Live Online
  • 6 hours Instructor-led
  • Group Training Available
Regular Price:
$249
Coupon Price:
$199
Reserve Your Seat Today
Beyond their love of hockey and beer and their reputation for being nice and polite, millions of Canadians have something else in common - 10 years ago they were freezing in the dark for hours and days on end.

This weekend marks the 10th anniversary of the Great Ice Storm of 1998, when much of Ontario, Quebec and Canada's east coast suffered from one of the most devastating weather events in the country's history.

From Jan.5 to Jan. 10, a number of weather patterns and conditions coincided and produced a freak storm, the likes of which had never been experienced in Canada.

"It still remains to be the granddaddy of them all," David Phillips, senior climatologist at Environment Canada, says of the legendary storm that caused an estimated $2- billion in damage.

Ottawa and Montreal, for example, normally get 45 to 65 hours of precipitation a year. During the six days of the ice storm, they received nearly double that annual total.

Freezing rain, ice pellets and wet snow fell on Eastern Canada, for hours at a time and day after day, coating the region in thick sheets of ice because of the sub-zero temperatures.

Major cities and the rural communities in between them were quite literally, frozen solid.

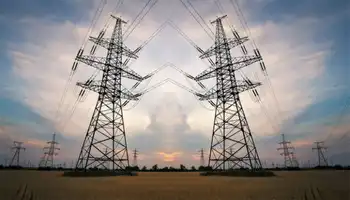
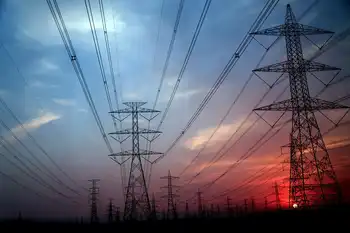
The weight of the ice caused the collapse of building roofs, snapped huge trees as if they were twigs, toppled more than 100 major power transmission towers and brought down 120,000 kilometres of power lines and telephone cables. Roads were blocked and people were stranded.

About four million Canadians were forced to live a pioneer life with no heat, electricity, or running water.

Catherine Alexander, a Brockville, Ont., resident was one of them. She and her family were trapped in their house for four days because downed power lines were strewn across the driveway. They used the home's fireplace to keep warm and waded past the ice in the freezing St. Lawrence River next to the house to fetch water. It was a week before they had power again.

Among her memories of the ice storm, Alexander recalls people phoning into the local radio station asking how to save their freezing goldfish. Her own family pet, a cockatoo named Chester, managed to survive the crisis.

While some could stay in their homes, an estimated 100,000 people sought refuge in shelters and others moved in with friends or relatives.

A state of emergency was declared in many communities when it became clear the storm was sticking around and that it was having dangerous and deadly effects.

Twenty-five people died as a result of the storm, many of them from hypothermia.

"It was this bizarre situation," recalls Jim Watson, Ottawa mayor at the time and now an MPP for the city. "On the one hand it was the most beautiful scene you could imagine, this glistening aura of trees and icicles but on the other hand, lives were lost, businesses were lost, people were hurt."

Gillian Baker, a volunteer with the Red Cross in 1998, recalls how the crisis brought out the best in people. She said phones at the Red Cross were ringing off the hook with people both looking for help and with those willing to provide it.

"We complain, and we honk our horns but when push comes to shove we'll help each other out," said Ms. Baker. Throughout the ice storm, the Red Cross mobilized more than 3,000 staff and volunteers in Ontario, Quebec and New Brunswick.

Ms. Baker recalls food and water being among the primary needs of the 334,000 people that the aid agency assisted.

She said the Red Cross learned valuable lessons from the ice storm experience and has recruited more volunteers, has better volunteer training and improved co-ordination with municipalities and other agencies, because of it.

The Canadian military was also called upon to help and Operation Recuperation involved the largest deployment of troops ever on Canadian soil in response to a natural disaster. More than 15,000 personnel helped evacuate people from their homes, clear roads, and provide back up for hydro crews and police forces.

The storm had enormous economic consequences and some businesses were so hard hit it took more than a decade to recover.

Quebec's maple syrup industry, for example, which produces 70% of the world's supply, was severely impacted because of the number of damaged trees. It was the same story for Ontario's producers and, according to the province's industry association, it could take 40 years before production returns to pre-1998 levels.

The Insurance Bureau of Canada reported 535,200 claims following the storm, totalling about $790-million in damage to homes, cars and other property. In fact, more individual insurance claims were made in Canada and the United States because of the ice storm than any other weather-related event in history, said Mr. Phillips.

Looking back on the storm 10 years later, Mr. Phillips draws two main conclusions: it could have been worse and it could happen again. That being said, when the Great Ice Storm's 50th anniversary arrives in 2048, Mr. Phillips predicts it will still be known as the biggest weather event in Canadian history.

"It's such a huge event that it's hard to imagine that we will have a duplication of that," he said.

Related News

Which of the cleaner states imports dirty electricity?

Hourly Electricity Emissions Tracking maps grid balancing areas, embodied emissions, and imports/exports, revealing carbon intensity shifts across PJM, ERCOT, and California ISO, and clarifying renewable energy versus coal impacts on health and climate.


Key Points

An hourly method tracing generation, flows, and embodied emissions to quantify carbon intensity across US balancing areas.

✅ Hourly traces of imports/exports and generation mix

✅ Consumption-based carbon intensity by balancing area

✅ Policy insights for renewables, coal, health costs


In the United States, electricity generation accounts for nearly 30% of our carbon emissions. Some states have responded to that by setting aggressive renewable energy standards; others are hoping to see coal propped up even as its economics get worse. Complicating matters further is the fact that many regional grids are integrated, and as America goes electric the stakes grow, meaning power generated in one location may be exported and used in a different state entirely.

Tracking these electricity exports is critical for understanding how to lower our national carbon emissions. In addition, power from a dirty source like coal has health and environment impacts where it's produced, and the costs of these aren't always paid by the parties using the electricity. Unfortunately, getting reliable figures on how electricity is produced and where it's used is challenging, even for consumers trying to find where their electricity comes from in the first place, leaving some of the best estimates with a time resolution of only a month.

Now, three Stanford researchers—Jacques A. de Chalendar, John Taggart, and Sally M. Benson—have greatly improved on that standard, and they have managed to track power generation and use on an hourly basis. The researchers found that, of the 66 grid balancing areas within the United States, only three have carbon emissions equivalent to our national average, and they have found that imports and exports of electricity have both seasonal and daily changes. de Chalendar et al. discovered that the net results can be substantial, with imported electricity increasing California's emissions/power by 20%.

Hour by hour
To figure out the US energy trading landscape, the researchers obtained 2016 data for grid features called balancing areas. The continental US has 66 of these, providing much better spatial resolution on the data than the larger grid subdivisions. This doesn't cover everything—several balancing areas in Canada and Mexico are tied in to the US grid—and some of these balancing areas are much larger than others. The PJM grid, serving Pennsylvania, New Jersey, and Maryland, for example, is more than twice as large as Texas' ERCOT, in a state that produces and consumes the most electricity in the US.

Despite these limitations, it's possible to get hourly figures on how much electricity was generated, what was used to produce it, and whether it was used locally or exported to another balancing area. Information on the generating sources allowed the researchers to attach an emissions figure to each unit of electricity produced. Coal, for example, produces double the emissions of natural gas, which in turn produces more than an order of magnitude more carbon dioxide than the manufacturing of solar, wind, or hydro facilities. These figures were turned into what the authors call "embodied emissions" that can be traced to where they're eventually used.

Similar figures were also generated for sulfur dioxide and nitrogen oxides. Released by the burning of fossil fuels, these can both influence the global climate and produce local health problems.

Huge variation
The results were striking. "The consumption-based carbon intensity of electricity varies by almost an order of magnitude across the different regions in the US electricity system," the authors conclude. The low is the Bonneville Power grid region, which is largely supplied by hydropower; it has typical emissions below 100kg of carbon dioxide per megawatt-hour. The highest emissions come in the Ohio Valley Electric region, where emissions clear 900kg/MW-hr. Only three regional grids match the overall grid emissions intensity, although that includes the very large PJM (where capacity auction payouts recently fell), ERCOT, and Southern Co balancing areas.

Most of the low-emissions power that's exported comes from the Pacific Northwest's abundant hydropower, while the Rocky Mountains area exports electricity with the highest associated emissions. That leads to some striking asymmetries. Local generation in the hydro-rich Idaho Power Company has embodied emissions of only 71kg/MW-hr, while its imports, coming primarily from Rocky Mountain states, have a carbon content of 625kg/MW-hr.

The reliance on hydropower also makes the asymmetry seasonal. Local generation is highest in the spring as snow melts, but imports become a larger source outside this time of year. As solar and wind can also have pronounced seasonal shifts, similar changes will likely be seen as these become larger contributors to many of these regional grids. Similar things occur daily, as both demand and solar production (and, to a lesser extent, wind) have distinct daily profiles.

The Golden State
California's CISO provides another instructive case. Imports represent less than 30% of its total electric use in 2016, yet California electricity imports provided 40% of its embodied emissions. Some of these, however, come internally from California, provided by the Los Angeles Department of Water and Power. The state itself, however, has only had limited tracking of imported emissions, lumping many of its sources as "other," and has been exporting its energy policies to Western states in ways that shape regional markets.

Overall, the 2016 inventory provides a narrow picture of the US grid, as plenty of trends are rapidly changing our country's emissions profile, including the rise of renewables and the widespread adoption of efficiency measures and other utility trends in 2017 that continue to evolve. The method developed here can, however, allow for annual updates, providing us with a much better picture of trends. That could be quite valuable to track things like how the rapid rise in solar power is altering the daily production of clean power.

More significantly, it provides a basis for more informed policymaking. States that wish to promote low-emissions power can use the information here to either alter the source of their imports or to encourage the sites where they're produced to adopt more renewable power. And those states that are exporting electricity produced primarily through fossil fuels could ensure that the locations where the power is used pay a price that includes the health costs of its production.


Related News

View more

Court quashes government cancellation of wind farm near Cornwall

Nation Rise Wind Farm Ruling overturns Ontario cancellation, as Superior Court finds the minister's decision unreasonable; EDP Renewables restarts 100-megawatt project near Cornwall, citing jobs, clean energy, and procedural fairness over bat habitat concerns.


Key Points

Ontario court quashes cancellation, letting EDP Renewables finish 100 MW Nation Rise project and resume clean energy.

✅ Judges call minister's decision unreasonable, unfair

✅ EDP Renewables to restart construction near Cornwall

✅ 100 MW, 29 turbines; costs awarded, appeal considered


Construction of a wind farm in eastern Ontario, as wind power makes gains nationwide, will move ahead after a court quashed a provincial government decision to cancel the project.

In a ruling released Wednesday, a panel of Ontario Superior Court judges said the province's decision to scrap the Nation Rise Wind Farm in December 2019 did not meet the proper requirements.

At the time, Environment Minister Jeff Yurek revoked the approvals of the project near Cornwall, Ont., citing the risk to three bat species.

That decision came despite a ruling from the province's Environmental Review Tribunal that determined the risk the project posed to the bat population was negligible.

The judges said the minister's decision was "unreasonable" and "procedurally unfair."

"The decision does not meet requirements of transparency, justification, and intelligibility, as the Minister has failed to adequately explain his decision," the judges wrote in their decision.

The company behind the project, EDP Renewables, said the 29-turbine wind farm was almost complete when its approval was revoked in December, even as Alberta saw TransAlta scrap a wind farm in a separate development.

The company said Thursday it plans to restart construction on the 100-megawatt wind farm.

"EDPR is eager to recommence construction of the Nation Rise Wind Farm, which will bring much-needed jobs and investment to the community," the company said in a statement. "This delay has resulted in unnecessary expenditures to-date, at a time when governments and businesses should be focused on reducing costs and restarting the economy."

A spokesman for Yurek said the government is disappointed with the outcome of the case but did not comment on a possible appeal.

"At this time, we are reviewing the decision and are carefully considering our next steps," Andrew Buttigieg said in a statement.

NDP climate change critic Peter Tabuns said the court decision is an embarrassment for the minister and the government. He urged the government not to pursue an appeal.

Yurek "was found to have ignored the evidence and the facts," he said. "They didn't just lose, their case collapsed. They had nothing to stand on. Taking this to appeal would be a complete and total waste of money."

Green party Leader Mike Schreiner said the ruling proves the government was acting based on ideology over evidence when it revoked the project's approval.

"As we shift towards a post-COVID recovery, we need the Ford government to give up the irrational crusade against affordable and reliable clean energy," Schreiner said in a statement.

Last year, the NDP revealed the province had spent $231 million to cancel more than 750 renewable energy contracts, a move Ford said he was proud of, shortly after winning the 2018 election.

The Progressive Conservatives have blamed the previous Liberal government, as leadership candidates debate how to fix power, for signing the bad energy deals while the province had an oversupply of electricity.

The Ford government, amid a new stance on wind power, has also said that by cancelling the contracts it would ultimately save ratepayers $790 million -- a figure industry officials have disputed.

At the time of the wind farm cancellation, the government also said it would introduce legislation that would protect consumers from any costs incurred, though a developer warned cancellations could exceed $100M at the time.

It has since acknowledged it will have to pay some companies to cancel the deals and set aside $231 million to reach agreements with those firms, and more recently has moved to reintroduce renewable projects in some cases.

On Wednesday, the judges awarded Nation Rise $126,500 in costs, which the government will have to pay.


Related News

View more

Typical Ontario electricity bill set to increase nearly 2% as fixed pricing ends

Ontario Electricity Rates update: OEB sets time-of-use and tiered pricing for residential customers, with kWh charges for peak, mid-peak, and off-peak periods reflecting COVID-19 impacts on demand, supply costs, and pricing.


Key Points

Ontario Electricity Rates are OEB-set time-of-use and tiered prices that set per-kWh costs for residential customers.

✅ Time-of-use: 21.7 peak, 15.0 mid-peak, 10.5 off-peak cents/kWh

✅ Tiered: 12.6 cents/kWh up to 1000 kWh, then 14.6 cents/kWh

✅ Average 700 kWh home pays about $2.24 more per month


Energy bills for the typical Ontario home are going up by about two per cent with fixed pricing coming to an end on Nov. 1, the Ontario Energy Board says. 

The province's electricity regulator has released new time-of-use pricing and says the rate for the average residential customer using 700 kWh per month will increase by about $2.24.

The change comes as Ontario stretches into its eight month of the COVID-19 pandemic with new case counts reaching levels higher than ever seen before.

Time-of-use pricing had been scrapped for residential bills for much for the pandemic with a single fixed COVID-19 hydro rate set for all hours of the day. The move, which came into effect June 1, was meant "to support families, small business and farms while Ontario plans for the safe and gradual reopening of the province," the OEB said at the time.

Ontario later set the off-peak price until February 7 around the clock to provide additional relief.

Fixed pricing meant customers' bills reflected how much power they used, rather than when they used it. Customers were charged 12.8 cents/kWh under the COVID-19 recovery rate no matter their time of use.

Beginning November, the province says customers can choose between time-of-use and tiered pricing options. Rates for time-of-use plans will be 21.7 cents/kWh during peak hours, 15 cents/kWh for mid-peak use and 10.5 cents/kWh for off-peak use. 

Customers choosing tiered pricing will pay 12.6 cents/kWh for the first 1000 kWh each month and then 14.6 cents/kWh for any power used beyond that.

The energy board says the increase in pricing reflects "a combination of factors, including those associated with the COVID-19 pandemic, that have affected demand, supply costs and prices in the summer and fall of 2020."

Asked for his reaction to the move Tuesday, Premier Doug Ford said, "I hate it," adding the province inherited an energy "mess" from the previous Liberal government and are "chipping away at it."


Related News

View more

Hydro-Québec will refund a total of $535 million to customers who were account holders in 2018 or 2019

Hydro-Québec Bill 34 Refund issues $535M customer credits tied to electricity rates, consumption-based rebates, and variance accounts, averaging $60 per account and 2.49% of 2018-2019 usage, via bill credits or mailed cheques.


Key Points

A $535M credit refunding 2.49% of 2018-2019 usage to Hydro-Québec customers via bill credits or cheques.

✅ Applies to 2018-2019 consumption; average refund about $60.

✅ Current customers get bill credits; former customers receive cheques.

✅ Refund equals 2.49% of usage from variance accounts under prior rates.


Following the adoption of Bill 34 in December 2019, a total amount of $535 million will be refunded to customers who were Hydro-Québec account holders in 2018 or 2019. This amount was accumulated in variance accounts required under the previous rate system between January 1, 2018, and December 31, 2019.

If you are still a Hydro-Québec customer, a credit will be applied to your bill in the coming weeks, and improving billing layout clarity is a focus in some provinces as well. The amount will be indicated on your bill.

An average refund amount of $60. The refund amount is calculated based on the quantity of electricity that each customer consumed in 2018 and 2019. The refund will correspond to 2,49% of each customer's consumption between January 1, 2018, and December 31, 2019, for an average of approximately $60, while Ontario hydro rates are set to increase on Nov. 1.

The following chart provides an overview of the refund amount based on the type of home. Naturally, the number of occupants, electricity use habits and features of the home, such as insulation and energy efficiency, may have a significant impact on the amount of the refund, and in other provinces, oversight debates continue following a BC Hydro fund surplus revelation.

What if you were an account holder in 2018 or 2019 but you are no longer a Hydro-Québec customer?
People who were account holders in 2018 or 2019, but who are no longer Hydro-Québec customers will receive their credit by cheque, a lump sum credit approach seen elsewhere.

To receive their cheque, these people must get in touch to update their address in one of the following ways:  

If they have a Hydro-Québec Customer Space and remember their access code, they can update their profile.

Anyone without a Customer Space or who doesn't remember their access code can fill out the Request for a credit form at the following address: www.hydroquebec.com/credit in which they can indicate the address where they wish to receive their cheque, where applicable.

Those who cannot send us their address online can call 514 385-7252 or 1 888 385-7252 to give it to a customer services representative, as utilities like Hydro One have moved to reconnect customers in some cases. Note that the process will take longer on the phone, especially if the call volume is high.

UPDATE: Hydro-Québec will be returning an additional $35 million to customers under the adoption of Bill 34, amid overcharging allegations reported elsewhere.

Energy Minister Jonatan Julien announced on Tuesday that the public utility will be refunding a total of $535 million to customers between January and April.

The legislation, which was passed in December, allows the Quebec government to take control of the rates charged for electricity in the province, including decisions on whether to seek a rate hike next year under the new framework.


Related News

View more

Climate change poses high credit risks for nuclear power plants: Moody's

Nuclear Plant Climate Risks span flood risk, heat stress, and water scarcity, threatening operations, safety systems, and steam generation; resilience depends on mitigation investments, cooling-water management, and adaptive maintenance strategies.


Key Points

Climate-driven threats to nuclear plants: floods, heat, and water stress requiring resilience and mitigation.

✅ Flooding threats to safety and cooling systems

✅ Heat stress reduces thermal efficiency and output

✅ Water scarcity risks limit cooling capacity


Climate change can affect every aspect of nuclear plant operations like fuel handling, power and steam generation and the need for resilient power systems planning, maintenance, safety systems and waste processing, the credit rating agency said.

However, the ultimate credit impact will depend upon the ability of plant operators to invest in carbon-free electricity and other mitigating measures to manage these risks, it added.
Close proximity to large water bodies increase the risk of damage to plant equipment that helps ensure safe operation, the agency said in a note.

Moody’s noted that about 37 gigawatts (GW) of U.S. nuclear capacity is expected to have elevated exposure to flood risk and 48 GW elevated exposure to combined rising heat, extreme heat costs and water stress caused by climate change.

Parts of the Midwest and southern Florida face the highest levels of heat stress, while the Rocky Mountain region and California face the greatest reduction in the availability of future water supply, illustrating the need for adapting power generation to drought strategies, it said.

Nuclear plants seeking to extend their operations by 20, or even 40 years, beyond their existing 40-year licenses in support of sustaining U.S. nuclear power and decarbonization face this climate hazard and may require capital investment adjustments, Moody’s said, as companies such as Duke Energy climate report respond to investor pressure for climate transparency.

“Some of these investments will help prepare for the increasing severity and frequency of extreme weather events, highlighting that the US electric grid is not designed for climate impacts today.”


Related News

View more

France's nuclear power stations to limit energy output due to high river temperatures

France Nuclear Heatwave Output Restrictions signal reduced reactor capacity along the Rhone River, as EDF curbs output to meet cooling-water rules, balance the grid, integrate solar peaks, and limit impacts on power prices.


Key Points

EDF limits reactor output during heat to protect rivers and keep the grid stable under cooling-water rules.

✅ Cuts likely at midday/weekends when solar peaks

✅ Bugey, Saint Alban maintain minimum grid output

✅ France net exporter; price impact expected small


The high temperature warning has come early this year but will affect fewer nuclear power plants, amid a broader France-Germany nuclear dispute over atomic power policy that shapes regional energy flows.

High temperatures could halve nuclear power production at plants along France's Rhone River this week, as European power hits records during extreme heat. 

Output restrictions are expected at two nuclear plants in eastern France due to high temperature forecasts, nuclear operator EDF said, which may limit energy output during heatwaves. It comes several days ahead of a similar warning that was made last year but will affect fewer plants.

The hot weather is likely to halve the available power supply from the 3.6 GW Bugey plant from 13 July and the 2.6 GW Saint Alban plant from 16 July, the operator said.

However, production will be at least 1.8 GW at Bugey and 1.3 GW at Saint Alban to meet grid requirements, and may change according to grid needs, the operator said.

Kpler analyst Emeric de Vigan said the restrictions were likely to have little effect on output in practice. Cuts are likely only at the weekend or midday when solar output was at its peak so the impact on power prices would be slim.

During recent lockdowns, power demand held firm in Europe, offering context for current price dynamics.

He said the situation would need monitoring in the coming weeks, however, noting it was unusually early in the summer for such restrictions to be imposed.

Water temperatures at the Bugey plant already eclipsed the initial threshold for restrictions on 9 July, underscoring France's outage risks under heat-driven constraints. They are currently forecast to peak next week and then drop again, Refinitiv data showed.

"France is currently net exporting large amounts of power – single nuclear units' supply restrictions will not have the same effect as last year," Refinitiv analyst Nathalie Gerl said.

The Garonne River in southern France has the highest potential for critical levels of warming, but its Golfech plant is currently offline for maintenance until mid-August, the data showed, highlighting how Europe is losing nuclear power during critical periods.

"(The restrictions were) to be expected and it will probably occur more often," Greenpeace campaigner Roger Spautz said.

"The authorities must stick to existing regulations for water discharges. Otherwise, the ecosystems will be even more affected," he added.


Related News

View more

Sign Up for Electricity Forum’s Newsletter

Stay informed with our FREE Newsletter — get the latest news, breakthrough technologies, and expert insights, delivered straight to your inbox.

Electricity Today T&D Magazine Subscribe for FREE

Stay informed with the latest T&D policies and technologies.
  • Timely insights from industry experts
  • Practical solutions T&D engineers
  • Free access to every issue

Download the 2025 Electrical Training Catalog

Explore 50+ live, expert-led electrical training courses –

  • Interactive
  • Flexible
  • CEU-cerified