TVA looks to renewable sources

By Knoxville News Sentinel


NFPA 70e Training

Our customized live online or in‑person group training can be delivered to your staff at your location.

  • Live Online
  • 6 hours Instructor-led
  • Group Training Available
Regular Price:
$199
Coupon Price:
$149
Reserve Your Seat Today
TVA, which has an increased emphasis on clean energy, renewable energy and energy efficiency, has two contracts for renewable energy with Waste Management in Tennessee.

TVA has just signed a 20-year contract with Waste Management to buy 4.8 megawatts of power from a landfill-biogas facility at Camden in West Tennessee. That contract is the first in TVA's new renewable standard offer initiative.

TVA pays a set price — or a "standard offer" — for renewable power based on the time of day the electricity is available to the TVA power grid. TVA's Renewable Standard Offer initially will be limited to a total of 100 megawatts from all participants, with no single renewable technology representing more than 50 megawatts of the total.

The Chestnut Ridge facility along the Knox-Anderson county line has been providing electricity for about 1,600 homes that are KUB customers. TVA and Waste Management have been partners in the Chestnut Ridge power contract for nearly 20 years.

TVA also buys power — 3 megawatts — from methane facilities at Middle Point Landfill in Murfreesboro, Tenn., and 8 megawatts from the city of Memphis wastewater treatment plant.

TVA spokesman Mike Bradley said the agency does not discuss pricing for the renewable energy contracts, citing the information as "business sensitive."

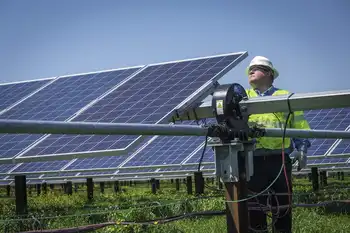
TVA, which also gets renewable energy from wind, solar and biomass and customers, has an agreement with the state of Tennessee to buy up to 5 megawatts of electricity from a solar farm being built in Haywood County in West Tennessee. The University of Tennessee and the state are developing that facility.

The agency has added 1,625 megawatts of wind energy — 300 megawatts from an Illinois company and 29 megawatts from the Buffalo Mountain turbines near Oliver Springs.

TVA's Generation Partners program — for very small power producers — includes more than 560 participants that produce about 65 megawatts of power from solar biomass, wind and low-impact hydro generation.

Related News

Diesel Prices Return to Pre-Ukrainian Conflict Levels

France Diesel Prices at Pre-Ukraine Levels reflect energy market stabilization as supply chains adapt and subsidies help; easing fuel costs, inflation, and logistics burdens for households, transport firms, and the wider economy.


Key Points

They mark normalization as oil supply stabilizes, easing fuel costs and logistics expenses for consumers and firms.

✅ Lower transport and logistics operating costs

✅ Softer inflation and improved household budgets

✅ Market stabilization amid adjusted oil supply chains


In a significant development for French consumers and businesses alike, diesel prices in France have recently fallen back to levels last seen before the Ukrainian conflict began, mirroring European gas prices returning to pre-war levels across the region. This drop comes as a relief to many who have been grappling with volatile energy costs and their impact on the cost of living and business operations. The return to lower diesel prices is a noteworthy shift in the energy landscape, with implications for the French economy, transportation sector, and broader European market.

Context of Rising Diesel Prices

The onset of the Ukrainian conflict in early 2022 triggered a dramatic increase in global energy prices, including diesel. The conflict's disruption of supply chains, coupled with sanctions on Russian oil and gas exports, contributed to a steep rise in fuel prices across Europe, prompting the EU to weigh emergency electricity price measures to shield consumers. For France, this meant that diesel prices soared to unprecedented levels, putting significant pressure on consumers and businesses that rely heavily on diesel for transportation and logistics.

The impact was felt across various sectors. Transportation companies faced higher operational costs, which were often passed down to consumers in the form of increased prices for goods and services. Additionally, higher fuel costs contributed to broader inflationary pressures, with EU inflation hitting lower-income households hardest, affecting household budgets and overall economic stability.

Recent Price Trends and Market Adjustments

The recent decline in diesel prices in France is a welcome reversal from the peak levels experienced during the height of the conflict. Several factors have contributed to this price reduction. Firstly, there has been a stabilization of global oil markets as geopolitical tensions have somewhat eased and supply chains have adjusted to new realities. The gradual return of Russian oil to global markets, albeit under complex sanctions and trading arrangements, has also played a role in moderating prices.

Moreover, France's strategic reserves and diversified energy sources have helped cushion the impact of global price fluctuations. The French government has also implemented measures to stabilize energy prices, including subsidies and tax adjustments, and a new electricity pricing scheme to satisfy EU concerns, which have helped alleviate some of the financial pressure on consumers.

Implications for the French Economy

The return to pre-conflict diesel price levels brings several positive implications for the French economy. For consumers, the decrease in fuel prices means lower transportation costs, which can ease inflationary pressures and improve disposable income, and, alongside the EDF electricity price deal, reduce overall utility burdens for households. This is particularly beneficial for households with long commutes or those relying on diesel-powered vehicles.

For businesses, especially those in the transportation and logistics sectors, the drop in diesel prices translates into reduced operational costs. This can help lower the cost of goods and services, potentially leading to lower prices for consumers and improved profitability for businesses. In a broader sense, stabilized fuel prices can contribute to overall economic stability and growth, as lower energy costs can support consumer spending and business investment.

Environmental and Policy Considerations

While the decrease in diesel prices is advantageous in the short term, it also raises questions about long-term energy policy and environmental impact, with the recent crisis framed as a wake-up call for Europe to accelerate the shift away from fossil fuels. Diesel, as a fossil fuel, continues to pose environmental challenges, including greenhouse gas emissions and air pollution. The drop in prices might inadvertently discourage investments in cleaner energy alternatives, such as electric and hybrid vehicles, which are crucial for achieving long-term sustainability goals.

In response, there is a growing call for continued investment in renewable energy and energy efficiency measures. France has been actively pursuing policies to reduce its reliance on fossil fuels and increase the adoption of cleaner technologies, amid ongoing EU electricity reform debates with Germany. The government’s support for green energy initiatives and incentives for low-emission vehicles will be essential in balancing short-term benefits with long-term environmental objectives.

Conclusion

The recent return of French diesel prices to pre-Ukrainian conflict levels marks a significant shift in the energy market, offering relief to both consumers and businesses. While this decline brings immediate financial benefits and supports economic stability, it also underscores the ongoing need for a strategic approach to energy policy and environmental sustainability. As France navigates the evolving energy landscape, the focus will need to remain on fostering a transition towards cleaner energy sources while managing the economic and environmental impacts of fuel price fluctuations.


Related News

View more

Ontario's electricity operator kept quiet about phantom demand that cost customers millions

IESO Fictitious Demand Error inflated HOEP in the Ontario electricity market, after embedded generation was mis-modeled; the OEB says double-counted load lifted wholesale prices and shifted costs via the Global Adjustment.


Key Points

An IESO modeling flaw that double-counted load, inflating HOEP and charges in Ontario's wholesale market.

✅ Double-counted unmetered load from embedded generation

✅ Inflated HOEP; shifted costs via Global Adjustment

✅ OEB flagged transparency; exporters paid more


For almost a year, the operator of Ontario’s electricity system erroneously counted enough phantom demand to power a small city, causing prices to spike and hundreds of millions of dollars in extra charges to consumers, according to the provincial energy regulator.

The Independent Electricity System Operator (IESO) also failed to tell anyone about the error once it noticed and fixed it.

The error likely added between $450 million and $560 million to hourly rates and other charges before it was fixed in April 2017, according to a report released this month by the Ontario Energy Board’s Market Surveillance Panel.

It did this by adding as much as 220 MW of “fictitious demand” to the market starting in May 2016, when the IESO started paying consumers who reduced their demand for power during peak periods. This involved the integration of small-scale embedded generation (largely made up of solar) into its wholesale model for the first time.

The mistake assumed maximum consumption at such sites without meters, and double-counted that consumption.

The OEB said the mistake particularly hurt exporters and some end-users, who did not benefit from a related reduction of a global adjustment rate applicable to other customers.

“The most direct impact of the increase in HOEP (Hourly Ontario Energy Price) was felt by Ontario consumers and exporters of electricity, who paid an artificially high HOEP, to the benefit of generators and importers,” the OEB said.

The mix-up did not result in an equivalent increase in total system costs, because changes to the HOEP are offset by inverse changes to a electricity cost allocation mechanism such as the Global Adjustment rate, the OEB noted.


A chart from the OEB's report shows the time of day when fictitious demand was added to the system, and its influence on hourly rates.

Peak time spikes
The OEB said that the fictitious demand “regularly inflated” the hourly price of energy and other costs calculated as a direct function of it.

For almost a year, Ontario's electricity system operator @IESO_Tweets erroneously counted enough phantom demand to power a small city, causing price spikes and hundreds of millions in charges to consumers, @OntEnergyBoard says. @5thEstate reports.

It estimated the average increase to the HOEP was as much as $4.50/MWh, but that price spikes, compounded by scheduled OEB rate changes, would have been much higher during busier times, such as the mid-morning and early evening.

“In times of tight supply, the addition of fictitious demand often had a dramatic inflationary impact on the HOEP,” the report said.

That meant on one summer evening in 2016 the hourly rate jumped to $1,619/MWh, it said, which was the fourth highest in the history of the Ontario wholesale electricity market.

“Additional demand is met by scheduling increasingly expensive supply, thus increasing the market price. In instances where supply is tight and the supply stack is steep, small increases in demand can cause significant increases in the market price.

The OEB questioned why, as of September this year, the IESO had failed to notify its customers or the broader public, amid a broader auditor-regulator dispute that drew political attention, about the mistake and its effect on prices.

“It's time for greater transparency on where electricity costs are really coming from,” said Sarah Buchanan, clean energy program manager at Environmental Defence.

“Ontario will be making big decisions in the coming years about whether to keep our electricity grid clean, or burn more fossil fuels to keep the lights on,” she added. “These decisions need to be informed by the best possible evidence, and that can't happen if critical information is hidden.”

In a response to the OEB report on Monday, the IESO said its own initial analysis found that the error likely pushed wholesale electricity payments up by $225 million. That calculation assumed that the higher prices would have changed consumer behaviour, while upcoming electricity auctions were cited as a way to lower costs, it said.

In response to questions, a spokesperson said residential and small commercial consumers would have saved $11 million in electricity costs over the 11-month period, even as a typical bill increase loomed province-wide, while larger consumers would have paid an extra $14 million.

That is because residential and small commercial customers pay some costs via time-of-use rates, including a temporary recovery rate framework, the IESO said, while larger customers pay them in a way that reflects their share of overall electricity use during the five highest demand hours of the year.

The IESO said it could not compensate those that had paid too much, given the complexity of the system, and that the modelling error did not have a significant impact on ratepayers.

While acknowledging the effects of the mistake would vary among its customers, the IESO said the net market impact was less than $10 million, amid ongoing legislation to lower electricity rates in Ontario.

It said it would improve testing of its processes prior to deployment and agreed to publicly disclose errors that significantly affect the wholesale market in the future.


Related News

View more

Over 30% of Global Electricity from Renewables

Global Renewable Electricity Milestone signals solar, wind, hydro, and geothermal surpass 30% of power generation, driven by falling costs, battery storage, smart grids, and ambitious policy targets that strengthen energy security and decarbonization.


Key Points

It marks renewables exceeding 30% of global power, enabled by cheaper tech, storage, and strong policy.

✅ Costs of solar and wind fall, boosting competitiveness

✅ Storage and smart grids improve reliability and flexibility

✅ Policies target decarbonization while ensuring just transition


A recent report by the energy think tank Ember marks a significant milestone in the global energy transition. For the first time ever, according to their analysis, renewable energy sources like solar, wind, hydro, and geothermal now account for more than 30% of the world's electricity generation, a milestone echoed by wind and solar growth globally. This achievement signifies a pivotal shift towards a cleaner and more sustainable energy future.

The report attributes this growth to several key factors. Firstly, the cost of renewable energy technologies like solar panels and wind turbines has plummeted in recent years, making them increasingly competitive with traditional fossil fuels. Secondly, advancements in battery storage technology are facilitating the integration of variable renewable sources like solar and wind into the grid, addressing concerns about reliability. Thirdly, a growing number of countries are implementing ambitious renewable energy targets and policies, driven by environmental concerns and the desire for energy security.

The rise of renewables is not uniform across the globe. Europe leads the pack, with the European Union generating a staggering 44% of its electricity from renewable sources in 2023. Countries like Denmark, Germany, and Spain are at the forefront of this clean energy revolution. Developing nations are also starting to embrace renewables, driven by factors like falling technology costs and the need for affordable electricity access.

However, challenges remain. Fossil fuels still dominate the global energy mix, accounting for roughly two-thirds of electricity generation. Integrating a higher proportion of variable renewables into the grid necessitates robust storage solutions and smart grid technologies. Additionally, the transition away from fossil fuels needs to be managed carefully to ensure a just and equitable outcome for workers in the coal, oil, and gas sectors.

Despite these challenges, the report by Ember paints an optimistic picture. The rapid growth of renewables demonstrates their increasing viability and underscores the global commitment to a cleaner energy future, and in the United States, for example, renewables are projected to reach one-fourth of U.S. electricity generation, reinforcing this trajectory. The report also highlights the economic benefits of renewables, with new jobs created in the clean energy sector and reduced reliance on volatile fossil fuel prices.

Looking ahead, continued technological advancements, supportive government policies, and increased investment in renewable energy infrastructure are all crucial for further growth, with scenarios such as BNEF's 2050 outlook suggesting wind and solar could provide half of electricity, underscoring the importance of sustained effort. Furthermore, international cooperation is essential to ensure a smooth and equitable global energy transition. Developed nations can play a vital role by sharing technology and expertise with developing countries.

The 30% milestone is a significant step forward, but it's just the beginning. As the world strives to combat climate change and ensure energy security for future generations, renewables are poised to play a central role in powering a sustainable future, with wind and solar surpassing coal in the U.S. offering a clear signal of the shift. The report by Ember serves as a powerful reminder that a clean energy future is not just a dream, but a rapidly unfolding reality.


Related News

View more

EV Fires Raise Health Concerns for Firefighters

EV Firefighter Cancer Risks: lithium-ion battery fires, toxic metals like nickel and chromium, hazardous smoke plumes, and prolonged exposure threaten first responders; SCBA use, decontamination, and evidence-based protocols help reduce occupational health impacts.


Key Points

Health hazards from EV battery fires exposing responders to toxic metals and smoke, elevating long-term cancer risk.

✅ Nickel and chromium in EV smoke linked to lung and sinus cancers

✅ Use SCBA, on-scene decon, and post-incident cleaning to cut exposure

✅ Adopt EV fire SOPs: cooling, monitoring, isolation, air monitoring


As electric vehicles (EVs) become more popular, the EV fire risks to firefighters are becoming an increasing concern. These fires, fueled by the high-capacity lithium-ion batteries in EVs, produce dangerous chemical exposures that could have serious long-term health implications for first responders.

Claudine Buzzo, a firefighter and cancer survivor, knows firsthand the dangers that come with the profession. She’s faced personal health battles, including rare pancreatic cancer and breast cancer, both of which she attributes to the hazards of firefighting. Now, as EV adoption increases and some research links adoption to fewer asthma-related ER visits in local communities, Buzzo and her colleagues are concerned about how EV fires might add to their already heavy exposure to harmful chemicals.

The fire risks associated with EVs are different from those of traditional gasoline-powered vehicles. Dr. Alberto Caban-Martinez, who is leading a study at the Sylvester Comprehensive Cancer Center, explains that the high concentrations of metals released in the smoke from an EV fire are linked to various cancers. For instance, nickel, a key component in EV batteries, is associated with lung, nasal, and laryngeal cancers, while chromium, another metal found in some EV batteries, is linked to lung and sinus cancers.

Research from the Firefighter Cancer Initiative indicates that the plume of smoke from an EV fire contains significantly higher concentrations of these metals than fires from traditional vehicles. This raises the risk of long-term health problems for firefighters who respond to such incidents.

While the Electric Vehicle Association acknowledges the risks associated with various types of vehicle fires, they maintain that the lithium-ion batteries in EVs may not present a significantly higher risk than other common fire hazards, even as broader assessments suggest EVs are not a silver bullet for climate goals. Nonetheless, the growing body of research is causing concern among health experts, urging for further studies into how these new types of fires could affect firefighter health and how upstream electricity generation, where 18% of electricity in 2019 came from fossil fuels in Canada, factors into overall risk perceptions.

Fire departments and health researchers are working to understand the full scope of these risks and are emphasizing the importance of protective gear, such as self-contained breathing apparatuses, to minimize exposure during EV fire responses, while also considering questions like grid impacts during charging operations and EV sustainability improvements in different regions.


Related News

View more

Study: US Power Grid Has More Blackouts Than ENTIRE Developed World

US Power Grid Blackouts highlight aging infrastructure, rising outages, and declining reliability per DOE and NERC data, with weather-driven failures, cyberattack risk, and underinvestment stressing utilities, transmission lines, and modernization efforts.


Key Points

US power grid blackouts are outages caused by aging grid assets, severe weather, and cyber threats reducing reliability.

✅ DOE and NERC data show rising outage frequency and duration.

✅ Weather now drives 68-73% of major failures since 2008.

✅ Modernization, hardening, and cybersecurity investments are critical.


The United States power grid has more blackouts than any other country in the developed world, according to new data and U.S. blackout warnings that spotlight the country’s aging and unreliable electric system.

The data by the Department of Energy (DOE) and the North American Electric Reliability Corporation (NERC) shows that Americans face more power grid failures lasting at least an hour than residents of other developed nations.

And it’s getting worse.

Going back three decades, the US grid loses power 285 percent more often than it did in 1984, when record keeping began, International Business Times reported. The power outages cost businesses in the United States as much as $150 billion per year, according to the Department of Energy.

Customers in Japan lose power for an average of 4 minutes per year, as compared to customers in the US upper Midwest (92 minutes) and upper Northwest (214), University of Minnesota Professor Massoud Amin told the Times. Amin is director of the Technological Leadership Institute at the school.

#google#

The grid is becoming less dependable each year, he said.

“Each one of these blackouts costs tens of hundreds of millions, up to billions, of dollars in economic losses per event,” Amin said. “… We used to have two to five major weather events per year [that knocked out power], from the ‘50s to the ‘80s. Between 2008 and 2012, major outages caused by weather, reflecting extreme weather trends, increased to 70 to 130 outages per year. Weather used to account for about 17 to 21 percent of all root causes. Now, in the last five years, it’s accounting for 68 to 73 percent of all major outages.”

As previously reported by Off The Grid News, the power grid received a “D+” grade on its power grid report card from the American Society of Civil Engineers (ASCE) in 2013. The power grid grade card rating means the energy infrastructure is in “poor to fair condition and mostly below standard, with many elements approaching the end of their service life.” It further means a “large portion of the system exhibits significant deterioration” with a “strong risk of failure.”

“America relies on an aging electrical grid and pipeline distribution systems, some of which originated in the 1880s,” the 2013 ASCE report read. “Investment in power transmission has increased since 2005, but ongoing permitting issues, weather events, and limited maintenance have contributed to an increasing number of failures and power interruptions.”

As The Times noted, the US power grid as it exists today was built shortly after World War II, with the design dating back to Thomas Edison. While Edison was a genius, he and his contemporaries could not have envisioned all the strains the modern world would place upon the grid and the multitude of tech gadgets many Americans treat as an extension of their body. While the drain on the grid has advanced substantially, the infrastructure itself has not.

There are approximately 5 million miles of electrical transmission lines throughout the United States, and thousands of power generating plants dot the landscape. The electrical grid is managed by a group of 3,300 different utilities and serve about 150 million customers, The Times said. The entire power grid system is currently valued at $876 billion.

Many believe the grid is vulnerable to an attack on substations and other threats.

Former Department of Homeland Security Secretary Janet Napolitano once said that a power grid cyber attack is a matter of “when” not “if,” as Russians hacked utilities incidents have shown.


Related News

View more

Imported coal volumes up 17% during Apr-Oct as domestic supplies shrink

India Thermal Power Coal Imports surged 17.6% as CEA-monitored plants offset weaker CIL and SCCL supplies, driven by Saubhagya-led electricity demand, regional power deficits, and varied consumption across Uttar Pradesh, Bihar, Maharashtra, and Gujarat.


Key Points

Fuel volumes imported for Indian thermal plants, tracked by CEA, reflecting shifts in CIL/SCCL supply, demand, and regional power deficits.

✅ Imports up 17.6% as domestic CIL/SCCL deliveries lag targets

✅ Saubhagya-driven demand lifts generation in key beneficiary states

✅ Industrial slowdowns cut usage in Maharashtra, Tamil Nadu, Gujarat


The receipt of imported coal by thermal power plants, where plant load factors have risen, has shot up by 17.6 per cent during April-October. The coal import volumes refer to the power plants monitored by the Central Electricity Authority (CEA), and come amid moves to ration coal supplies as electricity demand surges, a power update report from CARE Ratings showed.

Imports escalated as domestic supplies by Coal India Ltd (CIL) and another state run producer- Singareni Collieries Company Ltd (SCCL) dipped in the period, after earlier shortages that have since eased in later months. Rate of supplies by the two coal companies to the CEA monitored power stations stood at 80.4 per cent, indicating a shortfall of 19.6 per cent against the allocated quantity.

According to the study by CARE Ratings, total coal supplied by CIL and SCCL to the power sector stood at 315.9 million tonnes (mt) during April-October as against 328.5 mt in the comparable period of last fiscal year.

The study noted that growth in power generation during the April-October 2019, with India now the third-largest electricity producer globally, was on account of higher demand from Pradhan Mantri Sahaj Bijli Har Ghar Yojana or Saubhagya Scheme beneficiary states. Providing connection to households in order to achieve 100% per cent electrification has in part helped the sector avert de-growth, as part of efforts to rewire Indian electricity and expand access.

Large states namely Uttar Pradesh, Bihar, Punjab, West Bengal and Rajasthan have recorded over five per cent growth in consumption of power. These states along with Odisha, Madhya Pradesh and Assam accounted for 75 per cent of the beneficiaries under the Saubhagya Scheme (Household Electrification Scheme). The ongoing economic downturn has led to a sharp fall in electricity demand from industrialised states. Maharashtra, which is also the largest power consuming state in India, recorded a decline in consumption of 5.6 per cent.

Other states namely Tamil Nadu, Telangana, Gujarat and Odisha too recorded fall in power consumed, echoing global dips in daily electricity demand seen later during the pandemic. These states house large clusters of mining, automobile, cement and other manufacturing industries, and a decline in these sectors led to fall in demand for power across these states. - The demand-supply gap or power deficit has remained at 0.6 per cent during the April-October 2019. North-East reported 4.8 per cent of power deficit followed by Northern Region at 1.3 per cent. Within Northern Region, Jammu & Kashmir and Uttar Pradesh accounted for 65 per cent and 30 per cent respectively of the regions power supply deficit.


Related News

View more

Sign Up for Electricity Forum’s Newsletter

Stay informed with our FREE Newsletter — get the latest news, breakthrough technologies, and expert insights, delivered straight to your inbox.

Electricity Today T&D Magazine Subscribe for FREE

Stay informed with the latest T&D policies and technologies.
  • Timely insights from industry experts
  • Practical solutions T&D engineers
  • Free access to every issue

Live Online & In-person Group Training

Advantages To Instructor-Led Training – Instructor-Led Course, Customized Training, Multiple Locations, Economical, CEU Credits, Course Discounts.

Request For Quotation

Whether you would prefer Live Online or In-Person instruction, our electrical training courses can be tailored to meet your company's specific requirements and delivered to your employees in one location or at various locations.