Electrical Commissioning In Industrial Power Systems
Our customized live online or in‑person group training can be delivered to your staff at your location.

- Live Online
- 12 hours Instructor-led
- Group Training Available
Regular Price:
$599
Coupon Price:
$499
DEC India thermal power contracts highlight exports of 660-MW and 600-MW coal-fired units, BTG packages, turbines, boilers, and generators, supporting power plant expansion and China-India energy projects with multi-gigawatt orders.
Story Summary
Exports of BTG packages and coal-fired units to India, including 600-660 MW equipment and long-term service support.
- Lanco partnership advances 660-MW unit exports
- >10 GW of Indian thermal equipment orders to date
- BTG supply for 2x1,000 MW Deyuan Fugu expansion
- BTG for Shaoguan 2x600 MW and Maoming 600 MW units
- $7B new orders; $3.3B settled in first three quarters
Dongfang Electric Corporation Limited, the listed flagship of Dongfang Electric Corporation (DEC), signed a contract with Lanco Infratech Limited, a subsidiary of Lanco Group to supply six 660-megawatt (MW) ultra-supercritical power units, including boilers, for three Indian coal-fired power projects in Chengdu, DEC announced.
"Lanco is a long-term partner of DEC in the Indian market, where Indian heavy electrical giants are set to grow, according to recent industry reports. The signing of the contract will further enhance the cooperation between the parties, and further promote the export of DEC's 660-MW units," said DEC in the announcement.
In 2007, DEC took over a contract from Indian rival Bharat Heavy Electricals Limited and supplied two 600-MW coal-fired units for the Nagarjuna power project in Mangalore. After this, DEC received more orders from the Indian market, while peers such as SEPDI secured notable overseas contracts in parallel. To better serve the Indian market, DEC set up an Indian service center in 2008. To date, DEC has received more than 10 gigawatts of thermal power equipment orders from India, accounting for more than 40% of the total power equipment exported from China to India.
This contract is the third large thermal power equipment order received this month. DEC signed a contract with Shandong Luneng Group Company Limited to supply boiler, turbine and generator packages and major auxiliary equipment for two 1,000-megawatt (MW) coal-fired units in the Phase II expansion project of the Deyuan Fugu power plant amid NDRC approvals accelerating nationwide this quarter.
DEC signed the contracts with Guangdong Yuedian Group Company Limited to supply BTG packages for two 600-MW coal-fired units to Shaoguan power plant and a 600-MW coal-fired unit for the Maoming Thermal power plant as two large coal plants in China recently began operations, underscoring continued investment.
DEC is one of the top-three power equipment manufacturers in China. In the first three quarters of this year, DEC settled $3.3 billion of orders and received new orders totaling $7 billion.
Related News
Related News
UCP scraps electricity price cap, some will see $7 bill increase this month
Edmonton Electricity Rate Increase signals Alberta RRO changes as the UCP ends the NDP price…
View more

Ukraine Boosts Electricity Imports From Europe as Grid Faces War Strain
Ukraine has increased electricity imports from Europe to stabilize its energy system after Russian strikes…
View more

Survivors of deadly tornadoes may go weeks without heat, water, electricity, Kentucky officials say
Kentucky Tornado Recovery details Mayfield damage, death toll, power outages, boil-water advisories, shelter operations, and…
View more
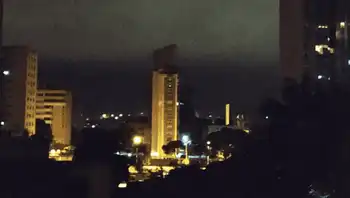
Venezuela: Electricity Recovery Continues as US Withdraws Diplomatic Staff
Venezuela Power Outage cripples the national grid after a massive blackout; alleged cyber attacks at…
View more
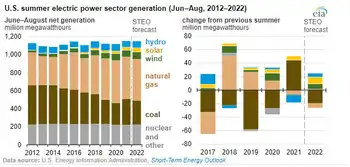
EIA expects solar and wind to be larger sources of U.S. electricity generation this summer
US Summer Electricity Outlook 2022 projects rising renewable energy generation as utility-scale solar and wind…
View more
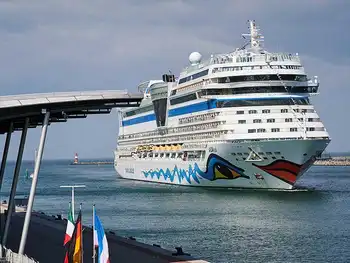
Europe's largest shore power plant opens
AIDAsol shore power Rostock-Warnemfcnde delivers cold ironing for cruise ships, up to 20 MVA at…
View more
Sign Up for Electricity Forum’s Newsletter
Stay informed with our FREE Newsletter — get the latest news, breakthrough technologies, and expert insights, delivered straight to your inbox.
Electricity Today T&D Magazine Subscribe for FREE

Stay informed with the latest T&D policies and technologies.
- Timely insights from industry experts
- Practical solutions T&D engineers
- Free access to every issue

