NFPA 70E Training
Our customized live online or in‑person group training can be delivered to your staff at your location.

- Live Online
- 6 hours Instructor-led
- Group Training Available
Regular Price:
$199
Coupon Price:
$149
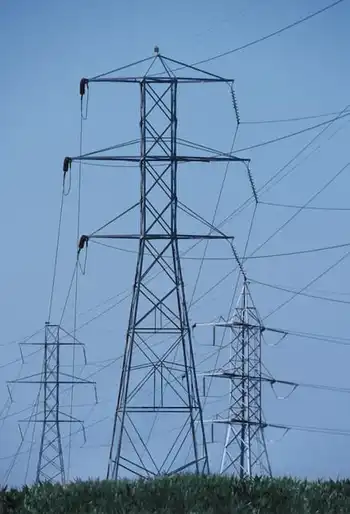
Duke Energy is going to tap a landfill in Durham for methane gas that will be turned into electricity.
Duke said it had signed a contract with Methane Power, a renewable energy developer, to purchase two megawatts of power that will be produced by methane that is created by the landfill.
Financial terms were not disclosed. The agreement covers 20 years.
However, Duke Energy estimated the cost of the power would be “less than 10 cents a year” for residential customers.
Duke Energy has more than 2.3 million customers.
The gas is currently burned off at the landfill, which has been closed for several years.
According to Duke Energy, the gas will produce enough power for 1,600 residential customers. Duke expects to begin producing power as of May 1, 2009.
The agreement is one of several Duke Energy has signed in recent months to acquire energy from renewable resources, including three solar projects. Duke Energy also is investing in wind power projects.
Related News
Germany turns to coal for a third of its electricity
Germany's Coal Reliance reflects an energy crisis, soaring natural gas prices, and a nuclear phase-out,…
View more
Alberta Electricity market needs competition
Alberta Electricity Market faces energy-only vs capacity debate as transmission, distribution, and administration fees surge;…
View more

3-layer non-medical masks now recommended by Canada's top public health doctor
Canada Three-Layer Mask Recommendation advises non-medical masks with a polypropylene filter layer and tightly woven…
View more
UK Lockdown knocks daily electricity demand by 10 per cent
Britain Electricity Demand During Lockdown is around 10 percent lower, as industrial consumers scale back.…
View more
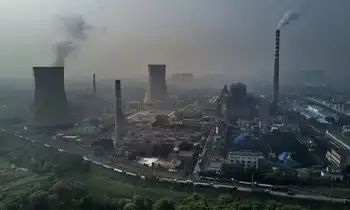
Global use of coal-fired electricity set for biggest fall this year
Global Coal Power Decline 2019 signals a record fall in coal-fired electricity as China plateaus,…
View more
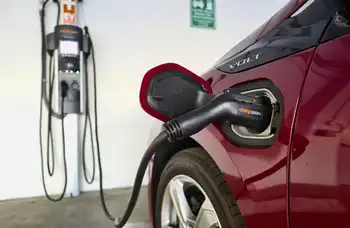
Electric cars will challenge state power grids
Electric Vehicle Grid Integration aligns EV charging with grid capacity using smart charging, time-of-use rates,…
View more
Sign Up for Electricity Forum’s Newsletter
Stay informed with our FREE Newsletter — get the latest news, breakthrough technologies, and expert insights, delivered straight to your inbox.
Electricity Today T&D Magazine Subscribe for FREE

Stay informed with the latest T&D policies and technologies.
- Timely insights from industry experts
- Practical solutions T&D engineers
- Free access to every issue

