Protective Relay Training - Basic
Our customized live online or in‑person group training can be delivered to your staff at your location.

- Live Online
- 12 hours Instructor-led
- Group Training Available
Regular Price:
$699
Coupon Price:
$599
TEHRAN
—
Iran Power Outage Protests surge as electricity blackouts, drought, and a looming heat wave spark unrest in Tehran, Shiraz, and more, with chants against leadership, strikes, and sanctions-driven economic pressures mounting.
The Important Points
Protests across Iran over blackouts, drought, and economic strain challenge authorities and demand accountability.
Government blames severe drought and peak demand for outages
Hydroelectric output down, thermal plants under heavy load
Grid shortfall near 11GW; heat wave threatens further strain
Protests challenge legitimacy amid election turnout and rights concerns
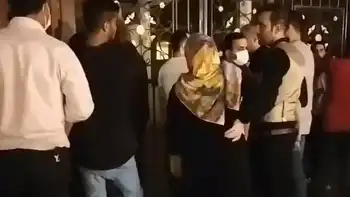
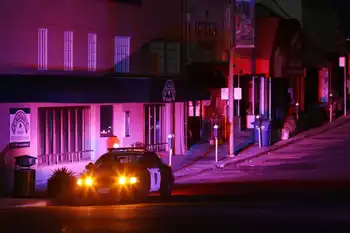
There have been protests in a number of cities in Iran amid rising public anger over widespread electricity blackouts.
Videos on social media appeared to show crowds in Shar-e Rey near Tehran, Shiraz, Amol and elsewhere overnight.
Some people can be heard shouting "Death to the dictator" and "Death to Khamenei" - a reference to Supreme Leader Ayatollah Ali Khamenei.
The government has apologised for the blackouts, which it has blamed on a severe drought and high demand.
Elsewhere, similar outages have had political repercussions, as a widespread power outage in Taiwan prompted a minister's resignation earlier this year.
President Hassan Rouhani explained in televised remarks on Tuesday morning that the drought meant most of the country's hydroelectric power plants were not operating, placing more pressure on thermal power plants, and that electricity consumption had surged as people used air conditioning to cope with the intense summer heat.
"I apologise to our dear people who have faced problems and suffering in the past few days and I urge them to co-operate [by cutting their electricity use]. People complain about power outages and they are right," Mr Rouhani said.
A video that has gone viral in recent days shows a woman complaining about the blackouts and corruption at a government office in the northern city of Gorgan and demanding that her comments be conveyed to "higher-ups like Mr Rouhani". "The only thing you have done is forcing hijab on us," she shouts.
The president has promised that the government will seek to resolve the problems within the next two or three weeks.
However, a power sector spokesman warned on Monday that consumption was exceeding the production capacity of Iran's power plants by 11GW, and said a "looming heat wave" could make the situation worse, as seen in Iraq's summer electricity crunch this year.
Iranians have also been complaining about water shortages and the non-payment of wages by some local authorities, while thousands of people working in Iran's oil industry have been on strike over pay and conditions, as officials discuss further energy cooperation with Iraq to ease supply pressures.
There was already widespread discontent at government corruption and the economic hardship caused by sanctions that were reinstated when the US abandoned a nuclear deal with Iran three years ago, even as Iran supplies about 40% of Iraq's electricity through cross-border sales.
Analysts say that after the historically low turnout in last month's presidential election, when more than half of the eligible voters stayed at home, the government is facing a serious challenge to its legitimacy.
Mr Rouhani will be succeeded next month by Ebrahim Raisi, a hard-line cleric close to Ayatollah Khamenei who won 62% of the vote after several prominent contenders were disqualified, while Iran finalizes power grid deals with Iraq to bolster regional ties.
The 60-year-old former judiciary chief has presented himself as the best person to combat corruption and solve Iran's economic problems, including ambitions to transmit electricity to Europe as a regional power hub.
But many Iranians and human rights activists have pointed to his human rights record, accusing him of playing a role in the executions of thousands of political prisoners in the 1980s and in the deadly crackdowns on mass anti-government protests in 2009 and 2019.
Related News
Related News
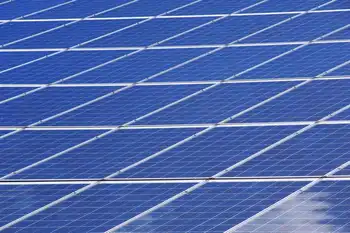
Blackout-Prone California Is Exporting Its Energy Policies To Western States, Electricity Will Become More Costly And Unreliable
California Blackouts expose grid reliability risks as PG&E deenergizes lines during high winds. Mandated solar…
View more

Tories 'taking the heart out of Manitoba Hydro' by promoting subsidiaries, scrapping low-cost pledges: NDP
Manitoba Hydro Privatization Debate centers on subsidiaries, Crown corporation governance, clean energy priorities, and electricity…
View more
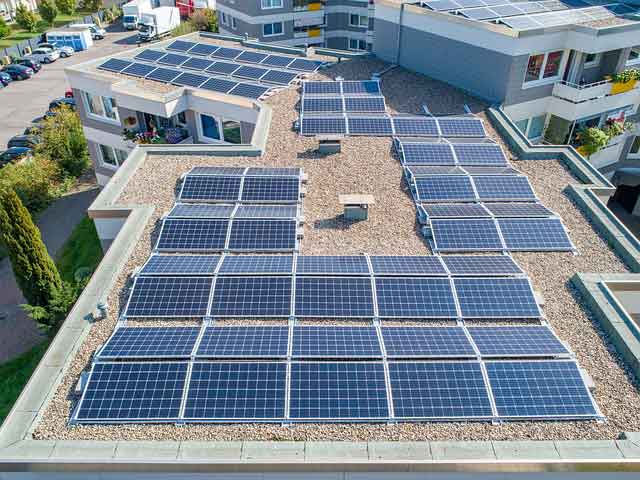
Omnidian Acquires Australia's Solar Service Guys to Expand Global Reach
Omnidian Acquisition of Solar Service Guys accelerates global expansion in renewable energy, enhancing solar maintenance…
View more
Explainer: Europe gets ready to revamp its electricity market
EU Electricity Market Reform seeks to curb gas-driven volatility by expanding CfDs and PPAs, decoupling…
View more
Expanding EV Charging Infrastructure in Calgary's Apartments and Condos
Calgary EV Charging for Apartments and Condos streamlines permitting for multi-unit dwellings, guiding condo boards…
View more
British Columbia Halts Further Expansion of Self-Driving Vehicles
BC Autonomous Vehicle Ban freezes new driverless testing and deployment as BC develops a regulatory…
View more
Sign Up for Electricity Forum’s Newsletter
Stay informed with our FREE Newsletter — get the latest news, breakthrough technologies, and expert insights, delivered straight to your inbox.
Electricity Today T&D Magazine Subscribe for FREE

Stay informed with the latest T&D policies and technologies.
- Timely insights from industry experts
- Practical solutions T&D engineers
- Free access to every issue

