Protective Relay Training - Basic
Our customized live online or in‑person group training can be delivered to your staff at your location.

- Live Online
- 12 hours Instructor-led
- Group Training Available
Regular Price:
$699
Coupon Price:
$599
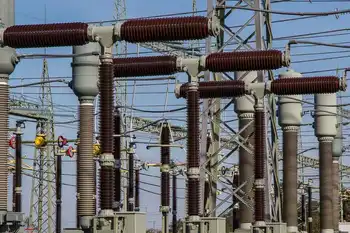
A $159.7 million project to increase the capacity of the national grid will be completed by the end of 2018, a government official said on Tuesday.
The Green Corridor project will boost the grid's capacity by an additional 1,000 megawatts MW to absorb the loads generated by new renewable energy projects, said Abdel Fattah Daradkeh, director general of the National Electric Power Company NEPCO. The grid's capacity currently stands at 3,600MW.
The state-owned company will start inviting bids in July from prequalified companies to implement the project, Daradkeh told The Jordan Times.
"In October, we will announce the winning bidder for the project, which is a very important cornerstone towards adopting more renewable energy projects in Jordan," said the official.
A committee will be formed to study the bids, he added.
The project will be completed by October 2018, said Daradkeh, adding that renewable energy projects with a capacity of more than 500MW will be connected to the grid by the end of 2018. "Expanding the grid's capacity is the key step to allow for more renewable energy projects and to make Jordan a leader in this area," he added.
In Jordan, the annual daily average of solar irradiance ranges from 5-7 kWh/m2, which is almost twice the ratio in Germany, which by mid-2015 generated 34 per cent of its electricity via renewable energy project. Despite that, renewable energy projects in Jordan contribute 3 to 4 per cent to the national electricity grid and the figure is scheduled to reach 10 per cent by 2020.
Meanwhile, the wind speed in Jordan is around 10 metres per second in some places in the country, which makes it a favourable place for wind farms.
In January, Energy Minister Ibrahim Saif said the project to expand the capacity of the national grid would be established in the southern region.
The Jordan News Agency, Petra, quoted Saif as saying the project is a priority for the sector, and that it would involve building a substation in northern Maan, extending power cables and expanding the Qatraneh and Queen Alia International Airport stations.
The European Investment Bank extended a $72 million loan to finance the Green Corridor project, while the French Development Agency provided a $54.9 million soft loan and NEPCO contributed $12.6 million, in addition to an EU grant of $20.2 million offered under the Neighbourhood Investment Facility, Petra reported.
Related News
Hydro One announces pandemic relief fund for Hydro One customers
Hydro One Pandemic Relief Fund offers COVID-19 financial assistance, payment flexibility, and Winter Relief to…
View more
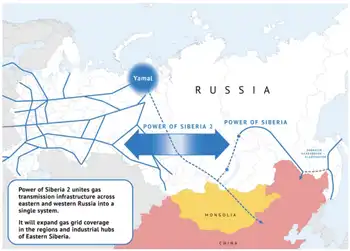
Russia to triple electricity supplies to China
Amur-Heihe ETL Power Supply Tripling will expand Russia-China electricity exports, extending 750 MW DC full-load…
View more
Heating and Electricity Costs in Germany Set to Rise
Germany 2025 Energy Costs forecast electricity and heating price trends amid gas volatility, renewables expansion,…
View more

California's solar energy gains go up in wildfire smoke
California Wildfire Smoke Impact on Solar reduces photovoltaic output, as particulate pollution, soot, and haze…
View more
Ontario Energy Board prohibiting electricity shutoffs during latest stay-at-home order
OEB Disconnection Ban shields Ontario residential customers under the stay-at-home order, pausing electricity distributor shutoffs…
View more
Ukraine Resumes Electricity Exports
Ukraine Electricity Exports resume as the EU grid links stabilize; ENTSO-E caps, megawatt capacity, renewables,…
View more
Sign Up for Electricity Forum’s Newsletter
Stay informed with our FREE Newsletter — get the latest news, breakthrough technologies, and expert insights, delivered straight to your inbox.
Electricity Today T&D Magazine Subscribe for FREE

Stay informed with the latest T&D policies and technologies.
- Timely insights from industry experts
- Practical solutions T&D engineers
- Free access to every issue

