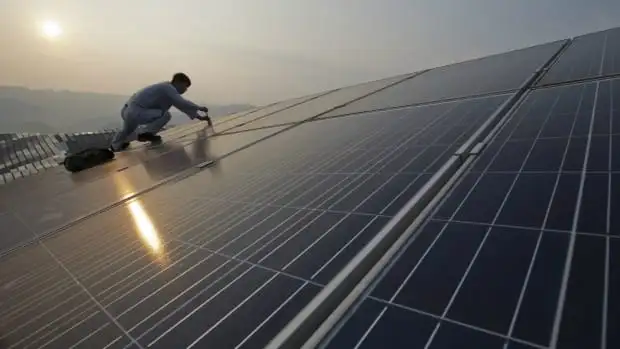
Solar Wars Draw Millions in Cash in Threat to Rooftop Industry
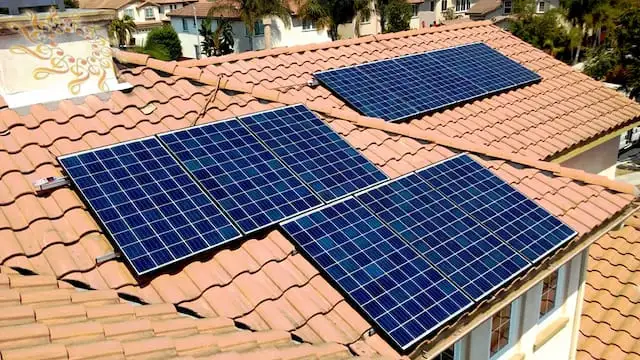

Solar Panels - Arizona

Arc Flash Training - CSA Z462 Electrical Safety

Our customized live online or in‑person group training can be delivered to your staff at your location.

  • Live Online
  • 6 hours Instructor-led
  • Group Training Available
Regular Price:
$249
Coupon Price:
$199
Reserve Your Seat Today

Arizona Rooftop Solar Battle intensifies as regulators weigh net metering, utility fees, and solar credits; APS, Pinnacle West, and SolarCity flood elections, shaping Arizona Corporation Commission policy and statewide renewable energy incentives.


Key Points

A high-stakes clash over net metering, utility fees, and solar credits before Arizona regulators, affecting consumers.

✅ Utilities seek higher fees and lower net metering credits

✅ Solar firms fund campaigns to sway regulator elections

✅ Decision could reshape statewide rooftop solar economics


Arizona - November 3, 2016 - There’s a war brewing over the future of rooftop solar, and Arizona is at ground zero.

Pinnacle West Capital Corp., which owns the state’s largest utility, last week said it has formed a third-party group to support candidates for an elected state board that regulates their industry. The move promises to inject $1 million into a race in which SolarCity Corp., a rooftop solar provider, is already planning to spend $2 million though a nonprofit it supports, according to officials from the two groups.

It’s the latest twist in a three-year political battle, mirrored by debates over energy freedom in the South among advocates, that’s been punctuated by charges of undue influence, an ongoing probe by the U.S. Attorney’s office and $300,000 in threatened state fines. At stake: A board ruling on a request to raise fees and drastically cut how much homeowners are paid for the solar energy they generate. It’s a decision, foes say, with the potential to hamstring a growing renewables industry.

“It’s not surprising that you are seeing campaign-style tactics in what should be a wonky policy matter because there is a lot at stake here,” said Tyson Slocum, director of the energy program at Public Citizen, a consumer advocacy group. “The rooftop solar issue has become broadly politicized.”

Utilities nationwide are pushing regulators to cut mandated solar payments, as they seek to tilt the solar market in their favor, an expense they say requires them to boost rates on non-solar customers in order to maintain the grid. Solar supporters, meanwhile, say a big drop in the amount paid to homeowners would undermine the benefits of switching to green power and imperil the industry’s double-digit annual growth.

A decision by Arizona, which last year generated the third most solar power in the U.S., could serve as a bellwether for national change at a time when as many as two dozen other states are weighing the same issue, with a Michigan push to eliminate rooftop caps highlighting the trend, according to a report by the North Carolina Clean Energy Technology Center.

In December, Nevada regulators voted to allow utilities to increase fees and reduce payments to home solar users. A month later, California rejected reduced solar credits, even as electricity pricing changes pose an existential threat to residential rooftop solar there. Now, the spotlight swings to Arizona, one of only 14 states with an elected board -- the Arizona Corporation Commission -- that sets regulatory policy and utility rates.

Arizona has long required utilities to pay consumers for solar energy they put back into the grid. In November 2013, the commission allowed utilities to assess a small connection fee to offset part of that payment. Now, the commission is being asked to consider a proposal from Pinnacle West’s Arizona Public Service unit that would almost triple the fee for some customers to $24 a month, and cut consumer credits for solar power by as much as 80 percent. 

Arizona Public Service has more than 50,000 customers with home solar. To pay them, the company estimated it will have to raise bills for non-solar customers by $51 million annually starting next year. At the same time, as consumer choice in California suddenly reshapes the electricity business, a June report from Credit Suisse Group AG said approving the new proposal could make solar "uneconomic" across a state that is among the nation’s leaders in the use of home solar.

Public Debate

The issue has spurred an active public debate, pulling in homeowners from both sides of the argument.

Those without solar say they shouldn’t be paying extra for those who do. "People with solar panels on their roofs think they ought to have free electricity," said Fannalou Guggisberg, a retired military chaplain in Sun City West. "I don’t think it’s fair for them to sell back electricity and not pay any taxes on it.”

Proponents counter that charging a fee only serves to discourage the growth of home solar as a feasible energy alternative. "APS is actually battling solar people," said Russell Taylor, a cabinet maker in Goodyear. "They want a monopoly."

Meanwhile, the involvement of the companies has drawn the attention of U.S. and state authorities.

Two Subpoenas

In a U.S. filing in August, Pinnacle West said it received two grand jury subpoenas from the U.S. attorney in June seeking information on the commission’s 2014 elections. While the FBI wouldn’t discuss the specifics of the subpoenas, spokeswoman Jill McCabe confirmed the agency is investigating “certain statewide races in the 2014 election cycle.”

Alan Bunnell, a spokesman for Pinnacle West, has said the company is “cooperating fully with the U.S. Attorney’s office in this matter.”

The probe follows public complaints by a former commissioner, Sandra Kennedy, that the company sought to improperly influence the 2013 fee decision. A year later, Kennedy lost a bid to rejoin the commission in a campaign that saw two nonprofit groups spend $3.2 million in support of board candidates favorable to Pinnacle West.

Spokesmen for both non-profit groups -- Save Our Future Now, and the Arizona Free Enterprise Club -- declined to identify their benefactors, or to comment for this article. James McDonald, a spokesman for the Arizona Public Service unit, declined to say whether the company contributed to either.

"We’ve always complied with all disclosure requests," McDonald said in an e-mail. "We have an obligation to our customers and our shareholders to be politically active.”

Missed Deadlines

SolarCity, meanwhile, hasn’t gone unscathed.

Kris Mayes, president of the nonprofit group Save our AZ Solar, confirmed that SolarCity is its sole funder after the company’s spokeswoman, Suzanne Merkelson, referred calls to her. The group, which records show has received $2 million in contributions, faces fines of as much as $300,000 for missing deadlines on filing reports, according to Thomas Collins, executive director of the Arizona Citizens Clean Elections Commission.

Save our AZ Solar is trying to settle the matter with the commission for $8,000 to $15,000, Mayes said, adding that any violations were inadvertent. "We have been all about transparency and disclosure from the very beginning," she said.

For the 2016 election, Pinnacle West formed the AZ Coalition for Reliable Electricity to openly back three Republicans for board seats, the company said in an e-mailed statement on Oct. 24. Matthew Benson, the group’s spokesman, confirmed the $1 million spending target.

Robert Burns, a commissioner backed by SolarCity in his re-election bid, said he’s concerned about the amount of financing attached to the race. "But there’s nothing I can do about it," he said, noting that the commission has called on companies with business before it to refrain from funding commission campaigns. "I can’t control what they do."


Related News

Related News

NEB: Demand for solar electricity lagging behind in Canada

Canada Solar Energy lags despite falling costs, with 0.5% of electricity from solar, largely in Ontario. NEB reports renewables replacing coal, while wind, hydro, and utility-scale capacity grow alongside distributed rooftop systems.


Key Points

Canada Solar Energy refers to the nation's solar market, supplying 0.5% of electricity, mostly concentrated in Ontario.

✅ 0.5% of Canada's electricity from solar, mainly in Ontario

✅ Costs per watt near $0.95; utility and rooftop PV expanding

✅ Wind and hydro grow as coal is phased out by 2030


Although the cost to build solar power has plummeted over the last decade, a new report suggests Canadians aren't rushing use the sun to make electricity.

The National Energy Board has released its annual look at the state of renewable energy in Canada and it says solar energy accounts for just 0.5 per cent of all Canada's generated electricity.

And almost all of that exists entirely in Ontario, the report notes, though renewable growth projections were scaled back after a provincial clean energy program was scrapped by policymakers.

NEB chief economist Shelley Milutinovic said the trend in Canada is that renewable energy sources like wind and solar are replacing coal as Canada moves to eliminate that as a source of electricity by 2030.

Between 2005 and 2016, non-hydroelectric renewables - wind, solar and biomass - grew from 1.5 per cent of total electricity generation in Canada to 7.2 per cent.

During that same period coal fell from 16 per cent to 9.3 per cent as a source of power. Canada intends to eliminate coal as a source of power by 2030 and only four provinces still get any power from the fossil fuel.

The Organization for Economic Co-operation and Development released a review of Canada's environmental policies this week which gave the country a rough ride for its energy-intensive, high-emitting, resource-based economy, but did point to Canada's electrical supply as a positive.

Only about 20 per cent of Canada's electricity comes from fossil fuels now - divided almost equally between coal and natural gas. Nuclear energy accounts for 15 per cent of Canada's electricity supply.

The rest comes from renewables. Hydro is the big beast in that, responsible for almost 60 per cent of Canada's power in 2016. While actual hydro power generation has grown about seven per cent in the last decade, Canada ranks in the top 10 for hydropower jobs even as other renewables are exploding.

The amount of electricity generated by the wind is 20 times what it was in 2005, and wind as a percentage of total power grew from just 0.2 per cent in 2005 to 4.7 per cent in 2016.

Solar didn't exist as a source of power for utility companies in Canada a decade ago. By 2016, solar capacity was 2,310 megawatts, almost all of it in Ontario, and national capacity is set to hit 5 GW according to recent reports.

Outside of Ontario, solar installations are mostly quite small, though the Prairie Provinces are projected to lead upcoming renewable growth across Canada. The largest solar farm in western Canada is a two-megawatt one on the Green Acres Hutterite Colony east of Calgary.

Milutinovic said the costs of solar and wind are now very comparable to other sources of power which are making them more and more attractive.

The cost to install a solar panel is about one-tenth of what it was in 2000, at about 95 cents per watt, according to the International Energy Agency.

Despite that, Canada is outmatched in solar on the international scene.

While Canada's biggest solar farm is about 100 megawatts, India this year unleashed one 10 times as large. The Kunrool Ultra Mega Solar Park is the largest in the world with 1000 megawatts of installed capacity.

India had just 17 megawatts of installed solar capacity in 2010. It now has 12,000 megawatts.

China is the world's solar leader, both in the manufacturing of solar panels and their installation. In 2005, China had 70 megawatts of installed solar power. In 2016,China had developed 78,000 MW.

Canada is 13th in the world in the amount of installed solar capacity. Where Canada gets just 0.5 per cent of its power from solar, Italy gets 7.5 per cent, Germany gets 6.7 per cent, Japan 4.9 per cent, the United States 1.4 per cent, China 1.07 per cent, and the Netherlands outpaces Canada in solar output as well.

Milutinovic said the one thing not measured in this report however is the capacity for solar installations on private homes and businesses. She said some of the Ontario solar generation numbers include those, but elsewhere that is simply not being tracked.

So there is no good data on how many individuals now have solar panels on their roofs or how many farms have them in their fields.

She said it is one area governments should be looking at to get a better picture of what is actually happening on this front.


Related News

View more

India Proposes 70 Percent Duty on China, Malaysia Solar Imports

India Solar Safeguard Duty could impose a 70% tariff on Chinese and Malaysian solar cells and modules, citing serious injury, protecting domestic manufacturing, affecting imports, prices, tenders, and the 2017 record-low tariff trajectory.


Key Points

A proposed 70% provisional tariff on Chinese and Malaysian solar cells and modules to protect India's domestic industry.

✅ 70% provisional duty for 200 days on cells and modules

✅ Aims to prevent serious injury and job losses

✅ Likely to raise tariffs and slow tendered solar projects


India, the largest importer of Chinese solar equipment, proposed a 70 per cent "safeguard duty" on cells and modules shipped from China, where solar is cheaper than grid electricity in many cities, and Malaysia, citing “threat of serious injury” to the domestic industry.

Acting on an application by five local cell and module makers, the Directorate General of Safeguards, Customs and Central Excise made the proposal in a document dated Jan. 5. It recommended the levy remain in effect for 200 days, as Germany saw a solar power boost amid broader energy concerns.

“Existing critical circumstances justify the immediate imposition of a provisional safeguard duty in order to save the domestic industry from further serious injury, which would be difficult to repair,” the Finance Ministry said in the document, also citing the potential for job losses.

Globally, external shocks such as the coronavirus pandemic have stalled a third of new U.S. utility solar this year, according to one report.

India’s annual manufacturing capacity for solar cells is only around 3 GW, compared with the average requirement of 20 GW for its on-grid solar power sector, according to a government note last month. The rest has to be purchased on the international market, it said. The South Asian nation was the largest solar-cell and module importer from China last year, buying a third of that nation’s $8 billion of shipments from January through September, according to research by Bloomberg New Energy Finance.

The ministry’s document said China’s solar exports to India constituted 1.52 percent of its total global exports during 2012, a figure that surged to almost 22 percent in 2016.

“India’s solar story is built on Chinese panels, and the duty, if implemented, would mean the end of record low solar tariffs that we saw in 2017,” said Vandana Gombar, a BNEF analyst in New Delhi, even as India's solar growth slows in recent assessments.

The government’s proposal came after five domestic manufacturers — Adani Enterprises Ltd.-backed Mundra Solar PV Ltd., Indosolar Ltd., Jupiter Solar Power Ltd., Websol Energy Systems Ltd. and Helios Photo Voltaic Ltd. — filed an application on Dec. 5 seeking a duty on imports of solar cells “whether or not assembled in modules or panels.”


Related News

View more

China Solar PV grew faster than any other fuel in 2016

Solar PV Growth Forecast 2017-2022 highlights IEA projections of record renewable energy capacity, with China leading additions, wind power expansion, record-low auction prices, and solar surpassing coal in net growth across global electricity markets.


Key Points

An overview of IEA expectations for record solar PV expansion, leading renewables growth, and market trends through 2022.

✅ China, India, US drive two-thirds of capacity additions.

✅ Record-low auctions make solar and wind cost-competitive.

✅ Renewables near 30% of generation; coal gap narrows.


New solar PV capacity grew by 50% last year, with China accounting for almost half of the global expansion, according to the International Energy Agency’s latest renewables market analysis and forecast and IRENA’s 2016 record data highlighting the surge.

Boosted by a strong solar PV market, renewables accounted for almost two-thirds of net new power capacity around the world last year, with almost 165 gigawatts (GW) coming online, according to the new report, Renewables 2017. Renewables will continue to have a strong growth in coming years, with BNEF projections pointing to a 50% electricity share by 2050. By 2022, renewable electricity capacity should increase by 43%.

“We see renewables growing by about 1,000 GW by 2022, which equals about half of the current global capacity in coal power, which took 80 years to build,” said Dr Fatih Birol, the executive director of the IEA. “What we are witnessing is the birth of a new era in solar PV. We expect that solar PV capacity growth will be higher than any other renewable technology through 2022.”

This year’s renewable forecastis 12% higher than last year, keeping global renewable power on course to shatter records as upward revisions in China and India lead the way. Three countries – China, India and the United States – will account for two-thirds of global renewable expansion by 2022. Total solar PV capacity by then would exceed the combined total power capacities of India and Japan today.

In power generation, renewable electricity is expected to grow by more than a third by 2022 to over 8,000 terawatt hours, which is equivalent to the total power consumption of China, India and Germany combined. By then, renewables will account for 30% of power generation, up from 24% in 2016. The growth in renewable generation will be twice as large as that of gas and coal combined. Though coal remains the largest source of electricity generation in 2022, renewables close the generation gap with coal by half in just five years.

The deployment in solar PV and wind last year was accompanied by record-low auction prices, which fell as low as 3 cents per kwh (or kilowatt hour). Low announced prices for solar and wind were recorded in a variety of places, such as India, the United Arab Emirates, Mexico and Chile. These announced contract prices for solar PV and wind power purchase agreements are increasingly comparable or lower than generation cost of newly built gas and coal power plants, supporting the US move towards 30% from wind and solar as cost trends persist.

China remains the undisputed leader of renewable electricity capacity expansion over the forecast period with over 360 GW of capacity coming online, or 40% of the global total. China’s renewables growth is largely driven by concerns about air pollution and capacity targets that were outlined in the country’s 13th five-year plan to 2020. In fact, China already exceeded its 2020 solar PV target three years ahead of time and is set to achieve its onshore wind target in 2019. Still, the growing cost of renewable subsidies and grid integration issues remain two important challenges to further expansion.

Under an accelerated case – where government policy lifts barriers to growth – IEA analysis finds that renewable capacity growth could be boosted by another 30%, totalling an extra 1,150 GW by 2022 led by China. Solar PV and wind capacity in China could by then reach twice the total power capacity of Japan today.

India’s move to address the financial health of its utilities and tackle grid-integration issues drive a more optimistic forecast. By 2022, India renewable capacity will more than double. This growth is enough to overtake renewable expansion in the European Union for the first time. Solar PV and wind together represent 90% of India’s capacity growth as auctions yielded some of the world’s lowest prices for both technologies.

Despite policy uncertainties at the federal level, the United States remains the second-largest growth market for renewables, with one-fourth of US electricity projected to come from renewables soon. The main drivers for onshore wind and solar – such as multi-year federal tax incentives combined with renewable portfolio standards as well as state-level policies for distributed solar PV – remain strong. Still, the current uncertainty over proposed federal tax reforms, international trade and energy policies could alter the economic attractiveness of renewables and hamper their growth over our forecast period.

The report also provides detailed analysis on the renewable consumption of electric cars and off-grid solar deployment in Africa and developing Asia. Off-grid capacity in these regions will more than triple reaching over 3 000 MW in 2022 from industrial applications, solar home systems (SHSs) and mini-grids driven by government electrification programmes and private sector initiatives. While this represents less than 5% of total PV capacity installed in both regions, the economic impact is nonetheless significant, and brings basic electricity services to almost 70 million more people in developing Asia and sub-Saharan Africa in the next five years.

Power consumption of EVs – including cars, two- and-three wheelers and buses – is expected to double over the next five years, with renewable electricity estimated to represent almost 30% of their consumption by 2022, up from 26% today. EVs play a complementary role to biofuels, which represent 80% of growth in renewable energy consumption in transport. However, the share of renewables in total road transport energy consumption remains limited, increasing only from 4% in 2016 to almost 5% in 2022.


Related News

View more

Progress being made on doubling renewable electricity by 2030: SaskPower

SaskPower Renewable Energy 2030 advances 50% renewables through wind power, solar projects, and geothermal research, backed by natural gas capacity, grid integration, competitive procurement, PPAs, and capacity expansion to meet rising demand in Saskatchewan.


Key Points

SaskPower's plan to reach 50% renewable power by 2030 via wind, solar, geothermal research, and supporting natural gas.

✅ Plans to reach 2,100 MW wind and 60 MW solar by 2030

✅ Geothermal pilot via PPA; grid integration projects

✅ New gas plants add 700 MW+ for reliability, demand growth


SaskPower says progress is being made on its goal of increasing renewable electricity generation from the current 25 per cent to as much as 50 per cent by 2030, as outlined in its 2019-20 annual report released.

The Crown corporation announced in 2015 it would reduce emissions by 40 per cent below 2005 levels by 2030, which would involve doubling the percentage of renewable electricity.

“Developing cleaner electricity generation options is essential to power Saskatchewan’s future and I’m excited to see that future continuing to take shape,” Tim Eckel, SaskPower’s vice-president of asset management, planning and sustainability, said in a press release.

“In the past two years, we have started a number of new renewable generation projects as well as projects that support renewable integration. Saskatchewan people will see more of that as we continue towards 2030.”

SaskPower has announced plans to add 60 megawatt (MW) of ground solar generation by 2021 through a combination of competitive procurement, a partnership with First Nations Power Authority and community projects such as the Flying Dust First Nation agreement now under consideration.

A competitive process for Saskatchewan’s first 10 MW utility-scale solar project has also been launched.

Wind power capacity is expected to increase from the current 221 MW to around 2,100 MW by 2030. SaskPower has launched the competitive process to buy up to 200 MW of wind generation with the successful proponent expected to be named this spring.

A power purchase agreement with DEEP Earth Energy Production Corp. was signed in May to allow further research into the potential for Saskatchewan’s first geothermal power project under study.

At the same time, SaskPower said it must increase its overall generation capacity in response to the province’s growing demand for electricity, including during record power demand periods.

“We are evaluating the full range of generation options, including imports from Manitoba Hydro as needed, which will allow us to determine the portfolio that best allows us to deliver reliable, cost-effective and sustainable power,” the Crown corporation said in a press release.

SaskPower has started construction on the Chinook Power Station, which will add 350 MW of natural gas generation as well as announced site considerations for the province’s next 350 MW to 700 MW natural gas plant.


Related News

View more

Solar generation was 3% of U.S. electricity in 2020, but we project it will be 20% by 2050

According to our Electric Power Annual, solar power accounted for 3% of U.S. electricity generation from all sources in 2020. In our Short-Term Energy Outlook, we forecast that solar will account for 4% of U.S. electricity generation in 2021 and 5% in 2022. In our Annual Energy Outlook 2021 (AEO2021) Reference case, which assumes no change in current laws and regulations, we project that solar generation will make up 14% of the U.S. total in 2035 and 20% in 2050. These data include electricity generated from both utility-scale (those of 1 megawatt or more generating capacity) and small-scale (less than 1 megawatt) solar facilities in the electric power, residential, commercial, and industrial sectors.

Humans have been using solar energy for centuries and first produced solar-powered electricity in the United States in 1954. Currently, solar energy can generate electricity in two ways: solar photovoltaics (PV) and solar thermal. Solar PV cells, such as rooftop solar panels, directly convert sunlight into electricity. Solar thermal facilities use mirrors to concentrate sunlight at a central receptor and produce the high temperatures needed to generate electricity with a steam-powered turbine.

Increases in small-scale solar, particularly in the commercial and residential sectors, drove much of the early growth in U.S. solar electricity net generation. In 2011, small-scale solar accounted for 68% of total U.S. solar electricity net generation. However, utility-scale solar generation increased substantially in the United States during the past decade as average construction costs for solar power plants fell.

In our long-term projections, the electric power sector continues to produce the most solar generation, increasing from 68% of total solar generation in 2020 to 78% in 2050. The growing share of utility-scale generation is due in part to the availability of a 10% Investment Tax Credit (ITC) after 2023; in contrast, the ITC for small-scale solar has expired.

The AEO2021’s projected share of solar generation is affected by assumptions about the installed and operating costs of other generating technologies, particularly in later years of the projection period when the projected trends in solar are increasingly influenced by economic factors rather than policy. In a sensitivity case in which natural gas prices are higher than in the Reference case (the Low Oil and Gas Supply case), solar generation reaches 25% of total generation by 2050, compared with 20% in the Reference case. In another sensitivity case in which installed costs of renewables are lower than in the Reference case (the Low Renewables Costs case), solar generation makes up 27% of total generation by 2050.

View more

Wind and solar power could meet 80% of US electricity demand, study finds

U.S. Wind and Solar Power Potential shows 80 percent reliable supply via renewable energy, grid integration, energy storage, and transmission upgrades, while seasonal variability demands backup sources like nuclear, hydropower, and demand management.


Key Points

An estimate that wind and solar can supply 80 percent of US demand, with storage, transmission, and low-carbon backups.

✅ 36-year hourly weather data modeled supply and demand

✅ 80 percent reliable with 12-hour storage or continental transmission

✅ Beyond 80 percent needs seasonal storage, nuclear, hydro, demand response


The United States could reliably meet about 80 percent of its electricity demand with solar and wind power generation, according to scientists at the University of California, Irvine; the California Institute of Technology; and the Carnegie Institution for Science.

However, meeting 100 percent of electricity demand with only solar and wind energy, which helps explain why the grid isn't yet 100% renewable today, would require storing several weeks' worth of electricity to compensate for the natural variability of these two resources, the researchers said.

"The sun sets, and the wind doesn't always blow," noted Steven Davis, UCI associate professor of Earth system science and co-author of a renewable energy study published today in the journal Energy & Environmental Science. "If we want a reliable power system based on these resources, how do we deal with their daily and seasonal changes?"

The team analyzed 36 years of hourly U.S. weather data (1980 to 2015) to understand the fundamental geophysical barriers to supplying electricity with only solar and wind energy.

"We looked at the variability of solar and wind energy over both time and space and compared that to U.S. electricity demand," Davis said. "What we found is that we could reliably get around 80 percent of our electricity from these sources by building either a continental-scale transmission network or facilities that could store 12 hours' worth of the nation's electricity demand."

The researchers said that such expansion of transmission or storage capabilities would mean very substantial -- but not inconceivable -- investments, and initiatives like tenfold solar expansion would remake the U.S. electricity system. They estimated that the cost of the new transmission lines required, for example, could be hundreds of billions of dollars. In comparison, storing that much electricity with today's cheapest batteries would likely cost more than a trillion dollars, although prices are falling.

Other forms of energy stockpiling, such as pumping water uphill to later flow back down through hydropower generators, are attractive but limited in scope. The U.S. has a lot of water in the East but not much elevation, with the opposite arrangement in the West.

Fossil fuel-based electricity production is responsible for about 38 percent of U.S. carbon dioxide emissions -- CO2 pollution being the major cause of global climate change. Davis said he is heartened by the progress that has been made, such as when renewables surpassed coal in 2022 nationwide, and the prospects for the future.

"The fact that we could get 80 percent of our power from wind and solar alone is really encouraging," he said, and recent data show renewables hit a record 28% in April nationwide. "Five years ago, many people doubted that these resources could account for more than 20 or 30 percent."

But beyond the 80 percent mark, the amount of energy storage required to overcome seasonal and weather variabilities increases rapidly. "Our work indicates that low-carbon-emission power sources will be needed to complement what we can harvest from the wind and sun until storage and transmission capabilities are up to the job," said co-author Ken Caldeira of the Carnegie Institution for Science. "Options could include nuclear and hydroelectric power generation, as well as managing demand and other ways to meet decarbonization goals identified by researchers."


Related News

View more

Sign Up for Electricity Forum’s Newsletter

Stay informed with our FREE Newsletter — get the latest news, breakthrough technologies, and expert insights, delivered straight to your inbox.

Electricity Today T&D Magazine Subscribe for FREE

Stay informed with the latest T&D policies and technologies.
  • Timely insights from industry experts
  • Practical solutions T&D engineers
  • Free access to every issue

Live Online & In-person Group Training

Advantages To Instructor-Led Training – Instructor-Led Course, Customized Training, Multiple Locations, Economical, CEU Credits, Course Discounts.

Request For Quotation

Whether you would prefer Live Online or In-Person instruction, our electrical training courses can be tailored to meet your company's specific requirements and delivered to your employees in one location or at various locations.