Voters won't like hearing what new reactors cost

By Globe and Mail


Protective Relay Training - Basic

Our customized live online or in‑person group training can be delivered to your staff at your location.

  • Live Online
  • 12 hours Instructor-led
  • Group Training Available
Regular Price:
$699
Coupon Price:
$599
Reserve Your Seat Today
It's just as well that the Ontario Legislature added an aboriginal prayer to its proceedings that beseeched the Great Spirit for "your wisdom and your strength," because the government is soon going to test the patience of everyone in the province.

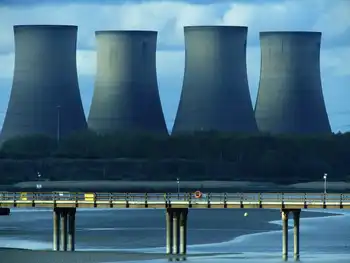
The selection of the Darlington nuclear generation station as the site of two new reactors moves this whole nuclear adventure one more step past the theoretical and nearer to the point where we know what it will cost. But even at this point it's a near certainty that the renewed program is going to be much more expensive than originally forecast, which would throw an element of confusion into Ontario's electricity system and threaten its economic health.

This is a speculation, of course. Now, we know only where the new reactors - the first since the original Darlington units went into service in 1993 - will be. We don't know the technology to be used - the Candu of Atomic Energy of Canada Ltd. or the designs of Areva NP or Westinghouse Electric Co. - but we will by the end of the year.

What we won't know for a very long while is how much this whole endeavour is going to cost. For now, that's good news for the government because few voters are going to like what they find out. Indeed, skepticism about nukes has been ingrained in Ontarians ever since the original Darlington plants opened a decade late and three times over initial cost estimates.

Energy Minister Gerry Phillips is right when he says that the cost overruns were mostly caused by a stop-start construction program. He hopes that fierce bidding among AECL, Areva and Westinghouse will keep costs down.

But there is a limit to what the firms can do as the costs of commodities, labour and high-tech fabrications soar.

When the government first received advice in 2005 about its power-supply system, the Ontario Power Authority was assuming nuclear construction costs of $2,600 per kilowatt or $2.6-billion for a 1,000-megawatt reactor. It is to dream. Now, a U.S. industry group, the Washington-based Nuclear Energy Institute, is saying that the figure is at least $3,500 per kilowatt and this might even be a low ball.

Last fall, for example, Moody's Investors Service said new reactors could cost as much as $6,000 per kilowatt. The company said this was "only marginally better than a guess," but this spring, Florida Light and Power proposed building new units at a cost of up to $8,000 per kilowatt or $12-billion per reactor.

"We are shocked at the magnitude of the escalation," said David Kraft, director of the Nuclear Energy Information Service, an anti-nuclear group in Chicago. He cited the cost of construction materials such as copper, steel and concrete as one reason for the surge in costs, but noted as well that the 20-year moratorium on construction has forced the industry to reinvent the specialized techniques that nuclear fission requires. Nuclear Energy Institute spokesman Steve Kerekes agreed that commodity prices "are up pretty substantially."

The government has been advised by the Ontario Power Authority that a $26-billion investment over 20 years will allow the construction of new reactors and the refurbishment of old ones to ensure that nuclear generation continues to provide about half the province's electricity. But if, as seems likely, the new Darlington reactors eat up a huge chunk of that budget, the question is where the money will come from to refurbish or replace the aged Pickering reactors or other projects not yet dreamed of.

"We are weak, we are small," says the Ojibwa prayer recited in the legislature. "We need your wisdom and strength."

Wise words, indeed.

Related News

On the road to 100 per cent renewables

US Climate Alliance 100% Renewables 2035 accelerates clean energy, electrification, and decarbonization, replacing coal and gas with wind, solar, and storage to cut air pollution, lower energy bills, create jobs, and advance environmental justice.


Key Points

A state-level target for alliance members to meet all electricity demand with renewable energy by 2035.

✅ 100% RES can meet rising demand from electrification

✅ Major health gains from reduced SO2, NOx, and particulates

✅ Jobs grow, energy burdens fall, climate resilience improves


The Union of Concerned Scientists joined with COPAL (Minnesota), GreenRoots (Massachusetts), and the Michigan Environmental Justice Coalition, to better understand the feasibility and implications of leadership states meeting 100 percent of their electricity needs with renewable energy by 2035, a target reflected in federal clean electricity goals under discussion today.

We focused on 24 member states of the United States Climate Alliance, a bipartisan coalition of governors committed to the goals of the 2015 Paris Climate Agreement. We analyzed two main scenarios: business as usual versus 100 percent renewable electricity standards, in line with many state clean energy targets now in place.

Our analysis shows that:

Climate Alliance states can meet 100 percent of their electricity consumption with renewable energy by 2035, as independent assessments of zero-emissions feasibility suggest. This holds true even with strong increases in demand due to the electrification of transportation and heating.

A transition to renewables yields strong benefits in terms of health, climate, economies, and energy affordability.

To ensure an equitable transition, states should broaden access to clean energy technologies and decision making to include environmental justice and fossil fuel-dependent communitieswhile directly phasing out coal and gas plants.

Demands for climate action surround us. Every day brings news of devastating "this is not normal" extreme weather: record-breaking heat waves, precipitation, flooding, wildfires. To build resilience and mitigate the worst impacts of the climate crisis requires immediate action to reduce heat-trapping emissions and transition to renewable energy, including practical decarbonization strategies adopted by states.

On the Road to 100 Percent Renewables explores actions at one critical level: how leadership states can address climate change by reducing heat-trapping emissions in key sectors of the economy as well as by considering the impacts of our energy choices. A collaboration of the Union of Concerned Scientists and local environmental justice groups COPAL (Minnesota), GreenRoots (Massachusetts), and the Michigan Environmental Justice Coalition, with contributions from the national Initiative for Energy Justice, assessed the potential to accelerate the use of renewable energy dramatically through state-level renewable electricity standards (RESs), major drivers of clean energy in recent decades. In addition, the partners worked with Greenlink Analytics, an energy research organization, to assess how RESs most directly affect people's lives, such as changes in public health, jobs, and energy bills for households.

Focusing on 24 members of the United States Climate Alliance (USCA), the study assesses the implications of meeting 100 percent of electricity consumption in these states, including examples like Rhode Island's 100% by 2030 plan that inform policy design, with renewable energy in the near term. The alliance is a bipartisan coalition of governors committed to reducing heat-trapping emissions consistent with the goals of the 2015 Paris climate agreement.[1]

On the Road to 100 Percent Renewables looks at three types of results from a transition to 100 percent RES policies: improvements in public health from decreasing the use of coal and gas2 power plants; net job creation from switching to more labor-oriented clean energy; and reduced household energy bills from using cleaner sources of energy. The study assumes a strong push to electrify transportation and heating to address harmful emissions from the current use of fossil fuels in these sectors. Our core policy scenario does not focus on electricity generation itself, nor does it mandate retiring coal, gas, and nuclear power plants or assess new policies to drive renewable energy in non-USCA states.

Our analysis shows that:

USCA states can meet 100 percent of their electricity consumption with renewable energy by 2035 even with strong increases in demand due to electrifying transportation and heating.

A transition to renewables yields strong benefits in terms of health, climate, economies, and energy affordability.

Renewable electricity standards must be paired with policies that address not only electricity consumption but also electricity generation, including modern grid infrastructure upgrades that enable higher renewable shares, both to transition away from fossil fuels more quickly and to ensure an equitable transition in which all communities experience the benefits of a clean energy economy.

Currently, the states in this analysis meet their electricity needs with differing mixes of electricity sourcesfossil fuels, nuclear, and renewables. Yet across the states, the study shows significant declines in fossil fuel use from transitioning to clean electricity; the use of solar and wind powerthe dominant renewablesgrows substantially:

In the study's "No New Policy" scenario"business as usual"coal and gas generation stay largely at current levels over the next two decades. Electricity generation from wind and solar grows due to both current policies and lowest costs.

In a "100% RES" scenario, each USCA state puts in place a 100 percent renewable electricity standard. Gas generation falls, although some continues for export to non-USCA states. Coal generation essentially disappears by 2040. Wind and solar generation combined grow to seven times current levels, and three times as much as in the No New Policy scenario.

A focus on meeting in-state electricity consumption in the 100% RES scenario yields important outcomes. Reductions in electricity from coal and gas plants in the USCA states reduce power plant pollution, including emissions of sulfur dioxide and nitrogen oxides. By 2040, this leads to 6,000 to 13,000 fewer premature deaths than in the No New Policy scenario, as well as 140,000 fewer cases of asthma exacerbation and 700,000 fewer lost workdays. The value of the additional public health benefits in the USCA states totals almost $280 billion over the two decades. In a more detailed analysis of three USCA statesMassachusetts, Michigan, and Minnesotathe 100% RES scenario leads to almost 200,000 more added jobs in building and installing new electric generation capacity than the No New Policy scenario.

The 100% RES scenario also reduces average energy burdens, the portion of household income spent on energy. Even considering household costs solely for electricity and gas, energy burdens in the 100% RES scenario are at or below those in the No New Policy scenario in each USCA state in most or all years. The average energy burden across those states declines from 3.7 percent of income in 2020 to 3.0 percent in 2040 in the 100% RES scenario, compared with 3.3 percent in 2040 in the No New Policy scenario.

Decreasing the use of fossil fuels through increasing the use of renewables and accelerating electrification reduces emissions of carbon dioxide (CO2), with implications for climate, public health, and economies. Annual CO2 emissions from power plants in USCA states decrease 58 percent from 2020 to 2040 in the 100% RES scenario compared with 12 percent in the No New Policy scenario.

The study also reveals gaps to be filled beyond eliminating fossil fuel pollution from communities, such as the persistence of gas generation to sell power to neighboring states, reflecting barriers to a fully renewable grid that policy must address. Further, it stresses the importance of policies targeting just and equitable outcomes in the move to renewable energy.

Moving away from fossil fuels in communities most affected by harmful air pollution should be a top priority in comprehensive energy policies. Many communities continue to bear far too large a share of the negative impacts from decades of siting the infrastructure for the nation's fossil fuel power sector in or near marginalized neighborhoods. This pattern will likely persist if the issue is not acknowledged and addressed. State policies should mandate a priority on reducing emissions in communities overburdened by pollution and avoiding investments inconsistent with the need to remove heat-trapping emissions and air pollution at an accelerated rate. And communities must be centrally involved in decisionmaking around any policies and rules that affect them directly, including proposals to change electricity generation, both to retire fossil fuel plants and to build the renewable energy infrastructure.

Key recommendations in On the Road to 100 Percent Renewables address moving away from fossil fuels, increasing investment in renewable energy, and reducing CO2 emissions. They aim to ensure that communities most affected by a history of environmental racism and pollution share in the benefits of the transition: cleaner air, equitable access to good-paying jobs and entrepreneurship alternatives, affordable energy, and the resilience that renewable energy, electrification, energy efficiency, and energy storage can provide. While many communities can benefit from the transition, strong justice and equity policies will avoid perpetuating inequities in the electricity system. State support to historically underserved communities for investing in solar, energy efficiency, energy storage, and electrification will encourage local investment, community wealth-building, and the resilience benefits the transition to renewable energy can provide.

A national clean electricity standard and strong pollution standards should complement state action to drive swift decarbonization and pollution reduction across the United States. Even so, states are well positioned to simultaneously address climate change and decades of inequities in the power system. While it does not substitute for much-needed national and international leadership, strong state action is crucial to achieving an equitable clean energy future.


Related News

View more

Rising Solar and Wind Curtailments in California

California Renewable Energy Curtailment highlights grid congestion, midday solar peaks, limited battery storage, and market constraints, with WEIM participation and demand response programs proposed to balance supply-demand and reduce wasted solar and wind generation.


Key Points

It is the deliberate reduction of solar and wind output when grid limits or low demand prevent full integration.

✅ Grid congestion restricts transmission capacity

✅ Midday solar peaks exceed demand, causing surplus

✅ Storage, WEIM, and demand response mitigate curtailment


California has long been a leader in renewable energy adoption, achieving a near-100% renewable milestone in recent years, particularly in solar and wind power. However, as the state continues to expand its renewable energy capacity, it faces a growing challenge: the curtailment of excess solar and wind energy. Curtailment refers to the deliberate reduction of power output from renewable sources when the supply exceeds demand or when the grid cannot accommodate the additional electricity.

Increasing Curtailment Trends

Recent data from the U.S. Energy Information Administration (EIA) highlights a concerning upward trend in curtailments in California. In 2024, the state curtailed a total of 3,102 gigawatt-hours (GWh) of electricity generated from solar and wind sources, surpassing the 2023 total of 2,660 GWh. This represents a 32.4% increase from the previous year. Specifically, 2,892 GWh were from solar, and 210 GWh were from wind, marking increases of 31.2% and 51.1%, respectively, compared to the first nine months of 2023.

Causes of Increased Curtailment

Several factors contribute to the rising levels of curtailment:

  1. Grid Congestion: California's transmission infrastructure has struggled to keep pace with the rapid growth of renewable energy sources. This congestion limits the ability to transport electricity from generation sites to demand centers, leading to curtailment.

  2. Midday Solar Peaks: Amid California's solar boom, solar energy production typically peaks during the midday when electricity demand is lower. This mismatch between supply and demand results in excess energy that cannot be utilized, necessitating curtailment.

  3. Limited Energy Storage: While battery storage technologies are advancing, California's current storage capacity is insufficient to absorb and store excess renewable energy for later use. This limitation exacerbates curtailment issues.

  4. Regulatory and Market Constraints: Existing market structures and regulatory frameworks may not fully accommodate the rapid influx of renewable energy, leading to inefficiencies and increased curtailment.

Economic and Environmental Implications

Curtailment has significant economic and environmental consequences. For renewable energy producers, curtailed energy represents lost revenue and undermines the economic viability of new projects. Environmentally, curtailment means that clean, renewable energy is wasted, and the grid may rely more heavily on fossil fuels to meet demand, counteracting the benefits of renewable energy adoption.

Mitigation Strategies

To address the rising curtailment levels, California is exploring several strategies aligned with broader decarbonization goals across the U.S.:

  • Grid Modernization: Investing in and upgrading transmission infrastructure to alleviate congestion and improve the integration of renewable energy sources.

  • Energy Storage Expansion: Increasing the deployment of battery storage systems to store excess energy during peak production times and release it during periods of high demand.

  • Market Reforms: Participating in the Western Energy Imbalance Market (WEIM), a real-time energy market that allows for the balancing of supply and demand across a broader region, helping to reduce curtailment.

  • Demand Response Programs: Implementing programs that encourage consumers to adjust their energy usage patterns, such as shifting electricity use to times when renewable energy is abundant.

Looking Ahead

As California continues to expand its renewable energy capacity, addressing curtailment will be crucial to ensuring the effectiveness and sustainability of its energy transition. By investing in grid infrastructure, energy storage, and market reforms, the state can reduce curtailment levels and make better use of its renewable energy resources, while managing challenges like wildfire smoke impacts on solar output. These efforts will not only enhance the economic viability of renewable energy projects but also contribute to California's 100% clean energy targets by maximizing the use of clean energy and reducing reliance on fossil fuels.

While California's renewable energy sector faces challenges related to curtailment, proactive measures and strategic investments can mitigate these issues, as scientists continue to improve solar and wind power through innovation, paving the way for a more sustainable and efficient energy future.


Related News

View more

Opinion: Now is the time for a western Canadian electricity grid

Western Canada Electric Grid could deliver interprovincial transmission, reliability, peak-load support, reserve sharing, and wind and solar integration, lowering costs versus new generation while respecting AESO markets and Crown utility structures.


Key Points

Interprovincial transmission to share reserves, boost reliability, integrate wind and solar, and cut peak capacity costs.

✅ Cuts reserve margins via diversity of peak loads

✅ Enables wind and solar balancing across provinces

✅ Saves ratepayers vs replacing retiring thermal plants


The 2017 Canadian Free Trade Agreement does not do much to encourage provinces to trade electric energy east and west. Would a western Canada electric grid help electricity consumers in the western provinces? Some Alberta officials feel that their electric utilities are investor owned and they perceive the Crown corporations of BC Hydro, SaskPower and Manitoba Hydro to be subsidized by their provincial governments, so an interprovincial electric energy trade would not be on a level playing field.

Because of the limited trade of electric energy between the western provinces, each utility maintains an excessive reserve of thermal and hydroelectric generation greater than their peak loads, to provide a reliable supply during peak load days as grids are increasingly exposed to harsh weather across Canada. This excess does not include variable wind and solar generation, which within a province can’t be guaranteed to be available when needed most.

This attitude must change. Transmission is cheaper than generation, and coordinated macrogrids can further improve reliability and cut costs. By constructing a substantial grid with low profile and aesthetically designed overhead transmission lines, the excess reserve of thermal and hydroelectric generation above the peak electric load can be reduced in each province over time. Detailed assessments will ensure each province retains its required reliability of electric supply.

As the provinces retire aging thermal and coal-fired generators, they only need to replace them to a much lower level, by just enough to meet their future electric loads and Canada's net-zero grid by 2050 goals. Some of the money not spent in replacing retired generation can be profitably invested in the transmission grid across the four western provinces.

But what about Alberta, which does not want to trade electric energy with the other western provinces? It can carry on as usual within the Alberta Electric System Operator’s (AESO) market and will save money by keeping the installed reserve of thermal and hydroelectric generation to a minimum. When Alberta experiences a peak electric load day and some generators are out of service due to unplanned maintenance, it can obtain the needed power from the interprovincial electric grid. None of the other three western provinces will peak at the same time, because of different weather and time zones, so they will have spare capacity to help Alberta over its peak. The peak load in a province only lasts for a few hours, so Alberta will get by with a little help from its friends if needed.

The grid will have no energy flowing on it for this purpose except to assist a province from time to time when it’s unable to meet its peak load. The grid may only carry load five per cent of the time in a year for this purpose. Under such circumstances, the empty grid can then be used for other profitable markets in electric energy. This includes more effective use of variable wind and solar energy, by enabling a province to better balance such intermittent power as well as allowing increased installation of it in every province. This is a challenge for AESO which the grid would substantially ease.

Natural Resources Canada promoted the “Regional Electricity Co-Operative and Strategic Infrastructure” initiative for completion this year and contracted through AESO, alongside an Atlantic grid study to explore regional improvements. This is a first step, but more is needed to achieve the full benefit of a western grid.

In 1970 a study was undertaken to electrically interconnect Britain with France, which was justified based on the ability to reduce reserve generation in both countries. Initially Britain rejected it, but France was partially supportive. In time, a substantial interconnection was built, and being a profitable venture, they are contemplating increasing the grid connections between them.

For the sake of the western consumers of electricity and to keep electricity rates from rising too quickly, as well as allowing productive expansion of wind and solar energy in places like British Columbia's clean energy shift efforts, an electric grid is essential across western Canada.

Dennis Woodford is president of Electranix Corporation in Winnipeg, which studies electric transmission problems, particularly involving renewable energy generators requiring firm connection to the grid.


Related News

View more

Kenya on Course for $5 Billion Nuclear Plant to Power Industry

Kenya Nuclear Power Plant Project advances with environmental impact assessment, selecting Tana River County under a build-operate-transfer model to boost grid capacity, support manufacturing growth, and assess reactor technology for reliable baseload energy.


Key Points

A $5B BOT nuclear facility in Tana River to expand Kenya's grid, aiming to start operations in about seven years.

✅ Environmental impact study published for public review by NEMA

✅ Preferred site: Tana River County near coast; grid integration

✅ BOT concession; reactor tech under evaluation for baseload


Kenya’s nuclear agency submitted impact studies for a $5 billion power plant, and said it’s on course to build and start operating the facility in about seven years, as markets like China's nuclear program continue steady expansion.

The government plans to expand its nuclear-power capacity fourfold by 2035, mirroring policy steps in India to revive the sector, the Nuclear Power and Energy Agency said in a report on the National Environment Management Authority’s website. The document is set for public scrutiny before the environmental watchdog can approve it, aligning with global green industrial strategies that weigh nuclear in decarbonization, and pave the way for the project to continue.

President Uhuru Kenyatta wants to ramp up installed generation capacity from 2,712 megawatts as of April to boost manufacturing in East Africa’s largest economy, noting milestones such as Barakah Unit 1 reaching 100% power as indicators of nuclear readiness. Kenya expects peak demand to top 22,000 megawatts by 2031, and other jurisdictions, such as Ontario's exploration of new nuclear, are weighing similar large-scale options, partly due to industrial expansion, a component in Kenyatta’s Big Four Agenda. The other three are improving farming, health care and housing.

The nuclear agency is assessing technologies “to identify the ideal reactor for the country,” it said in the report, including next-gen nuclear designs now being evaluated.

A site in Tana River County, near the Kenyan coast was preferred after studies across three regions, according to the report. The plant will be developed with a concessionaire under a build, operate and transfer model, with innovators such as mini-reactor concepts informing vendor options.


Related News

View more

UK low-carbon electricity generation stalls in 2019

UK low-carbon electricity 2019 saw stalled growth as renewables rose slightly, wind expanded, nuclear output fell, coal hit record lows, and net-zero targets demand faster deployment to cut CO2 intensity below 100gCO2/kWh.


Key Points

Low-carbon sources supplied 54% of UK power in 2019, up just 1TWh; wind grew, nuclear fell, and coal dropped to 2%.

✅ Wind up 8TWh; nuclear down 9TWh amid outages

✅ Fossil fuels 43% of generation; coal at 2%

✅ Net-zero needs 15TWh per year added to 2030


The amount of electricity generated by low-carbon sources in the UK stalled in 2019, Carbon Brief analysis shows.

Low-carbon electricity output from wind, solar, nuclear, hydro and biomass rose by just 1 terawatt hour (TWh, less than 1%) in 2019. It represents the smallest annual increase in a decade, where annual growth averaged 9TWh. This growth will need to double in the 2020s to meet UK climate targets while replacing old nuclear plants as they retire.

Some 54% of UK electricity generation in 2019 came from low-carbon sources, including 37% from renewables and 20% from wind alone, underscoring wind's leading role in the power mix during key periods. A record-low 43% was from fossil fuels, with 41% from gas and just 2% from coal, also a record low. In 2010, fossil fuels generated 75% of the total.

Carbon Brief’s analysis of UK electricity generation in 2019 is based on figures from BM Reports and the Department for Business, Energy and Industrial Strategy (BEIS). See the methodology at the end for more on how the analysis was conducted.

The numbers differ from those published earlier in January by National Grid, which were for electricity supplied in Great Britain only (England, Wales and Scotland, but excluding Northern Ireland), including via imports from other countries.

Low-carbon low
In 2019, the UK became the first major economy to target net-zero greenhouse gas emissions by 2050, increasing the ambition of its legally binding Climate Change Act.

To date, the country has cut its emissions by around two-fifths since 1990, with almost all of its recent progress coming from the electricity sector.

Emissions from electricity generation have fallen rapidly in the decade since 2010 as coal power has been almost phased out and even gas output has declined. Fossil fuels have been displaced by falling demand and by renewables, such as wind, solar and biomass.

But Carbon Brief’s annual analysis of UK electricity generation shows progress stalled in 2019, with the output from low-carbon sources barely increasing compared to a year earlier.

The chart below shows low-carbon generation in each year since 2010 (grey bars) and the estimated level in 2019 (red). The pale grey bars show the estimated future output of existing low-carbon sources after old nuclear plants retire and the pale red bars show the amount of new generation needed to keep electricity sector emissions to less than 100 grammes of CO2 per kilowatt hour (gCO2/kWh), the UK’s nominal target for the sector.

 Annual electricity generation in the UK by fuel, terawatt hours, 2010-2019. Top panel: fuel by fuel. Bottom panel: cumulative total generation from all sources. Source: BEIS energy trends, BM Reports and Carbon Brief analysis. Chart by Carbon Brief using Highcharts.
As the chart shows, the UK will require significantly more low-carbon electricity over the next decade as part of meeting its legally binding climate goals.

The nominal 100gCO2/kWh target for 2030 was set in the context of the UK’s less ambitious goal of cutting emissions to 80% below 1990 levels by 2050. Now that the country is aiming to cut emissions to net-zero by 2050, that 100gCO2/kWh indicator is likely to be the bare minimum.

Even so, it would require a rapid step up in the pace of low-carbon expansion, compared to the increases seen over the past decade. On average, low-carbon generation has risen by 9TWh each year in the decade since 2010 – including a rise of just 1TWh in 2019.

Given scheduled nuclear retirements and rising demand expected by the Committee on Climate Change (CCC) – with some electrification of transport and heating – low-carbon generation would need to increase by 15TWh each year until 2030, just to meet the benchmark of 100gCO2/kWh.

For context, the 3.2 gigawatt (GW) Hinkley C new nuclear plant being built in Somerset will generate around 25TWh once completed around 2026. The world’s largest offshore windfarm, the 1.2GW Hornsea One scheme off the Yorkshire coast, will generate around 5TWh each year.

The new Conservative government is targeting 40GW of offshore wind by 2030, up from today’s figure of around 8GW. If policies are put in place to meet this goal, then it could keep power sector emissions below 100gCO2/kWh, depending on the actual performance of the windfarms built.

However, new onshore wind and solar, further new nuclear or other low-carbon generation, such as gas with carbon capture and storage (CCS), is likely to be needed if demand is higher than expected, or if the 100gCO2/kWh benchmark is too weak in the context of net-zero by 2050.

The CCC says it is “likely” to “reflect the need for more rapid deployment” of low-carbon towards net-zero emissions in its advice on the sixth UK carbon budget for 2033-2037, due in September.

Trading places
Looking more closely at UK electricity generation in 2019, Carbon Brief’s analysis shows why there was so little growth for low-carbon sources compared to the previous year.

There was another increase for wind power in 2019 (up 8TWh, 14%), with record wind generation as several large new windfarms were completed including the 1.2GW Hornsea One project in October and the 0.6GW Beatrice offshore windfarm in Q2 of 2019. But this was offset by a decline for nuclear (down 9TWh, 14%), due to ongoing outages for reactors at Hunterston in Scotland and Dungeness in Kent.

(Analysis of data held by trade organisation RenewableUK suggests some 0.6GW of onshore wind capacity also started operating in 2019, including the 0.2GW Dorenell scheme in Moray, Scotland.)

As a result of these movements, the UK’s windfarms overtook nuclear for the first time ever in 2019, becoming the country’s second-largest source of electricity generation, and earlier, wind and solar together surpassed nuclear in the UK as momentum built. This is shown in the figure below, with wind (green line, top panel) trading places with nuclear (purple) and gas (dark blue) down around 25% since 2010 but remaining the single-largest source.

 Annual electricity generation in the UK by fuel, terawatt hours, 2010-2019. Top panel: fuel by fuel. Bottom panel: cumulative total generation from all sources. Source: BEIS energy trends, BM Reports and Carbon Brief analysis. Chart by Carbon Brief using Highcharts.
The UK’s currently suspended nuclear plants are due to return to service in January and March, according to operator EDF, the French state-backed utility firm. However, as noted above, most of the UK’s nuclear fleet is set to retire during the 2020s, with only Sizewell B in Suffolk due to still be operating by 2030. Hunterston is scheduled to retire by 2023 and Dungeness by 2028.

Set against these losses, the UK has a pipeline of offshore windfarms, secured via “contracts for difference” with the government, at a series of auctions. The most recent auction, in September 2019, saw prices below £40 per megawatt hour – similar to current wholesale electricity prices.

However, the capacity contracted so far is not sufficient to meet the government’s target of 40GW by 2030, meaning further auctions – or some other policy mechanism – will be required.

Coal zero
As well as the switch between wind and nuclear, 2019 also saw coal fall below solar for the first time across a full year, echoing the 2016 moment when wind outgenerated coal across the UK, after it suffered another 60% reduction in electricity output. Just six coal plants remain in the UK, with Aberthaw B in Wales and Fiddlers Ferry in Cheshire closing in March.

Coal accounted for just 2% of UK generation in 2019, a record-low coal share since centralised electricity supplies started to operate in 1882. The fuel met 40% of UK needs as recently as 2012, but has plummeted thanks to falling demand, rising renewables, cheaper gas and higher CO2 prices.

The reduction in average coal generation hides the fact that the fuel is now often not required at all to meet the UK’s electricity needs. The chart below shows the number of days each year when coal output was zero in 2019 (red line) and the two previous years (blue).

 Cumulative number of days when UK electricity generation from renewable sources has been higher than that from fossil fuels. Source: BEIS energy trends, BM Reports and Carbon Brief analysis. Chart by Carbon Brief using Highcharts.
The 83 days in 2019 with zero coal generation amount to nearly a quarter of the year and include the record-breaking 18-day stretch without the fuel.

Great Britain has been running for a record TWO WEEKS without using coal to generate electricity – the first time this has happened since 1882.

The country’s grid has been coal-free for 45% of hours in 2019 so far.https://www.carbonbrief.org/countdown-to-2025-tracking-the-uk-coal-phase-out …

Coal generation was set for significant reductions around the world in 2019 – including a 20% reduction for the EU as a whole – according to analysis published by Carbon Brief in November.

Notably, overall UK electricity generation fell by another 9TWh in 2019 (3%), bringing the total decline to 58TWh since 2010. This is equivalent to more than twice the output from the Hinkley C scheme being built in Somerset. As Carbon Brief explained last year, falling demand has had a similar impact on electricity-sector CO2 emissions as the increase in output from renewables.

This is illustrated by the fact that the 9TWh reduction in overall generation translated into a 9TWh (6%) cut in fossil-fuel generation during 2019, with coal falling by 10TWh and gas rising marginally.

Increasingly renewable
As fossil-fuel output and overall generation have declined, the UK’s renewable sources of electricity have continued to increase. Their output has risen nearly five-fold in the past decade and their share of the UK total has increased from 7% in 2010 to 37% in 2019.

As a result, the UK’s increasingly renewable grid is seeing more minutes, hours and days during which the likes of wind, solar and biomass collectively outpace all fossil fuels put together, and on some days wind is the main source as well.

The chart below shows the number of days during each year when renewables generated more electricity than fossil fuels in 2019 (red line) and each of the previous four years (blue lines). In total, nearly two-fifths of days in 2019 crossed this threshold.

 Cumulative number of days when the UK has not generated any electricity from coal. Source: BEIS energy trends, BM Reports and Carbon Brief analysis. Chart by Carbon Brief using Highcharts.
There were also four months in 2019 when renewables generated more of the UK’s electricity than fossil fuels: March, August, September and December. The first ever such month came in September 2018 and more are certain to follow.

National Grid, which manages Great Britain’s high-voltage electricity transmission network, is aiming to be able to run the system without fossil fuels by 2025, at least for short periods. At present, it sometimes has to ask windfarm operators to switch off and gas plants to start running in order to keep the electricity grid stable.

Note that biomass accounted for 11% of UK electricity generation in 2019, nearly a third of the total from all renewables. Some two-thirds of the biomass output is from “plant biomass”, primarily wood pellets burnt at Lynemouth in Northumberland and the Drax plant in Yorkshire. The remainder was from an array of smaller sites based on landfill gas, sewage gas or anaerobic digestion.

The CCC says the UK should “move away” from large-scale biomass power plants, once existing subsidy contracts for Drax and Lynemouth expire in 2027.

Using biomass to generate electricity is not zero-carbon and in some circumstances could lead to higher emissions than from fossil fuels. Moreover, there are more valuable uses for the world’s limited supply of biomass feedstock, the CCC says, including carbon sequestration and hard-to-abate sectors with few alternatives.

Methodology
The figures in the article are from Carbon Brief analysis of data from BEIS Energy Trends chapter 5 and chapter 6, as well as from BM Reports. The figures from BM Reports are for electricity supplied to the grid in Great Britain only and are adjusted to include Northern Ireland.

In Carbon Brief’s analysis, the BM Reports numbers are also adjusted to account for electricity used by power plants on site and for generation by plants not connected to the high-voltage national grid. This includes many onshore windfarms, as well as industrial gas combined heat and power plants and those burning landfill gas, waste or sewage gas.

By design, the Carbon Brief analysis is intended to align as closely as possible to the official government figures on electricity generated in the UK, reported in BEIS Energy Trends table 5.1.

Briefly, the raw data for each fuel is in most cases adjusted with a multiplier, derived from the ratio between the reported BEIS numbers and unadjusted figures for previous quarters.

Carbon Brief’s method of analysis has been verified against published BEIS figures using “hindcasting”. This shows the estimates for total electricity generation from fossil fuels or renewables to have been within ±3% of the BEIS number in each quarter since Q4 2017. (Data before then is not sufficient to carry out the Carbon Brief analysis.)

For example, in the second quarter of 2019, a Carbon Brief hindcast estimates gas generation at 33.1TWh, whereas the published BEIS figure was 34.0TWh. Similarly, it produces an estimate of 27.4TWh for renewables, against a BEIS figure of 27.1TWh.

National Grid recently shared its own analysis for electricity in Great Britain during 2019 via its energy dashboard, which differs from Carbon Brief’s figures.


Related News

View more

BC Hydro says province sleeping in, showering less in pandemic

BC Hydro pandemic electricity trends reveal weekend-like energy consumption patterns: later morning demand, earlier evenings, more cooking, streaming on smart TVs, and work-from-home routines, with tips to conserve using laptops and small appliances.


Key Points

Weekend-like shifts in power demand from work-from-home routines: later mornings, earlier evenings, and more streaming.

✅ Later morning electricity demand; earlier evening peaks

✅ More cooking and baking; increased streaming after dinner

✅ Conservation tips: laptops, small appliances, smart TVs


The latest report on electricity usage in British Columbia reveals the COVID-19 pandemic has created an atmosphere where every day feels like a Saturday, a pattern also reflected in BC electricity demand during peak seasons.

BC Hydro says overall power usage hasn't changed much, but similar Ontario electricity demand shifts suggest regional differences, while Manitoba demand fell more noticeably, and a survey of 500 people shows daily routines have shifted dramatically since mid-March when pandemic-related closures began.

The hydro report says, with nearly 40 per cent of B.C. residents working from home, trends in residential electricity use confirm almost half are sleeping in and eating breakfast later, while about a quarter say they are showering less.

Those patterns more closely resemble what hydro says is typical weekend power consumption, and could influence time-of-use rates as electricity demand occurs later in the morning and earlier in the evening.

The report also finds many people are cooking and baking more than before the pandemic, preparing the evening meal earlier, streaming or viewing more television after dinner even as Ottawa's electricity consumption dipped earlier in the pandemic, and 80 per cent are going to bed later.

Although electricity use is normal for this time of year, hydro says homebound residents can conserve by using laptops instead of desktops, small appliances such as Instant Pots instead of ovens, and streaming movies or TV shows on a smart televisions instead of game consoles, even as Hydro One peak rates continue to shape consumption patterns elsewhere.


Related News

View more

Sign Up for Electricity Forum’s Newsletter

Stay informed with our FREE Newsletter — get the latest news, breakthrough technologies, and expert insights, delivered straight to your inbox.

Electricity Today T&D Magazine Subscribe for FREE

Stay informed with the latest T&D policies and technologies.
  • Timely insights from industry experts
  • Practical solutions T&D engineers
  • Free access to every issue

Live Online & In-person Group Training

Advantages To Instructor-Led Training – Instructor-Led Course, Customized Training, Multiple Locations, Economical, CEU Credits, Course Discounts.

Request For Quotation

Whether you would prefer Live Online or In-Person instruction, our electrical training courses can be tailored to meet your company's specific requirements and delivered to your employees in one location or at various locations.