China, Cambodia agree to nuclear energy cooperation


Cambodia has signed a memorandum of understanding with China National Nuclear Corporation (CNNC)

Electrical Testing & Commissioning of Power Systems

Our customized live online or in‑person group training can be delivered to your staff at your location.

  • Live Online
  • 12 hours Instructor-led
  • Group Training Available
Regular Price:
$599
Coupon Price:
$499
Reserve Your Seat Today

Cambodia-CNNC Nuclear Energy MoU advances peaceful nuclear cooperation, human resources development, and Belt and Road ties, targeting energy security and applications in medicine, agriculture, and industry across ASEAN under IAEA-guided frameworks.


Key Points

A pact to expand peaceful nuclear tech and skills, boosting Cambodia's energy, healthcare under ASEAN and Belt and Road.
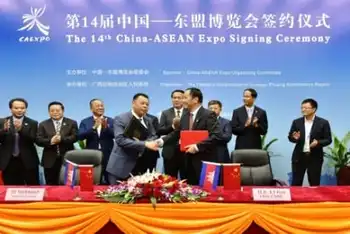
✅ Human resources development and training pipelines

✅ Peaceful nuclear applications in medicine, agriculture, industry

✅ Aligns with IAEA guidance, ASEAN links, Belt and Road goals


Cambodia has signed a memorandum of understanding with China National Nuclear Corporation (CNNC) on cooperation in the peaceful use of nuclear energy. The agreement calls for cooperation on human resources development.

The agreement was signed yesterday by CNNC chief accountant Li Jize and Tekreth Samrach, Cambodia's secretary of state of the Office of the Council of Ministers and vice chairman of the Cambodian Commission on Sustainable Development. It was signed during the 14th China-ASEAN Expo and China-ASEAN Business and Investment Summit, being held in Nanning, the capital of China's Guangxi province.

The signing was witnessed by Cambodia's minister of commerce and other government officials, CNNC said.

"This is another important initiative of China National Nuclear Corporation in implementing the 'One Belt, One Road' strategy as China's nuclear program continues to advance and strengthening cooperation with ASEAN countries in international production capacity, laying a solid foundation for follow-up cooperation between the two countries," CNNC said.

One Belt, One Road is China's project to link trade in about 60 Asian and European countries along a new Silk Road, even as Romania ended talks with a Chinese partner in a separate nuclear project.

CNNC noted that Cambodia's current power supply cannot meet its basic electricity needs, while sectors including medicine, agriculture and industry require a "comprehensive upgrade". It said Cambodia has great market potential for nuclear power and nuclear technology applications.

On 14 August, CNNC vice president Wang Jinfeng met with Tin Ponlok, secretary general of Cambodia's National Council for Sustainable Development, to consult on the draft MOU. Cambodia's Ministry of Environment said these discussions focused on human resources in nuclear power for industrial development and environmental protection.

In late August, CNNC president Qian Zhimin visited Cambodia and met Say Chhum, president of the Senate of Cambodia. Qian noted that CNNC will support Cambodia in applying nuclear technologies in industry, agriculture and medical science, thus developing its economy and improving the welfare of the population. Cambodia can start training workers, promoting new energy exploitation as India's nuclear revival progresses in Asia, and infrastructure construction, and increasing its capabilities in scientific research and industrial manufacturing, he said. This will help the country achieve its long-term goal of the peaceful use of nuclear energy, he added.

In November 2015, Russian state nuclear corporation Rosatom signed a nuclear cooperation agreement with Cambodia, focused on a possible research reactor, but with consideration of nuclear power, while KHNP in Bulgaria illustrates parallel developments in Europe. A further cooperation agreement was signed in March 2016, and in May Rosatom and the National Council for Sustainable Development signed memoranda to establish a nuclear energy information centre in Cambodia and set up a joint working group on the peaceful uses of atomic energy.

In mid-2016, Cambodia's Ministry of Industry, Mines and Energy held discussions with CNNC on building a nuclear power plant and establishing the regulatory and legal infrastructure for that, in collaboration with the International Atomic Energy Agency, mirroring IAEA assistance in Bangladesh on nuclear development.


Related News

Related News

Why Is Georgia Importing So Much Electricity?

Georgia Electricity Imports October 2017 surged as hydropower output fell and thermal power plants underperformed; ESCO balanced demand via low-cost imports, mainly from Azerbaijan, amid rising tariffs, kWh consumption growth, and a widening generation-consumption gap.


Key Points

They mark a record import surge due to costly local generation, lower hydropower, ESCO balancing costs, and rising demand.

✅ Imports rose 832% YoY to 157 mln kWh, mainly from Azerbaijan

✅ TPP output fell despite capacity; only low-tariff plants ran

✅ Balancing price 13.8 tetri/kWh signaled costly domestic PPAs


In October 2017, Georgian power plants generated 828 mln. KWh of electricity, marginally up (+0.79%) compared to September. Following the traditional seasonal pattern and amid European concerns over dispatchable power shortages affecting markets, the share of electricity produced by renewable sources declined to 71% of total generation (87% in September), while thermal power generation’s share increased, accounting for 29% of total generation (compared to 13% in September). When we compare last October’s total generation with the total generation of October 2016, however, we observe an 8.7% decrease in total generation (in October 2016, total generation was 907 mln. kWh). The overall decline in generation with respect to the previous year is due to a simultaneous decline in both thermal power and hydro power generation. 

Consumption of electricity on the local market in the same period was 949 mln. kWh (+7% compared to October 2016, and +3% with respect to September 2017), and reflected global trends such as India's electricity growth in recent years. The gap between consumption and generation increased to 121 mln. kWh (15% of the amount generated in October), up from 100 mln. kWh in September. Even more importantly, the situation was radically different with respect to the prior year, when generation exceeded consumption.

The import figure for October was by far the highest from the last 12 years (since ESCO was established), occurring as Ukraine electricity exports resumed regionally, highlighting wider cross-border dynamics. In October 2017, Georgia imported 157 mln. kWh of electricity (for 5.2 ¢/kWh – 13 tetri/kWh). This constituted an 832% increase compared to October 2016, and is about 50% larger than the second largest import figure (104.2 mln. kWh in October 2014). Most of the October 2017 imports (99.6%) came from Azerbaijan, with the remaining 0.04% coming from Russia.

The main question that comes to mind when observing these statistics is: why did Georgia import so much? One might argue that this is just the result of a bad year for hydropower generation and increased demand. This argument, however, is not fully convincing. While it is true that hydropower generation declined and demand increased, the country’s excess demand could have been easily satisfied by its existing thermal power plants, even as imported coal volumes rose in regional markets. Instead of increasing, however, the electricity coming from thermal power plants declined as well. Therefore, that cannot be the reason, and another must be found. The first that comes to mind is that importing electricity may have been cheaper than buying it from local TPPs, or from other generators selling electricity to ESCO under power purchase agreements (PPAs). We can test the first part of this hypothesis by comparing the average price of imported electricity to the price ceiling on the tariff that TPPs can charge for the electricity they sell. Looking at the trade statistics from Geostat, the average price for imported electricity in October 2017 remained stable with respect to the same month of the previous year, at 5.2 ¢ (13 tetri) per kWh. Only two thermal power plants (Gardabani and Mtkvari) had a price ceiling below 13 tetri per kWh. Observing the electricity balance of Georgia, we see that indeed more than 98% of the electricity generated by TPPs in October 2017 was generated by those two power plants.

What about other potential sources of electricity amid Central Asia's power shortages at the time? To answer this question, we can use the information derived from the weighted average price of balancing electricity. Why balancing electricity? Because it allows us to reconstruct the costs the market operator (ESCO) faced during the month of October to make sure demand and supply were balanced, and it allows us to gain an insight about the price of electricity sold through PPAs.

ESCO reports that the weighted average price of balancing electricity in October 2017 was 13.8 tetri/kWh, (25% higher than in October 2016, when it was below the average weighted cost of imports – 11 vs. 13 – and when the quantity of imported electricity was substantially smaller). Knowing that in October 2017, 61% of balancing electricity came from imports, while 39% came from hydropower and wind power plants selling electricity to ESCO under their PPAs, we can deduce that in this case, internal generation was (on average) also substantially more expensive than imports. Therefore, the high cost of internally generated electricity, rather than the technical impossibility of generating enough electricity to satisfy electricity demand, indeed appears to be one the main reasons why electricity imports spiked in October 2017.


Related News

View more

After rising for 100 years, electricity demand is flat. Utilities are freaking out.

US Electricity Demand Stagnation reflects decoupling from GDP as TVA's IRP revises outlook, with energy efficiency, distributed generation, renewables, and cheap natural gas undercutting coal, reshaping utility business models and accelerating grid modernization.


Key Points

US electricity demand stagnation is flat load growth driven by efficiency, DG, and decoupling from GDP.

✅ Flat sales pressure IOU profits and legacy baseload investments.

✅ Efficiency and rooftop solar reduce load growth and capacity needs.

✅ Utilities must pivot to services, DER orchestration, and grid software.


The US electricity sector is in a period of unprecedented change and turmoil, with emerging utility trends reshaping strategies across the industry today. Renewable energy prices are falling like crazy. Natural gas production continues its extraordinary surge. Coal, the golden child of the current administration, is headed down the tubes.

In all that bedlam, it’s easy to lose sight of an equally important (if less sexy) trend: Demand for electricity is stagnant.

Thanks to a combination of greater energy efficiency, outsourcing of heavy industry, and customers generating their own power on site, demand for utility power has been flat for 10 years, with COVID-19 electricity demand underscoring recent variability and long-run stagnation, and most forecasts expect it to stay that way. The die was cast around 1998, when GDP growth and electricity demand growth became “decoupled”:


This historic shift has wreaked havoc in the utility industry in ways large and small, visible and obscure. Some of that havoc is high-profile and headline-making, as in the recent requests from utilities (and attempts by the Trump administration) to bail out large coal and nuclear plants amid coal and nuclear industry disruptions affecting power markets and reliability.

Some of it, however, is unfolding in more obscure quarters. A great example recently popped up in Tennessee, where one utility is finding its 20-year forecasts rendered archaic almost as soon as they are released.


Falling demand has TVA moving up its planning process

Every five years, the Tennessee Valley Authority (TVA) — the federally owned regional planning agency that, among other things, supplies electricity to Tennessee and parts of surrounding states — develops an Integrated Resource Plan (IRP) meant to assess what it requires to meet customer needs for the next 20 years.

The last IRP, completed in 2015, anticipated that there would be no need for major new investment in baseload (coal, nuclear, and hydro) power plants; it foresaw that energy efficiency and distributed (customer-owned) energy generation would hold down demand.

Even so, TVA underestimated. Just three years later, the Times Free Press reports, “TVA now expects to sell 13 percent less power in 2027 than it did two decades earlier — the first sustained reversal in the growth of electricity usage in the 85-year history of TVA.”

TVA will sell less electricity in 10 years than it did 10 years ago. That is bonkers.

This startling shift in prospects has prompted the company to accelerate its schedule. It will now develop its next IRP a year early, in 2019.

Think for a moment about why a big utility like TVA (serving 9 million customers in seven states, with more than $11 billion in revenue) sets out to plan 20 years ahead. It is investing in extremely large and capital-intensive infrastructure like power plants and transmission lines, which cost billions of dollars and last for decades. These are not decisions to make lightly; the utility wants to be sure that they will still be needed, and will still pay off, for many years to come.

Now think for a moment about what it means for the electricity sector to be changing so fast that TVA’s projections are out of date three years after its last IRP, so much so that it needs to plunge back into the multimillion-dollar, year-long process of developing a new plan.

TVA wanted a plan for 20 years; the plan lasted three.


The utility business model is headed for a reckoning

TVA, as a government-owned, fully regulated utility, has only the goals of “low cost, informed risk, environmental responsibility, reliability, diversity of power and flexibility to meet changing market conditions,” as its planning manager told the Times Free Press. (Yes, that’s already a lot of goals!)

But investor-owned utilities (IOUs), which administer electricity for well over half of Americans, face another imperative: to make money for investors. They can’t make money selling electricity; monopoly regulations forbid it, raising questions about utility revenue models as marginal energy costs fall. Instead, they make money by earning a rate of return on investments in electrical power plants and infrastructure.

The problem is, with demand stagnant, there’s not much need for new hardware. And a drop in investment means a drop in profit. Unable to continue the steady growth that their investors have always counted on, IOUs are treading water, watching as revenues dry up

Utilities have been frantically adjusting to this new normal. The generation utilities that sell into wholesale electricity markets (also under pressure from falling power prices; thanks to natural gas and renewables, wholesale power prices are down 70 percent from 2007) have reacted by cutting costs and merging. The regulated utilities that administer local distribution grids have responded by increasing investments in those grids, including efforts to improve electricity reliability and resilience at lower cost.

But these are temporary, limited responses, not enough to stay in business in the face of long-term decline in demand. Ultimately, deeper reforms will be necessary.

As I have explained at length, the US utility sector was built around the presumption of perpetual growth. Utilities were envisioned as entities that would build the electricity infrastructure to safely and affordably meet ever-rising demand, which was seen as a fixed, external factor, outside utility control.

But demand is no longer rising. What the US needs now are utilities that can manage and accelerate that decline in demand, increasing efficiency as they shift to cleaner generation. The new electricity paradigm is to match flexible, diverse, low-carbon supply with (increasingly controllable) demand, through sophisticated real-time sensing and software.

That’s simply a different model than current utilities are designed for. To adapt, the utility business model must change. Utilities need newly defined responsibilities and new ways to make money, through services rather than new hardware. That kind of reform will require regulators, politicians, and risky experiments. Very few states — New York, California, Massachusetts, a few others — have consciously set off down that path.


Flat or declining demand is going to force the issue

Even if natural gas and renewables weren’t roiling the sector, the end of demand growth would eventually force utility reform.

To be clear: For both economic and environmental reasons, it is good that US power demand has decoupled from GDP growth. As long as we’re getting the energy services we need, we want overall demand to decline. It saves money, reduces pollution, and avoids the need for expensive infrastructure.

But the way we’ve set up utilities, they must fight that trend. Every time they are forced to invest in energy efficiency or make some allowance for distributed generation (and they must always be forced), demand for their product declines, and with it their justification to make new investments.

Only when the utility model fundamentally changes — when utilities begin to see themselves primarily as architects and managers of high-efficiency, low-emissions, multidirectional electricity systems rather than just investors in infrastructure growth — can utilities turn in earnest to the kind planning they need to be doing.

In a climate-aligned world, utilities would view the decoupling of power demand from GDP growth as cause for celebration, a sign of success. They would throw themselves into accelerating the trend.

Instead, utilities find themselves constantly surprised, caught flat-footed again and again by a trend they desperately want to believe is temporary. Unless we can collectively reorient utilities to pursue rather than fear current trends in electricity, they are headed for a grim reckoning.


Related News

View more

Americans Keep Using Less and Less Electricity

U.S. Electricity Demand Decoupling signals GDP growth without higher load, driven by energy efficiency, LED adoption, services-led output, and rising renewables integration with the grid, plus EV charging and battery storage supporting decarbonization.


Key Points

GDP grows as electricity use stays flat, driven by efficiency, renewables, and a shift toward services and output.

✅ LEDs and codes cut residential and commercial load intensity.

✅ Wind, solar, and gas gain share as coal and nuclear struggle.

✅ EVs and storage can grow load and enable grid decarbonization.


By Justin Fox

Economic growth picked up a little in the U.S. in 2017. But electricity use fell, with electricity sales projections continuing to decline, according to data released recently by the Energy Information Administration. It's now been basically flat for more than a decade:


Measured on a per-capita basis, electricity use is in clear decline, and is already back to the levels of the mid-1990s.


Sources: U.S. Energy Information Administration, U.S. Bureau of Economic Analysis

*Includes small-scale solar generation from 2014 onward


I constructed these charts to go all the way back to 1949 in part because I can (that's how far back the EIA data series goes) but also because it makes clear what a momentous change this is. Electricity use rose and rose and rose and then ... it didn't anymore.

Slower economic growth since 2007 has been part of the reason, but the 2017 numbers make clear that higher gross domestic product no longer necessarily requires more electricity, although the Iron Law of Climate is often cited to suggest rising energy use with economic growth. I wrote a column last year about this big shift, and there's not a whole lot new to say about what's causing it: mainly increased energy efficiency (driven to a remarkable extent by the rise of LED light bulbs), and the continuing migration of economic activity away from making tangible things and toward providing services and virtual products such as games and binge-watchable TV series (that are themselves consumed on ever-more-energy-efficient electronic devices).

What's worth going over, though, is what this means for those in the business of generating electricity. The Donald Trump administration has made saving coal-fired electric plants a big priority; the struggles of nuclear power plants have sparked concern from multiple quarters. Meanwhile, U.S. natural gas production has grown by more than 40 percent since 2007, thanks to hydraulic fracturing and other new drilling techniques, while wind and solar generation keep making big gains in cost and market share. And this is all happening within the context of a no-growth electricity market.

In China, a mystery in China's electricity data has complicated global comparisons.


Here are the five main sources of electric power in the U.S.:


The big story over the past decade has been coal and natural gas trading places as the top fuel for electricity generation. Over the past year and a half coal regained some of that lost ground as natural gas prices rose from the lows of early 2016. But with overall electricity use flat and production from wind and solar on the rise, that hasn't translated into big increases in coal generation overall.

Oh, and about solar. It's only a major factor in a few states (California especially), so it doesn't make the top five. But it's definitely on the rise.


What happens next? For power generators, the best bet for breaking out of the current no-growth pattern is to electrify more of the U.S. economy, especially transportation. A big part of the attraction of electric cars and trucks for policy-makers and others is their potential to be emissions-free. But they're only really emissions-free if the electricity used to charge them is generated in an emissions-free manner -- creating a pretty strong business case for continuing "decarbonization" of the electric industry. It's conceivable that electric car batteries could even assist in that decarbonization by storing the intermittent power generated by wind and solar and delivering it back onto the grid when needed.

I don't know exactly how all this will play out. Nobody does. But the business of generating electricity isn't going back to its pre-2008 normal. 


Related News

View more

How Synchrophasors are Bringing the Grid into the 21st Century

Synchrophasors deliver PMU-based, real-time monitoring for the smart grid, helping NYISO prevent blackouts, cut costs, and integrate renewables, with DOE-backed deployments boosting reliability, situational awareness, and data sharing across regional partners.


Key Points

Synchrophasors, or PMUs, are grid sensors that measure synced voltage, current, and frequency to enhance reliability.

✅ Real-time grid visibility and situational awareness

✅ Early fault detection to prevent cascading outages

✅ Supports renewable integration and lowers operating costs


Have you ever heard of a synchrophasor? It may sound like a word out of science fiction, but these mailbox-sized devices are already changing the electrical grid as we know it.

The grid was born over a century ago, at a time when our needs were simpler and our demand much lower. More complex needs are putting a heavy strain on the aging infrastructure, which is why we need to innovate and update our grid with investments in a smarter electricity infrastructure so it’s ready for the demands of today.

That’s where synchrophasors come in.

A synchrophasor is a sophisticated monitoring device that can measure the instantaneous voltage, current and frequency at specific locations on the grid. This gives operators a near-real-time picture of what is happening on the system, including insights into power grid vulnerabilities that allow them to make decisions to prevent power outages.

Just yesterday I attended the dedication of the New York Independent System Operator's smart grid control center, a $75 million project that will use these devices to locate grid problems at an early stage and share these data with their regional partners. This should mean fewer blackouts for the State of New York. I would like to congratulate NYISO for being a technology leader.

And not only will these synchrophasors help prevent outages, but they also save money. By providing more accurate and timely data on system limits, synchrophasors make the grid more reliable and efficient, thereby reducing planning and operations costs and addressing grid modernization affordability concerns for utilities.

The Department has worked with utilities across the country to increase the number of synchrophasors five-fold -- from less than 200 in 2009 to over 1,700 today. And this is just a part of our commitment to making a smarter, more resilient grid a reality, reinforced by grid improvement funding from DOE.

In September 2013, the US Department of Energy announced up to $9 million in funding to facilitate rapid response to unusual grid conditions. As a result, utilities will be able to better detect and head off potential blackouts, while improving day-to-day grid reliability and helping with the integration of solar into the grid and other clean renewable sources.

If you’d like to learn more about our investments in the smart grid and how they are improving our electrical infrastructure, please visit the Office of Electricity Delivery and Energy Reliability’s www.smartgrid.gov.

Patricia Hoffman is Assistant Secretary, Office of Electricity Delivery & Energy Reliability


Related News

View more

PG&E Supports Local Communities as It Pays More Than $230 Million in Property Taxes to 50 California Counties

PG&E property tax payments bolster counties, education, public safety, and infrastructure across Northern and Central California, reflecting semi-annual levies tied to utility assets, capital investments, and economic development that serve 16 million customers.


Key Points

PG&E property tax payments are semi-annual county taxes funding public services and linked to utility infrastructure.

✅ $230M paid for Jul-Dec 2017 across 50 California counties

✅ Estimated $461M for FY 2017-2018, up 12% year over year

✅ Investments: $5.9B in grid, Gas Safety Academy, control center


Pacific Gas and Electric Company (PG&E) paid property taxes of more than $230 million this fall to the 50 counties where the energy company owns property and operates gas and electric infrastructure that serves 16 million Californians. The tax payments help support essential public services like education and public health and safety actions across the region.

The semi-annual property tax payments made today cover the period from July 1 to December 31, 2017.

Total payments for the full tax year of July 1, 2017 to June 30, 2018 are estimated to total more than $461 million—an increase of $50 million, or 12 percent, compared with the prior fiscal year, even as customer rates are expected to stabilize in the years ahead.

“Property tax payments provide crucial resources to the many communities where we live and work, supporting everything from education to public safety. By continuing to make local investments in gas and electric infrastructure, we are not only creating one of the safest and most reliable energy systems in the country, including wildfire risk reduction programs and related efforts, we’re investing in the local economy and helping our communities thrive,” said Jason Wells, senior vice president and chief financial officer for PG&E.

PG&E invested more than $5.7 billion last year and expects to invest $5.9 billion this year to enhance and upgrade its gas and electrical infrastructure amid power line fire risks across Northern and Central California.

Some recent investments include the construction of PG&E’s $75 millionGas Safety Academy in Winters in Yolo County, which opened in September. Last year, PG&E opened a $36 million, state-of-the-art electric distribution control center in Rocklin.

PG&E supports the communities it serves in a variety of ways. In 2016, PG&E provided more than $28 million in charitable contributions to enrich local educational opportunities, preserve the environment, and support economic vitality and emergency preparedness and safety, including its Wildfire Assistance Program for impacted residents. PG&E employees provide thousands of hours of volunteer service in their local communities. The company also offers a broad spectrum of economic development services to help local businesses grow.


Related News

View more

Energy Efficiency and Demand Response Can Nearly Level Southeast Electricity Demand for More than a Decade

Southeast Electricity Demand Forecast examines how energy efficiency, photovoltaics, electric vehicles, heat pumps, and demand response shape grid needs, stabilize load through 2030, shift peaks, and inform utility planning across the region.


Key Points

An outlook of load shaped by efficiency, solar, EVs, with demand response keeping usage steady through 2030.

✅ Stabilizes regional demand through 2030 under accelerated adoption

✅ Energy efficiency and demand response are primary levers

✅ EVs and heat pumps drive growth post 2030; shift winter peaks


Electricity markets in the Southeast are facing many changes on the customer side of the meter. In a new report released today, we look at how energy efficiency, photovoltaics (solar electricity), electric vehicles, heat pumps, and demand response (shifting loads from periods of high demand) might affect electricity needs in the Southeast.

We find that if all of these resources are pursued on an accelerated basis, electricity demand in the region can be stabilized until about 2030.

After that, demand will likely grow in the following decade because of increased market penetration of electric vehicles and heat pumps, but energy planners will have time to deal with this growth if these projections are borne out. We also find that energy efficiency and demand response can be vital for managing electricity supply and demand in the region and that these resources can help contain energy demand growth, reducing the impact of expensive new generation on consumer wallets.


National trends

This is the second ACEEE report looking at regional electricity demand. In 2016, we published a study on electricity consumption in New England, finding an even more pronounced effect. For New England, with even more aggressive pursuit of energy efficiency and these other resources, consumption was projected to decline through about 2030, before rebounding in the following decade.

These regional trends fit into a broader national pattern. In the United States, electricity consumption has been characterized by flat electricity demand for the past decade. Increased energy efficiency efforts have contributed to this lack of consumption growth, even as the US economy has grown since the Great Recession. Recently, the US Energy Information Administration (EIA – a branch of the US Department of Energy) released data on US electricity consumption in 2016, finding that 2016 consumption was 0.3% below 2015 consumption, and other analysts reported a 1% slide in 2023 on milder weather.


Five scenarios for the Southeast

ACEEE’s new study focuses on the Southeast because it is very different from New England, with warmer weather, more economic growth, and less-aggressive energy efficiency and distributed energy policies than the Northeast. For the Southeast, we examined five scenarios: a business-as-usual scenario; two alternative scenarios with progressively higher levels of energy efficiency, photovoltaics informed by a solar strategy for the South that is emerging regionally, electric vehicles, heat pumps, and demand response; and two scenarios combining high numbers of electric vehicles and heat pumps with more modest levels of the other resources. This figure presents electricity demand for each of these scenarios:

Over the 2016-2040 period, we project that average annual growth will range from 0.1% to 1.0%, depending on the scenario, much slower than historic growth in the region. Energy efficiency is generally the biggest contributor to changes in projected 2040 electricity consumption relative to the business-as-usual scenario, as shown in the figure below, which presents our accelerated scenario that is based on levels of energy efficiency and other resources now targeted by leading states and utilities in the Southeast.

To date, Entergy Arkansas has achieved the annual efficiency savings as a percent of sales shown in the accelerated scenario and Progress Energy (a division of Duke Energy) has nearly achieved those savings in both North and South Carolina. Sixteen states outside the Southeast have also achieved these savings statewide.

The efficiency savings shown in the aggressive scenario have been proposed by the Arkansas PSC. This level of savings has already been achieved by Arizona as well as six other states. Likewise, the demand response savings we model have been achieved by more than 10 utilities, including four in the Southeast. The levels of photovoltaic, electric vehicle, and heat pump penetration are more speculative and are subject to significant uncertainty.

We also examined trends in summer and winter peak demand. Most utilities in the Southeast have historically had peak demand in the summer, often seeing heatwave-driven surges that stress operations across the Eastern U.S., but our analysis shows that winter peaks will be more likely in the region as photovoltaics and demand response reduce summer peaks and heat pumps increase winter peaks.


Why it’s vital to plan broadly

Our analysis illustrates the importance of incorporating energy efficiency, demand response, and photovoltaics into utility planning forecasts as utility trends to watch continue to evolve. Failing to include these resources leads to much higher forecasts, resulting in excess utility system investments, unnecessarily increasing customer electricity rates. Our analysis also illustrates the importance of including electric vehicles and heat pumps in long-term forecasts. While these technologies will have moderate impacts over the next 10 years, they could become increasingly important in the long run.

We are entering a dynamic period of substantial uncertainty for long-term electricity sales and system peaks, highlighted by COVID-19 demand shifts that upended typical patterns. We need to carefully observe and analyze developments in energy efficiency, photovoltaics, electric vehicles, heat pumps, and demand response over the next few years. As these technologies advance, we can create policies to reduce energy bills, system costs, and harmful emissions, drawing on grid reliability strategies tested in Texas, while growing the Southeast’s economy. Resource planners should be sure to incorporate these emerging trends and policies into their long-term forecasts and planning.


Related News

View more

Sign Up for Electricity Forum’s Newsletter

Stay informed with our FREE Newsletter — get the latest news, breakthrough technologies, and expert insights, delivered straight to your inbox.

Electricity Today T&D Magazine Subscribe for FREE

Stay informed with the latest T&D policies and technologies.
  • Timely insights from industry experts
  • Practical solutions T&D engineers
  • Free access to every issue

Download the 2025 Electrical Training Catalog

Explore 50+ live, expert-led electrical training courses –

  • Interactive
  • Flexible
  • CEU-cerified