Substation Relay Protection Training
Our customized live online or in‑person group training can be delivered to your staff at your location.

- Live Online
- 12 hours Instructor-led
- Group Training Available
Regular Price:
$699
Coupon Price:
$599
WASHINGTON
—
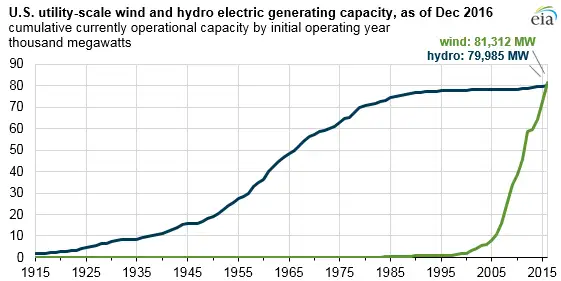
US Wind and Hydropower Capacity surpassed milestones as wind overtook hydro in installed MW, yet hydro generation leads on higher capacity factors, seasonal hydrology, and West Coast precipitation, with ERCOT and SPP setting peaks.
Understanding the Story
It refers to installed MW and seasonal generation shaped by capacity factors, hydrology, and regional grid dynamics.
Wind capacity topped hydro in 2016 by adding 8,727 MW
Hydro likely outgenerated wind in 2017 via higher capacity factors
Hydro offers greater on-peak capacity than wind in SPP and PJM
ERCOT set 16,022 MW wind record, ~47% of mix on Dec 25, 2016
Installed wind electric generating capacity in the United States surpassed conventional hydroelectric generating capacity, long the nation’s largest source of renewable electricity, after 8,727 megawatts (MW) of new wind capacity came online in 2016 amid wind power surges in the U.S. electricity mix. However, given the hydro fleet’s higher average capacity factors and the above-normal precipitation on the West Coast so far this year, hydro generation will likely once again exceed wind generation in 2017.
Wind and hydro generation both follow strong seasonal patterns. Hydro generation typically reaches its seasonal peak in the spring and early summer, especially in the Pacific Northwest and California where about half of U.S. hydropower is produced. Across most of the country, wind generation typically peaks in the spring and has become the most-used renewable source nationally with a smaller peak in late fall and early winter. The Pacific Northwest and California have a slightly different seasonal pattern for wind resources, with generally only one peak in the early summer.
In the Southwest Power Pool (SPP) electric system, which extends from northern Texas to North Dakota and Montana, wind power recently supplied more than half of the system’s generation mix for a brief period, as renewables surpassed coal nationally in 2022, reaching 52.1% (11,419 MW) in the early hours of February 12, 2017—a first for any of the seven U.S. regional transmission organization (RTO) electric systems that together serve two-thirds of the country’s electricity consumption.
The Electric Reliability Council of Texas (ERCOT) system which covers most of Texas continues to set records for the highest level of wind generation on any U.S. electric system as renewables became the second-most prevalent U.S. electricity source in 2020, highlighting broader shifts. ERCOT’s most recent record of 16,022 MW occurred on the morning of December 25, 2016, and accounted for slightly more than 47% of the generation mix at the time
Compared with other electricity generating sources such as nuclear, geothermal, and combined-cycle natural gas, hydro and wind have lower average capacity factors (i.e., generation output as a percentage of total generating capacity). Both sources are sensitive to fluctuations in weather conditions such as droughts, heavy precipitation, and changes in regional wind patterns. Given the hydro fleet's historically higher capacity factors compared with wind and the expected strong hydrological conditions on the West Coast this year, such as the recent heavy rainfall in California and the Pacific Northwest, hydro generation in 2017 will likely still be higher than wind generation even with anticipated continuing additions of new wind capacity throughout the year.
For electricity reliability planning purposes, hydro and wind capacity are reduced (or derated) when estimating their expected contributions to meet projected peak-period electricity demand. Hydro capacity is generally derated to a much lesser degree than wind capacity. The North American Electric Reliability Corporation’s(NERC’s) latest summer reliability assessment shows the difference between the nameplate capacity and the expected on-peak capacity for variable renewable sources (wind, solar, and hydro) in each region, and recent U.S. solar growth underscores changing contributions across markets. In both SPP and the PJM Interconnection electric system, which covers a highly populated area of Mid-Atlantic, Southern, and Midwestern states, hydro provides more expected on-peak capacity than wind even though there is about twice as much installed wind capacity as hydro capacity in both regions.
Related News

Australia electricity market: Plan to avoid threats to electricity supply
National Electricity Market review calls for clear coal-fired closure schedules to safeguard energy security, backing…
View more
Wynne defends 25% hydro rate cut:
Ontario Hydro Rate Cuts address soaring electricity prices, lowering hydro bills via refinancing, FAO-reviewed costs,…
View more

St. Albert touts green goals with three new electric buses
St. Albert electric buses debut as zero-emission, quiet public transit, featuring BYD technology, long-range batteries,…
View more

BOEM receives wind power lease requests
BOEM Offshore Wind Lease Requests advance offshore wind on the Outer Continental Shelf, with PNE…
View more
EPA moves to rewrite limits for coal power plant wastewater
EPA Wastewater Rule Rollback signals a move to rewrite 2015 Clean Water Act guidelines for…
View more

Are solar and wind really killing coal, nuclear and grid reliability?
Renewable Energy Impact on Coal and Nuclear examines how wind, solar, and cheap natural gas…
View more
Sign Up for Electricity Forum’s Newsletter
Stay informed with our FREE Newsletter — get the latest news, breakthrough technologies, and expert insights, delivered straight to your inbox.
Electricity Today T&D Magazine Subscribe for FREE

Stay informed with the latest T&D policies and technologies.
- Timely insights from industry experts
- Practical solutions T&D engineers
- Free access to every issue

