Electric Utility Reliability Metrics and Outage Performance Measurement
By Larry Trussell, PhD EE, Senior Principal Electrical Engineer, Synergi Electric
By Larry Trussell, PhD EE, Senior Principal Electrical Engineer, Synergi Electric

Electric utility reliability metrics measure outage frequency, duration, and restoration performance using SAIDI, SAIFI, CAIDI, and MAIFI, expressed in interruptions and minutes per customer to evaluate system performance and customer impact.
Electric utility reliability metrics quantify how often power outages occur, how long they last, and how quickly service is restored across a distribution system. The core indices SAIFI, SAIDI, CAIDI, and MAIFI are expressed as interruptions and outage minutes per customer, forming the standard basis for evaluating service reliability.
SAIFI represents the average number of sustained interruptions per customer per year, while SAIDI represents the total outage duration in minutes per customer. CAIDI defines the average restoration time per outage, and MAIFI captures short duration interruptions that typically result from transient faults or switching operations. Together, these metrics define how customers actually experience power system performance.
Because these values are derived from recorded outage events, they reflect real system behavior rather than modeled assumptions. Utilities rely on them to track performance trends, identify weak areas, and validate improvements made through operations and planning activities.
Electric utility reliability metrics are standardized indicators used to measure outage frequency, outage duration, and restoration performance across power distribution systems.
SAIFI captures how often outages occur. A value of 1.0 indicates that the average customer experiences one sustained interruption per year. SAIDI captures how long outages last, typically reported in minutes per customer annually. A system reporting 120 minutes of SAIDI indicates an average of two hours of outage time per customer.
CAIDI focuses on restoration performance. It reflects how quickly crews restore service after an outage, rather than how often outages occur. MAIFI adds another dimension by capturing momentary interruptions, which often reveal protection or exposure issues that sustained outage metrics do not show.

Utilities do not interpret these metrics in isolation. When analyzed using systems such as the Outage Management System, outage events, restoration timelines, and customer impact across the network are provided with a structured view.
Electric utility reliability metrics can be calculated across the entire system or at more granular levels such as substations, feeders, and line segments. This distinction changes how the data is interpreted.
System-wide values are useful for benchmarking and reporting, but they compress performance into a single number. A utility may report acceptable SAIDI at the system level while still having feeders with significantly worse performance.
At the feeder level, patterns become visible. Circuits exposed to vegetation, aging infrastructure, or switching complexity often show higher SAIFI or longer restoration times. These localized conditions directly influence how utilities prioritize improvements within broader performance frameworks like Grid reliability.
Each reliability metric describes a different aspect of outage behavior. SAIFI reflects how often interruptions occur. SAIDI reflects how long customers are without power. CAIDI reflects how efficiently service is restored.
A feeder with low SAIFI but high SAIDI indicates that outages are infrequent but difficult to restore. In contrast, a feeder with high SAIFI and low SAIDI suggests repeated interruptions that are resolved quickly, often due to transient faults or automatic switching.
MAIFI helps explain those short events that may not appear in sustained outage data but still affect equipment and customer perception. When viewed together, these metrics provide a more complete understanding of system performance, supporting evaluations aligned with Utility reliability.
Consider a feeder serving 2,000 customers that experiences two sustained outages in one year, totaling 160 minutes of outage time.
This produces a SAIFI of 1.0 and a SAIDI of 160 minutes. The resulting CAIDI is 80 minutes per outage, indicating that restoration is relatively slow compared to typical utility targets.
If the same feeder records 25 momentary interruptions, the MAIFI value reveals a separate issue related to transient faults or switching activity. These combined metrics allow utilities to compare circuits and determine where corrective actions are needed.
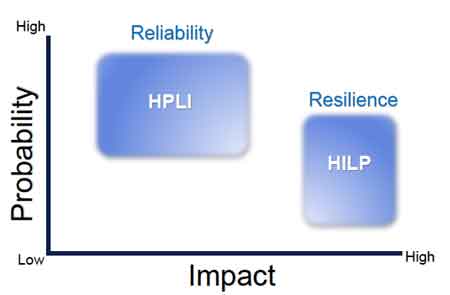
Electric utility reliability metrics are grounded in historical outage data, which means they primarily reflect predictable system behavior. They do not capture the impact of severe storms, wildfires, or large-scale failures.
This limitation is significant. A system can show strong performance in SAIDI and SAIFI while still being highly vulnerable to extreme events. That gap is addressed in analyses focused on Grid resiliency, where recovery and survivability are evaluated.
Another limitation is aggregation. System averages can conceal poor performance in specific areas, especially where infrastructure conditions or environmental exposure vary. Identifying those hidden issues requires moving beyond system-level metrics.
Utilities must balance clarity and detail when using reliability metrics. System-level reporting simplifies communication with regulators and stakeholders but reduces visibility into the underlying causes of outages.
More detailed analysis at the feeder or substation level provides better insight for planning decisions such as reconfiguration, protection changes, or maintenance prioritization. These decisions often interact with broader system strategies, including Power grid resilience, where performance under stress conditions is evaluated.
The tradeoff between simplicity and diagnostic value shapes how reliability data is used across both reporting and engineering functions.
Reliability metrics can be misleading if they are interpreted without context. A reduction in outage frequency may appear to improve performance, but if restoration time increases, overall customer impact may worsen.
Download our FREE Electrical Training Catalog and explore a full range of expert-led electrical training courses.

This creates a situation in which reported metrics improve while actual service quality declines. The issue becomes more complex when reliability performance intersects with external risk factors, such as vegetation exposure or fire conditions, as addressed in Wildfire risk reduction.
Accurate interpretation requires linking metrics to outage causes, system configuration, and environmental conditions rather than viewing them as isolated indicators.
Advantages To Instructor-Led Training – Instructor-Led Course, Customized Training, Multiple Locations, Economical, CEU Credits, Course Discounts.
Request For QuotationWhether you would prefer Live Online or In-Person instruction, our electrical training courses can be tailored to meet your company's specific requirements and delivered to your employees in one location or at various locations.