Assembly passes wind-power bill

By Baltimore Sun


NFPA 70e Training

Our customized live online or in‑person group training can be delivered to your staff at your location.

  • Live Online
  • 6 hours Instructor-led
  • Group Training Available
Regular Price:
$199
Coupon Price:
$149
Reserve Your Seat Today
A bill to reduce environmental reviews required of wind turbine proposals in Maryland has breezed through the General Assembly, a move lauded by industry leaders pushing for renewable forms of energy in the state.

The House of Delegates and Senate passed identical versions of the bill by overwhelming margins. Gov. Martin O'Malley is reviewing the proposed legislation and is inclined to sign it into law, his spokesman, Rick Abbruzzese, said recently.

"I think the governor feels that Maryland has to play a leadership role in alternative energy sources," Abbruzzese said. "We will work to find the appropriate balance between the new sources of energy and their environmental impact."

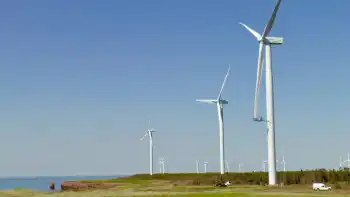
Advocates for wind power believe a less cumbersome permit process could jump-start nascent efforts in Western Maryland to build the state's first gust-driven turbines, which are slated to rise to heights of 400 feet across cleared forest. Four mountaintop projects are in the works but have not gotten off the ground in Allegany and Garrett counties.

"It's an important reform," said Frank Maisano, a spokesman for a coalition of wind-energy developers in the Mid-Atlantic region, including at least two companies with projects in Maryland. "They've just helped us streamline the process a little."

Under current procedure, wind-energy proposals in Maryland must get the same permits from the Public Service Commission that are required of coal-fired power plants. The process is completed with a "certificate of public convenience and necessity."

The commission's review examines the environmental and visual impact of turbine construction. But under the bill, this undertaking would be eliminated, and wind turbines would be freed from the certificate requirement.

Maisano said the bill would not ease the permit process for offshore turbines, an idea that opponents fear could spoil the scenic views and ecosystem of the Chesapeake Bay.

According to advocates, the bill passed by the General Assembly will eliminate duplicate reviews of turbine proposals that had prevented such projects from receiving approval. The House did amend the bill to keep a public hearing requirement for any turbine plan, Maisano said.

Opponents, largely drawn from the state's leading environmental groups, decried the bill's passage, arguing that pollution-free wind turbines will be unsightly and likely harm some of the state's most endangered species.

They added that the public's ability to block or modify plans for 40-story turbines on cleared mountaintops will be severely curtailed by the legislation.

"I think it's one of the worst environmental bills I've ever seen," said Bob DeGroot, president of the Maryland Alliance for Greenway Improvement and Conservation. "It's going to prevent anyone from contesting miles and miles of turbines along mountaintops in Western Maryland."

D. Daniel Boone of Bowie, a former state Department of Natural Resources wildlife manager, said the legislation is a bad idea because "it takes away a citizen's right to be a participant in a meaningful way when it comes to land use that's going to spread across a large area of land."

Other opponents included the Chesapeake Bay Foundation and the Maryland Conservation Council. Supporters of the bill had a prominent friend in wind-energy developer Wayne Rogers, former chairman of the Maryland Democratic Party and chairman of O'Malley's transition committee on energy issues.

Wind-energy promoters said the bill dovetailed with other recent state environmental initiatives, including tax credits and grants for renewable energy. Earlier in the legislative session, the General Assembly passed a measure dubbed the "clean cars bill," which would require stricter tailpipe emissions standards for passenger vehicles sold in the state.

Related News

Learn how fees and usage impacts your electricity bill in new online CER tool

CER Interactive Electricity Bill Tool compares provincial electricity prices, fees, taxes, and usage. Explore household appliance costs, hydroelectric generation, and consumption trends across Canada with interactive calculators and a province-by-province breakdown.


Key Points

An online CER report with calculators comparing electricity prices, fees, and usage to explain household energy costs.

✅ Province-by-province bill, price, and consumption comparison

✅ Calculator for appliance and electronics energy costs

✅ Explains fees, taxes, regulation, and generation sources


Canadians have a new way to assess their electricity bill in a new, interactive online report released by the Canada Energy Regulator (CER).

The report titled What is in a residential electricity bill? features a province-to-province comparison of electricity bills, generation and consumption. It also explains electricity prices across the country, including how Calgary electricity prices have changed, allowing people to understand why costs vary depending on location, fees, regulation and taxes.  

Learn how fees and usage impacts your electricity bill in new online CER tool
Interactive tools allow people to calculate the cost of household appliances and electronic use for each province and territory, and to understand how Ontario rate increases may affect monthly bills. For example, an individual can use the tools to find out that leaving a TV on for 24-hours in Quebec costs $5.25 per month, while that same TV on for a whole day would cost $12.29 per month in Saskatchewan, $20.49 per month in the Northwest Territories, and $15.30 per month in Nova Scotia.

How Canadians use energy varies as much as how provinces and territories produce it, especially in regions like Nunavut where unique conditions influence costs. Millions of Canadians rely on electricity to power their household appliances, charge their electronics, and heat their homes. Provinces with abundant hydro-electric resources like Quebec, B.C., Manitoba, and Newfoundland and Labrador use electricity for home heating and tend to consume the most electricity.

By gathering data from various sources, this report is the first Canadian publication that features interactive tools to allow for a province-by-province comparison of electricity bills while highlighting different elements within an electricity bill, a helpful context as Canada faces a critical supply crunch in the years ahead.

The CER monitors energy markets and assesses Canadian energy requirements and trends, including clean electricity regulations developments that shape pricing. This report is part of a portfolio of publications on energy supply, demand and infrastructure that the CER publishes regularly as part of its ongoing market monitoring.

"No matter where you go in the country, Canadians want to know how much they pay for power and why, especially amid price spikes in Alberta this year," says lead author Colette Craig. "This innovative, interactive report really explains electricity bills to help everyone understand electricity pricing and consumption across Canada."

Quick Facts

  • Quebec ranks first in electricity consumption per capita at 21.0 MW.h, followed by Saskatchewan at 20.0 MW.h, Newfoundland and Labrador at 19.3 MW.h.
  • About 95% of Quebec's electricity is produced from hydroelectricity.
  • Provinces that use electricity for home heating tend to consume the most electricity.
  • Canada's largest consuming sector for electricity was industrial at 238 TW.h. The residential and commercial sectors consumed 168 TW.h and 126 TW.h, respectively.
  • In 2018, Canada produced 647.7 terawatt hours (TW.h) of electricity. More than half of the electricity in Canada (61%) is generated from hydro sources. The remainder is produced from a variety of sources, such as fossil fuels (natural gas and petroleum), nuclear, wind, coal, biomass, solar.
  • Canada is a net exporter of electricity. In 2019, net exports to the U.S. electricity market totaled 47.0 TW.h.
  • The total value of Canada's electricity exports was $2.5 billion Canadian dollars and the value of imports was $0.6 billion Canadian dollars, resulting in 2019 net exports of $1.9 billion.
  • All regions in Canada are reflected in this report but it does not include data that reflects the COVID-19 lockdown and its effects on residential electricity bills.


Related News

View more

Which of the cleaner states imports dirty electricity?

Hourly Electricity Emissions Tracking maps grid balancing areas, embodied emissions, and imports/exports, revealing carbon intensity shifts across PJM, ERCOT, and California ISO, and clarifying renewable energy versus coal impacts on health and climate.


Key Points

An hourly method tracing generation, flows, and embodied emissions to quantify carbon intensity across US balancing areas.

✅ Hourly traces of imports/exports and generation mix

✅ Consumption-based carbon intensity by balancing area

✅ Policy insights for renewables, coal, health costs


In the United States, electricity generation accounts for nearly 30% of our carbon emissions. Some states have responded to that by setting aggressive renewable energy standards; others are hoping to see coal propped up even as its economics get worse. Complicating matters further is the fact that many regional grids are integrated, and as America goes electric the stakes grow, meaning power generated in one location may be exported and used in a different state entirely.

Tracking these electricity exports is critical for understanding how to lower our national carbon emissions. In addition, power from a dirty source like coal has health and environment impacts where it's produced, and the costs of these aren't always paid by the parties using the electricity. Unfortunately, getting reliable figures on how electricity is produced and where it's used is challenging, even for consumers trying to find where their electricity comes from in the first place, leaving some of the best estimates with a time resolution of only a month.

Now, three Stanford researchers—Jacques A. de Chalendar, John Taggart, and Sally M. Benson—have greatly improved on that standard, and they have managed to track power generation and use on an hourly basis. The researchers found that, of the 66 grid balancing areas within the United States, only three have carbon emissions equivalent to our national average, and they have found that imports and exports of electricity have both seasonal and daily changes. de Chalendar et al. discovered that the net results can be substantial, with imported electricity increasing California's emissions/power by 20%.

Hour by hour
To figure out the US energy trading landscape, the researchers obtained 2016 data for grid features called balancing areas. The continental US has 66 of these, providing much better spatial resolution on the data than the larger grid subdivisions. This doesn't cover everything—several balancing areas in Canada and Mexico are tied in to the US grid—and some of these balancing areas are much larger than others. The PJM grid, serving Pennsylvania, New Jersey, and Maryland, for example, is more than twice as large as Texas' ERCOT, in a state that produces and consumes the most electricity in the US.

Despite these limitations, it's possible to get hourly figures on how much electricity was generated, what was used to produce it, and whether it was used locally or exported to another balancing area. Information on the generating sources allowed the researchers to attach an emissions figure to each unit of electricity produced. Coal, for example, produces double the emissions of natural gas, which in turn produces more than an order of magnitude more carbon dioxide than the manufacturing of solar, wind, or hydro facilities. These figures were turned into what the authors call "embodied emissions" that can be traced to where they're eventually used.

Similar figures were also generated for sulfur dioxide and nitrogen oxides. Released by the burning of fossil fuels, these can both influence the global climate and produce local health problems.

Huge variation
The results were striking. "The consumption-based carbon intensity of electricity varies by almost an order of magnitude across the different regions in the US electricity system," the authors conclude. The low is the Bonneville Power grid region, which is largely supplied by hydropower; it has typical emissions below 100kg of carbon dioxide per megawatt-hour. The highest emissions come in the Ohio Valley Electric region, where emissions clear 900kg/MW-hr. Only three regional grids match the overall grid emissions intensity, although that includes the very large PJM (where capacity auction payouts recently fell), ERCOT, and Southern Co balancing areas.

Most of the low-emissions power that's exported comes from the Pacific Northwest's abundant hydropower, while the Rocky Mountains area exports electricity with the highest associated emissions. That leads to some striking asymmetries. Local generation in the hydro-rich Idaho Power Company has embodied emissions of only 71kg/MW-hr, while its imports, coming primarily from Rocky Mountain states, have a carbon content of 625kg/MW-hr.

The reliance on hydropower also makes the asymmetry seasonal. Local generation is highest in the spring as snow melts, but imports become a larger source outside this time of year. As solar and wind can also have pronounced seasonal shifts, similar changes will likely be seen as these become larger contributors to many of these regional grids. Similar things occur daily, as both demand and solar production (and, to a lesser extent, wind) have distinct daily profiles.

The Golden State
California's CISO provides another instructive case. Imports represent less than 30% of its total electric use in 2016, yet California electricity imports provided 40% of its embodied emissions. Some of these, however, come internally from California, provided by the Los Angeles Department of Water and Power. The state itself, however, has only had limited tracking of imported emissions, lumping many of its sources as "other," and has been exporting its energy policies to Western states in ways that shape regional markets.

Overall, the 2016 inventory provides a narrow picture of the US grid, as plenty of trends are rapidly changing our country's emissions profile, including the rise of renewables and the widespread adoption of efficiency measures and other utility trends in 2017 that continue to evolve. The method developed here can, however, allow for annual updates, providing us with a much better picture of trends. That could be quite valuable to track things like how the rapid rise in solar power is altering the daily production of clean power.

More significantly, it provides a basis for more informed policymaking. States that wish to promote low-emissions power can use the information here to either alter the source of their imports or to encourage the sites where they're produced to adopt more renewable power. And those states that are exporting electricity produced primarily through fossil fuels could ensure that the locations where the power is used pay a price that includes the health costs of its production.


Related News

View more

More Polar Vortex 2021 Fallout (and Texas Two-Step): Monitor For ERCOT Identifies Improper Payments For Ancillary Services

ERCOT Ancillary Services Clawback and VOLL Pricing summarize PUCT and IMM actions on load shed, real-time pricing adders, clawbacks, and settlement corrections after the 2021 winter storm in the Texas power grid market.


Key Points

Policies addressing clawbacks for unprovided AS and correcting VOLL-based price adders after load shed ended in ERCOT.

✅ PUCT ordered clawbacks for ancillary services not delivered.

✅ IMM urged price correction after firm load shed ceased.

✅ ERCOT's VOLL adder raised costs by $16B during 32 hours.


Potomac Economics, the Independent Market Monitor (IMM) for the Electric Reliability Council of Texas (ERCOT), filed a report with the Public Utility Commission of Texas (PUCT) that certain payments were made by ERCOT for Ancillary Services (AS) that were not provided, even as ERCOT later issued a winter reliability RFP to procure capacity during subsequent seasons.

According to the IMM (emphasis added):

There were a number of instances during the operating days outlined above in which AS was not provided in real time because of forced outages or derations. For market participants that are not able to meet their AS responsibility, typically the ERCOT operator marks the short amount in the software. This causes the AS responsibility to be effectively removed and the day-ahead AS payment to be clawed back in settlement. However, the ERCOT operators did not complete this task during the winter event, echoing issues like the Ontario IESO phantom demand that cost customers millions, and therefore the "failure to provide" settlements were not invoked in real time.

Removing the operator intervention step and automating the "failure to provide" settlement was contemplated in NPRR947: Clarification to Ancillary Service Supply Responsibility Definition and Improvements to Determining and Charging for Ancillary Service Failed Quantities; however, the NPRR was withdrawn in August 2020 amid ongoing market reform discussions because of the system cost, some complexities related to AS trades, and the implementation of real-time co-optimization.

Invoking the "failure to provide" settlement for all AS that market participants failed to provide during the operating days outlined above will produce market outcomes and settlements consistent with underlying market principles. In this case, the principle is that market participants should not be paid for services that they do not provide, even as a separate ruling found power plants exempt from providing electricity in emergencies under Texas law, underscoring the distinction between obligations and settlements. Whether ERCOT marked the short amount in real-time or not should not affect the settlement of these ancillary services.

On March 3, 2021, the PUCT ordered (a related press release is here) that:

ERCOT shall claw back all payments for ancillary service that were made to an entity that did not provide its required ancillary service during real time on ERCOT operating days starting February 14, 2021 and ending on February 19,2021.

On March 4, 2021, the IMM filed another report and recommended that:

the [PUCT] direct ERCOT to correct the real-time prices from 0:00 February 18,2021, to 09:00 February 19, 2021, to remove the inappropriate pricing intervention that occurred during that time period.

The IMM approvingly noted the PUCT's February 15, 2021 order, which mandated that real-time energy prices reflect firm load shed by setting prices at the value of lost load (VOLL).1

According to the IMM (emphasis added):

This is essential in an energy-only market, like ERCOT's, where the Texas power grid faces recurring crisis risks, because it provides efficient economic signals to increase the electric generation needed to restore the load and service it reliably over the long term.

Conversely, it is equally important that prices not reflect VOLL when the system is not in shortage and load is being served, and experiences in capacity markets show auction payouts can fall sharply under different conditions. The Commission recognized this principle in its Order, expressly stating it is only ERCOT's out-of-market shedding firm load that is required to be reflected in prices. Unfortunately, ERCOT exceeded the mandate of the Commission by continuing to set process at VOLL long after it ceased the firm load shed.

ERCOT recalled the last of the firm load shed instructions at 23:55 on February 17, 2021. Therefore, in order to comply with the Commission Order, the pricing intervention that raised prices to VOLL should have ended immediately at that time. However, ERCOT continued to hold prices at VOLL by inflating the Real-Time On-Line Reliability Deployment Price Adder for an additional 32 hours through the morning of February 19. This decision resulted in $16 billion in additional costs to ERCOT's market, prompting legislative bailout proposals in Austin, of which roughly $1.5 billion was uplifted to load-serving entities to provide make-whole payments to generators for energy that was not needed or produced.

However, at its March 5, 2021, open meeting (related discussion begins around minute 20), although the PUCT acknowledged the "good points" raised by the IMM, the PUCT was not willing to retrospectively adjust its real-time pricing for this period out of concerns that some related transactions (ICE futures and others) may have already settled and for unintended consequences of such retroactive adjustments.  


Related News

View more

Quebec shatters record for electricity consumption once again

Hydro Quebec Power Consumption Record surges amid extreme cold, peak demand, and grid stress, as Hydro-Quebec urges energy conservation, load management, and reduced heating during morning and evening peaks across Montreal and southern Quebec.


Key Points

Quebec's grid hit 40,300 MW during an extreme cold snap, setting a new record and prompting conservation appeals.

✅ Lower thermostats 1-2 C in unused rooms during peak hours

✅ Delay dishwashers, dryers, and hot water use to off-peak

✅ Peak windows: 6-9 a.m. and 4-8 p.m.; import power if needed


Hydro Quebec says it has once again set a new record for power consumption, echoing record-breaking demand in B.C. in 2021 as extreme cold grips much of the province.

An extreme cold warning has been in effect across southern Quebec since Friday morning, straining the system, just as Calgary's electricity use soared during a frigid February, as Quebecers juggle staying warm and working from home.

Hydro Québec recorded consumption levels reaching 40,300 megawatts as of 8 a.m. Friday, breaking a previous record of 39,000 MW (with B.C. electricity demand hit an all-time high during a similar cold snap) that was broken during another cold snap on Jan 11. 

The publicly owned utility is now asking Quebecers to reduce their electricity consumption as much as possible today and tomorrow, a move consistent with clean electricity goals under federal climate pledges, predicting earlier in the morning the province would again reach an all-time high.

Reducing heating by just one or two degrees, especially in rooms that aren't being used, is one step that people can take to limit their consumption. They can also avoid using large appliances like the dishwasher and clothing dryer as often, and shortening the use of hot water. 

"They're small actions, but across millions of clients, it makes a difference," said Cendrix Bouchard, a spokesperson with Hydro Québec, while speaking with Tout un matin.

"We understand that asking this may pose challenges for some who are home throughout the day because they are working remotely, but if people are able to contribute, we appreciate it."

The best time to try and limit electricity usage is in the morning and evening, when electricity usage tends to peak, Bouchard said.

The province can import electricity from other regions if Quebec's system reaches its limits, even as the utility pursues selling to the United States as part of its long-term strategy, he added.

Temperatures dropped to –24 C in Montreal at 7 a.m., with a wind chill of –29 C. 

It will get colder across the south of the province through the evening and wind chills are expected to make it feel as cold as – 40 until Saturday morning, Environment Canada warned.

Those spending time outdoors are at a higher risk of frostbite and hypothermia.

"Frostbite can develop within minutes on exposed skin, especially with wind chill," Environment Canada said.

Conserving energy
Hydro-Québec has signed up 160,000 clients to a flexible billing plan similar to BC Hydro's winter payment plan that allows them to pay less for energy — as long as they use it during non-peak periods.

Quebec's energy regulator, the Régie de l'énergie, also forces crypto-currency mining operations to shut down for some hours  on peak-demand days, a topic where BC Hydro's approach to crypto mining has also drawn attention, Bouchard said.

Hydro-Québec says the highest consumption periods are usually between 6 a.m.-9 a.m. and 4 p.m.-8 p.m.


Related News

View more

Consumer choice has suddenly revolutionized the electricity business in California. But utilities are striking back

California Community Choice Aggregators are reshaping electricity markets with renewable energy, solar and wind sourcing, competitive rates, and customer choice, challenging PG&E, SDG&E, and Southern California Edison while advancing California's clean power goals.


Key Points

Local governments that buy power, often cleaner and cheaper, while utilities handle delivery and billing.

✅ Offer higher renewable mix than utilities at competitive rates

✅ Utilities retain transmission and billing responsibilities

✅ Rapid expansion threatens IOU market share across California


Nearly 2 million electricity customers in California may not know it, but they’re part of a revolution. That many residents and businesses are getting their power not from traditional utilities, but via new government-affiliated entities known as community choice aggregators. The CCAs promise to deliver electricity more from renewable sources, such as solar and wind, even as California exports its energy policies across Western states, and for a lower price than the big utilities charge.

The customers may not be fully aware they’re served by a CCA because they’re still billed by their local utility. But with more than 1.8 million accounts now served by the new system and more being added every month, the changes in the state’s energy system already are massive.

Faced for the first time with real competition, the state’s big three utilities have suddenly become havens of innovation. They’re offering customers flexible options on the portion of their power coming from renewable energy, amid a broader review to revamp electricity rates aimed at cleaning the grid, and they’re on pace to increase the share of power they get from solar and wind power to the point where they are 10 years ahead of their deadline in meeting a state mandate.

#google#

But that may not stem the flight of customers. Some estimates project that by late this year, more than 3 million customers will be served by 20 CCAs, and that over a longer period, Pacific Gas & Electric, Southern California Edison, and San Diego Gas & Electric could lose 80% of their customers to the new providers.

Two big customer bases are currently in play: In Los Angeles and Ventura counties, a recently launched CCA called the Clean Power Alliance is hoping by the end of 2019 to serve nearly 1 million customers. Unincorporated portions of both counties and 29 municipalities have agreed in principle to join up.

Meanwhile, the city of San Diego is weighing two options to meet its goal of 100% clean power by 2035, as exit fees are being revised by the utilities commission: a plan to be submitted by SDG&E, or the creation of a CCA. A vote by the City Council is expected by the end of this year. A city CCA would cover 1.4 million San Diegans, accounting for half SDG&E’s customer demand, according to Cody Hooven, the city’s chief sustainability officer.

Don’t expect the big companies to give up their customers without a fight. Indeed, battle lines already are being drawn at the state Public Utilities Commission, where a recent CPUC ruling sided with a community energy program over SDG&E, and local communities.

“SDG&E is in an all-out campaign to prevent choice from happening, so that they maintain their monopoly,” says Nicole Capretz, who wrote San Diego’s climate action plan as a city employee and now serves as executive director of the Climate Action Campaign, which supports creation of the CCA.

California is one of seven states that have legalized the CCA concept, even as regulators weigh whether the state needs more power plants to ensure reliability. (The others are New York, New Jersey, Massachusetts, Ohio, Illinois and Rhode Island.) But the scale of its experiment is likely to be the largest in the country, because of the state’s size and the ambition of its clean-power goal, which is for 50% of its electricity to be generated from renewable sources by 2030.

California created its system via legislative action in 2002. Assembly Bill 117 enabled municipalities and regional governments to establish CCAs anywhere that municipal power agencies weren’t already operating. Electric customers in the CCA zones were automatically signed up, though they could opt out and stay with their existing power provider. The big utilities would retain responsibility for transmission and distribution lines.

The first CCA, Marin Clean Energy, began operating in 2010 and now serves 470,000 customers in Marin and three nearby counties.

The new entities were destined to come into conflict with the state’s three big investor-owned utilities. Their market share already has fallen to about 70%, from 78% as recently as 2010, and it seems destined to keep falling. In part that’s because the CCAs have so far held their promise: They’ve been delivering relatively clean power and charging less.

The high point of the utilities’ hostility to CCAs was the Proposition 16 campaign in 2009. The ballot measure was dubbed the “Taxpayers Right to Vote Act,” but was transparently an effort to smother CCAs in the cradle. PG&E drafted the measure, got it on the ballot, and contributed all of the $46.5 million spent in the unsuccessful campaign to pass it.

As recently as last year, PG&E and SDG&E were lobbying in the legislature for a bill that would place a moratorium on CCAs. The effort failed, and hasn’t been revived this year.

Rhetoric similar to that used by PG&E against Marin’s venture has surfaced in San Diego, where a local group dubbed “Clear the Air” is fighting the CCA concept by suggesting that it could be financially risky for local taxpayers and questioning whether it will be successful in providing cleaner electricity. Whether Clear the Air is truly independent of SDG&E’s parent, Sempra Energy, is questionable, as at least two of its co-chairs are veteran lobbyists for the company.

SDG&E spokeswoman Helen Gao says the utility supports “customers’ right to choose an energy provider that best meets their needs” and expects to maintain a “cooperative relationship” with any provider chosen by the city.


Related News

View more

Rolls-Royce expecting UK approval for mini nuclear reactor by mid-2024

Rolls-Royce SMR UK Approval underscores nuclear innovation as regulators review a 470 MW factory-built modular reactor, aiming for grid power by 2029 to boost energy security, cut fossil fuels, and accelerate decarbonization.


Key Points

UK regulatory clearance for Rolls-Royce's 470 MW modular reactor, targeting grid power by 2029 to support clean energy.

✅ UK design approval expected by mid 2024

✅ First 470 MW unit aims for grid power by 2029

✅ Modular, factory-built; est. £1.8b per 10-acre site


A Rolls-Royce (RR.L) design for a small modular nuclear reactor (SMR) will likely receive UK regulatory approval by mid-2024, reflecting progress seen in the US NRC safety evaluation for NuScale as a regulatory benchmark, and be able to produce grid power by 2029, Paul Stein, chairman of Rolls-Royce Small Modular Reactors.

The British government asked its nuclear regulator to start the approval process in March, in line with the UK's green industrial revolution agenda, having backed Rolls-Royce’s $546 million funding round in November to develop the country’s first SMR reactor.

Policymakers hope SMRs will help cut dependence on fossil fuels and lower carbon emissions, as projects like Ontario's first SMR move ahead in Canada, showing momentum.

Speaking to Reuters in an interview conducted virtually, Stein said the regulatory “process has been kicked off, amid broader moves such as a Canadian SMR initiative to coordinate development, and will likely be complete in the middle of 2024.

“We are trying to work with the UK Government, and others to get going now placing orders, echoing expansions like Darlington SMR plans in Ontario, so we can get power on grid by 2029.”

In the meantime, Rolls-Royce will start manufacturing parts of the design that are most unlikely to change, while advancing partnerships like a MoU with Exelon to support deployment, Stein added.

Each 470 megawatt (MW) SMR unit costs 1.8 billion pounds ($2.34 billion) and would be built on a 10-acre site, the size of around 10 football fields, though projects in New Brunswick SMR debate have prompted questions about costs and timelines.

Unlike traditional reactors, SMRs are cheaper and quicker to build and can also be deployed on ships and aircraft. Their “modular” format means they can be shipped by container from the factory and installed relatively quickly on any proposed site.


Related News

View more

Sign Up for Electricity Forum’s Newsletter

Stay informed with our FREE Newsletter — get the latest news, breakthrough technologies, and expert insights, delivered straight to your inbox.

Electricity Today T&D Magazine Subscribe for FREE

Stay informed with the latest T&D policies and technologies.
  • Timely insights from industry experts
  • Practical solutions T&D engineers
  • Free access to every issue

Live Online & In-person Group Training

Advantages To Instructor-Led Training – Instructor-Led Course, Customized Training, Multiple Locations, Economical, CEU Credits, Course Discounts.

Request For Quotation

Whether you would prefer Live Online or In-Person instruction, our electrical training courses can be tailored to meet your company's specific requirements and delivered to your employees in one location or at various locations.