CSA Z462 Arc Flash Training – Electrical Safety Compliance Course
Our customized live online or in‑person group training can be delivered to your staff at your location.

- Live Online
- 6 hours Instructor-led
- Group Training Available
Regular Price:
$249
Coupon Price:
$199
WINNIPEG
—
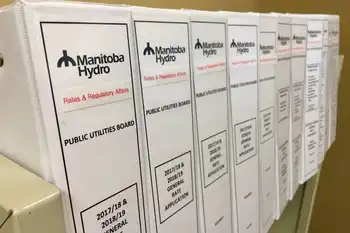
Manitoba Hydro rate hikes face public hearings over electricity rates, utility bills, and debt, with impacts on low-income households, Indigenous communities, and Winnipeg services amid credit rating pressure and rising energy costs.
Breaking Down the Details
Manitoba Hydro seeks 7.9% annual increases to stabilize finances and debt, impacting electricity costs for households.
Proposed hikes: 7.9% yearly through 2023/24
Driven by debt, credit rating declines, rising interest
Disproportionate impact on low-income and Indigenous communities
Hearings began Monday into Manitoba Hydro’s request for consecutive annual rate hikes of 7.9 per cent. The crown corporation is asking for the steep hikes to commence April 1, 2018.
The increases would continue through 2023/2024, under a multi-year rate plan before dropping to what Hydro calls “sustainable” levels.
Patti Ramage, legal counsel for Hydro, said while she understands no one welcomes the “exceptional” rate increases, the company is dealing with exceptional circumstances.
It’s the largest rate increase Hydro has ever asked for, though a scaled-back increase was discussed later, saying rising debt and declining credit ratings are affecting its financial stability.
President and CEO Kelvin Shepherd said Hydro is borrowing money to fund its interest payments, and acknowledged that isn’t an effective business model.
Hydro’s application states that it will be spending up to 63 per cent of its revenue on paying financial expenses if the current request for rate hikes is not approved.
If it does get the increase it wants, that number could shrink to 45 per cent – which Ramage says is still quite high, but preferable to the alternative.
She cited the need to take immediate action to fix Hydro’s finances instead of simply hoping for the best.
“The worst thing we can do is defer action… that’s why we need to get this right,” Ramage said.
A number of intervenors presented varying responses to Hydro’s push for increased rates, with many focusing on how the hikes would affect Manitobans with lower incomes.
Senwung Luk spoke on behalf of the Assembly of Manitoba Chiefs, and said the proposed rates would hit First Nations reserves particularly hard.
He noted that 44.2 per cent of housing on reserves in the province needs significant improvement, which means electricity use tends to be higher to compensate for the lower quality of infrastructure.
Luk says this problem is compounded by the higher rates of poverty in Indigenous populations, with 76 per cent of children on reserves in Manitoba living below the poverty line.
If the increase goes forward, he said the AMC hopes to see a reduced rate for those living on reserves, despite a recent appeal court ruling on such pricing.
Byron Williams, speaking on behalf of the Consumers Coalition, said the 7.9 per cent increase unreasonably favours the interests of Hydro, and is unjustly biased against virtually everyone else.
In Saskatchewan, the NDP criticized an SaskPower 8 per cent rate hike as unfair to customers, highlighting regional concerns.
Williams said customers using electric space heating would be more heavily targeted by the rate increase, facing an extra $13.14 a month as opposed to the $6.88 that would be tacked onto the bills of those not using electric space heating.
Williams also called Hydro’s financial forecasts unreliable, bringing the 7.9 per cent figure into question.
Lawyer George Orle, speaking for the Manitoba Keewatinowi Okimakanak, said the proposed rate hikes would “make a mockery” of the sacrifices made by First Nations across the province, given that so much of Hydro’s infrastructure is on Indigenous land.
The city of Winnipeg also spoke out against the jump, saying property taxes could rise or services could be cut if the hikes go ahead to compensate for increased, unsustainable electricity costs.
In British Columbia, a BC Hydro 3 per cent increase also moved forward, drawing attention to affordability.
A common theme at the hearing was that Hydro’s request was not backed by facts, and that it was heading towards fear-mongering.
Manitoba Hydro’s CEO begged to differ as he plead his case during the first hearing of a process that is expected to take 10 weeks.
Related News
Related News

Yale Report on Western Grid Integration: Just Say Yes
Western Grid Integration aligns CAISO with a regional transmission operator under FERC oversight, boosting renewables,…
View more
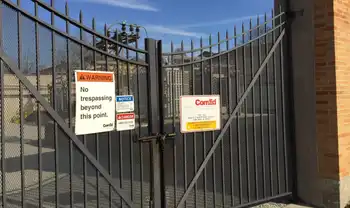
Illinois electric utility publishes online map of potential solar capacity
ComEd Hosting Capacity Map helps Illinois communities assess photovoltaic capacity, distributed energy resources, interconnection limits,…
View more
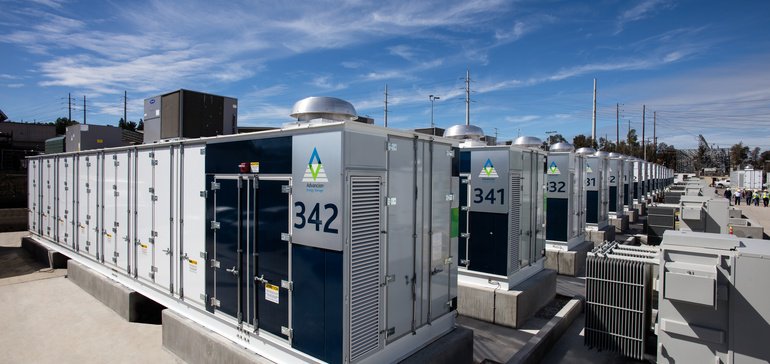
EU ministers warn over China dominance in battery storage, push grid fixes
EU battery storage dependence drives fresh concern as ministers warn over China-linked supply chains, lithium-ion…
View more
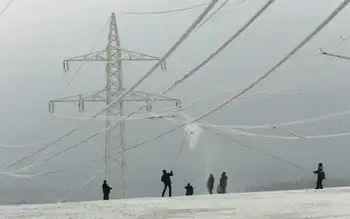
UK Electricity prices hit 10-year high as cheap wind power wanes
UK Electricity Price Surge driven by wholesale gas costs, low wind output, and higher gas-fired…
View more

States Move to Restrict Data Center Growth as Grid and Utility Concerns Mount
A growing number of U.S. states are moving to slow or block new data center…
View more
The Rise of Data Centers in Alberta
Alberta Data Centers fuel the digital economy with cloud computing, AI, and streaming, leveraging renewable…
View more
Sign Up for Electricity Forum’s Newsletter
Stay informed with our FREE Newsletter — get the latest news, breakthrough technologies, and expert insights, delivered straight to your inbox.
Electricity Today T&D Magazine Subscribe for FREE

Stay informed with the latest T&D policies and technologies.
- Timely insights from industry experts
- Practical solutions T&D engineers
- Free access to every issue
