Shift from Fossil Fuels to Renewables signals an energy transition and decarbonization, as investors favor wind and solar over coal, oil, and gas due to falling ROI, policy shifts, and accelerating clean-tech innovation.
Key Points
An economic and policy-driven move redirecting capital from coal, oil, and gas to scalable wind and solar power.
✅ Driven by ROI, risk, and protests curbing fossil fuel projects
✅ Coal declines as wind and solar capacity surges globally
✅ Policy, technology, and markets speed the energy transition
This article is an excerpt from "Changing Tides: An Ecologist's Journey to Make Peace with the Anthropocene" by Alejandro Frid. Reproduced with permission from New Society Publishers. The book releases Oct. 15.
The climate and biodiversity crises reflect the stories that we have allowed to infiltrate the collective psyche of industrial civilization. It is high time to let go of these stories. Unclutter ourselves. Regain clarity. Make room for other stories that can help us reshape our ways of being in the world.
For starters, I’d love to let go of what has been our most venerated and ingrained story since the mid-1700s: that burning more fossil fuels is synonymous with prosperity. Letting go of that story shouldn’t be too hard these days. Financial investment over the past decade has been shifting very quickly away from fossil fuels and towards renewable energies, as Europe's oil majors increasingly pivot to electrification. Even Bob Dudley, group chief executive of BP — one of the largest fossil fuel corporations in the world — acknowledged the trend, writing in the "BP Statistical Review of World Energy 2017": "The relentless drive to improve energy efficiency is causing global energy consumption overall to decelerate. And, of course, the energy mix is shifting towards cleaner, lower carbon fuels, driven by environmental needs and technological advances." Dudley went on:
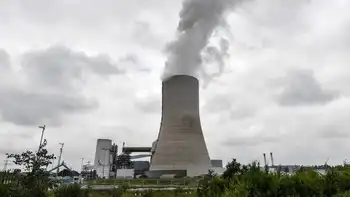
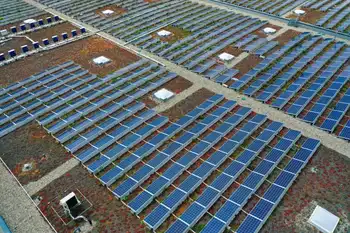
Coal consumption fell sharply for the second consecutive year, with its share within primary energy falling to its lowest level since 2004. Indeed, coal production and consumption in the U.K. completed an entire cycle, falling back to levels last seen almost 200 years ago around the time of the Industrial Revolution, with the U.K. power sector recording its first-ever coal-free day in April of this year. In contrast, renewable energy globally led by wind and solar power grew strongly, helped by continuing technological advances.
According to Dudley’s team, global production of oil and natural gas also slowed down in 2016. Meanwhile, that same year, the combined power provided by wind and solar energy increased by 14.6 percent: the biggest jump on record. All in all, since 2005, the installed capacity for renewable energy has grown exponentially, doubling every 5.5 years, as investment incentives expand to accelerate clean power.
The shift away from fossil fuels and towards renewables has been happening not because investors suddenly became science-literate, ethical beings, but because most investors follow the money, and Trump-era oil policies even reshaped Wall Street’s energy strategies.
It is important to celebrate that King Coal — that grand initiator of the Industrial Revolution and nastiest of fossil fuels — has just begun to lose its power over people and the atmosphere. But it is even more important to understand the underlying causes for these changes. The shift away from fossil fuels and towards renewables has been happening not because the bulk of investors suddenly became science-literate, ethical beings, but because most investors follow the money.
The easy fossil fuels — the kind you used to be able to extract with a large profit margin and relatively low risk of disaster — are essentially gone. Almost all that is left are the dregs: unconventional fossil fuels such as bitumen, or untapped offshore oil reserves in very deep water or otherwise challenging environments, like the Arctic. Sure, the dregs are massive enough to keep tempting investors. There is so much unconventional oil and shale gas left underground that, if we burned it, we would warm the world by 6 degrees or more. But unconventional fossil fuels are very expensive and energy-intensive to extract, refine and market. Additionally, new fossil fuel projects, at least in my part of the world, have become hair triggers for social unrest. For instance, Burnaby Mountain, near my home in British Columbia, where renewable electricity in B.C. is expanding, is the site of a proposed bitumen pipeline expansion where hundreds of people have been arrested since 2015 during multiple acts of civil disobedience against new fossil fuel infrastructure. By triggering legal action and delaying the project, these protests have dented corporate profits. So return on investment for fossil fuels has been dropping.
It is no coincidence that in 2017, Petronas, a huge transnational energy corporation, withdrew their massive proposal to build liquefied natural gas infrastructure on the north coast of British Columbia, as Canada's race to net-zero gathers pace across industry. Petronas backed out not because of climate change or to protect essential rearing habitat for salmon, but to backpedal from a deal that would fail to make them richer.
Shifting investment away from fossil fuels and towards renewable energy, even as fossil-fuel workers signal readiness to support the transition, does not mean we have entirely ditched that tired old story about fossil fuel prosperity.
Neoliberal shifts to favor renewable energies can be completely devoid of concern for climate change. While in office, former Texas Gov. Rick Perry questioned climate science and cheered for the oil industry, yet that did not stop him from directing his state towards an expansion of wind and solar energy, even as President Obama argued that decarbonization is irreversible and anchored in long-term economics. Perry saw money to be made by batting for both teams, and merely did what most neoliberal entrepreneurs would have done.
The right change for the wrong reasons brings no guarantees. Shifting investment away from fossil fuels and towards renewable energy does not mean we have entirely ditched that tired old story about fossil fuel prosperity. Once again, let’s look at Perry. As U.S. secretary of energy under Trump’s presidency, in 2017 he called the global shift from fossil fuels "immoral" and said the United States was "blessed" to provide fossil fuels for the world.
Related News