U.S. adds record amount of wind for 2009

By Reuters


High Voltage Maintenance Training Online

Our customized live online or in‑person group training can be delivered to your staff at your location.

  • Live Online
  • 12 hours Instructor-led
  • Group Training Available
Regular Price:
$599
Coupon Price:
$499
Reserve Your Seat Today
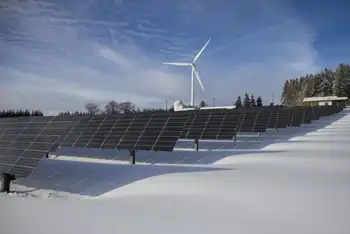
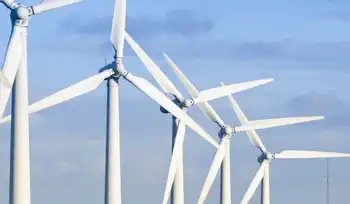
Installations of wind turbine power hit a record in the United States last year despite the financial crisis that choked off funding for half the year, wind power advocates said.

More than 10,000 megawatts of wind power capacity, or 5,700 turbines, were installed in 2009, the American Wind Energy Association said in its annual report, bringing the total capacity in the United States to 35,000 MW.

That kept the United States in the top spot globally for wind power, ahead of China and Germany, which each had about 25.8 MW of capacity. One megawatt is enough power for about 800 U.S. households.

The U.S. wind industry has grown 39 percent on average each of the last five years, and now employs about 85,000 people, many of them in states that have seen other industries close up factories in recent years, AWEA said.

We really are one of the only bright spots out there in terms of growing the manufacturing centers, AWEA Chief Executive Denise Bode told a press conference.

Turbine makers such as Vestas Wind Systems A/S Suzlon laid off employees in the first half of 2009 as orders slowed to a halt, but activity quickly rebounded after the federal government set rules that allowed companies to use U.S. stimulus funds to help support the industry.

It was a critical part of the success in 2009, said Don Furman, senior vice president for development at wind energy company Iberdrola Renewables, the second largest wind owner in the country behind FPL Groups NextEra Energy Resources.

The federal funds were issued through a grant system that replaced a tax credit program, allowing developers who had already built projects to be reimbursed for 30 percent of their construction costs. That helped offset funds that banks pulled out of the market when the credit crisis prompted them to halt lending.

Even with the steady industry growth, wind power generation reached only 1.8 percent of the countrys total, up from 1.3 percent at the end of 2008, AWEA said. Although, AWEA said it would cross the 2 percent threshhold this year.

Leading the nation in installed capacity is Texas, with 9,405 MW, followed by Iowa, with 3,679 MW, and California with 2,723 MW.

Even as fast as the U.S. market was growing, China was catching up quickly, according to Steve Sawyer, secretary general of the Global Wind Energy Council, and the Asian countrys energy appetite made it the largest new wind market in 2009.

Related News

How Alberta’s lithium-laced oil fields can fuel the electric vehicle revolution

Alberta Lithium Brine can power EV batteries via direct lithium extraction, leveraging oilfield infrastructure and critical minerals policy to build a low-carbon supply chain with clean energy, lower emissions, and domestic manufacturing advantages.


Key Points

Alberta lithium brine is subsurface saline water rich in lithium, extracted via DLE to supply EV batteries.

✅ Uses direct lithium extraction from oilfield brines

✅ Leverages Alberta infrastructure and skilled workforce

✅ Supports EV battery supply chain with lower emissions


After a most difficult several months, Canadians are cautiously emerging from their COVID-19 isolation and confronting a struggling economy.
There’s a growing consensus that we need to build back better from COVID-19, and to position for the U.S. auto sector’s pivot to electric vehicles as supply chains evolve. Instead of shoring up the old economy as we did following the 2008 financial crisis, we need to make strategic investments today that will prepare Canada for tomorrow’s economy.

Tomorrow’s energy system will look very different from today’s — and that tomorrow is coming quickly. The assets of today’s energy economy can help build and launch the new industries required for a low-carbon future. And few opportunities are more intriguing than the growing lithium market.

The world needs lithium – and Alberta has plenty

It’s estimated that three billion tonnes of metals will be required to generate clean energy by 2050. One of those key metals – lithium, a light, highly conductive metal – is critical to the construction of battery electric vehicles (BEV). As global automobile manufacturers design hundreds of new BEVs, demand for lithium is expected to triple in the next five years alone, a trend sharpened by pandemic-related supply risks for automakers.

Most lithium today originates from either hard rock or salt flats in Australia and South America. Alberta’s oil fields hold abundant deposits of lithium in subsurface brine, but so far it’s been overlooked as industrial waste. With new processing technologies and growing concerns about the security of global supplies, this is set to change. In January, Canada and the U.S. finalized a Joint Action Plan on Critical Minerals to ensure supply security for critical minerals such as lithium and to promote supply chains closer to home, aligning with U.S. efforts to secure EV metals among allies worldwide.

This presents a major opportunity for Canada and Alberta. Lithium brine will be produced much like the oil that came before it. This lithium originates from many of the same reservoirs responsible for driving both Alberta’s economy and the broader transportation fuel sector for decades. The province now has extensive geological data and abundant infrastructure, including roads, power lines, rail and well sites. Most importantly, Alberta has a highly trained workforce. With very little retooling, the province could deliver significant volumes of newly strategic lithium.

Specialized technologies known as direct lithium extraction, or DLE, are being developed to unlock lithium-brine resources like those in Canada. In Alberta, E3 Metals* has formed a development partnership with U.S. lithium heavyweight Livent Corporation to advance and pilot its DLE technology. Prairie Lithium and LiEP Energy formed a joint venture to pilot lithium extraction in Saskatchewan. And Vancouver’s Standard Lithium is already piloting its own DLE process in southern Arkansas, where the geology is very similar to Alberta and Saskatchewan.

Heavy on quality, light on emissions

All lithium produced today has a carbon footprint, most of which can be tied back to energy-intensive processing. The purity of lithium is essential to battery safety and performance, but this comes at a cost when lithium is mined with trucks and shovels and then refined in coal-heavy China.

As automakers look to source more sustainable raw materials, battery recycling will complement responsible extraction, and Alberta’s experience with green technologies such as renewable electricity and carbon capture and storage can make it one of the world’s largest suppliers of zero-carbon lithium.

Beyond raw materials

The rewards would be considerable. E3 Metals’ Alberta project alone could generate annual revenues of US$1.8 billion by 2030, based on projected production and price forecasts. This would create thousands of direct jobs, as initiatives like a lithium-battery workforce initiative expand training, and many more indirectly.

To truly grow this industry, however, Canada needs to move beyond its comfort zone. Rather than produce lithium as yet another raw-commodity export, Canadians should be manufacturing end products, such as batteries, for the electrified economy, with recent EV assembly deals underscoring Canada’s momentum. With nickel and cobalt refining, graphite resources and abundant petrochemical infrastructure already in place, Canada must aim for a larger piece of the supply chain.

By 2030, the global battery market is expected to be worth $116 billion annually. The timing is right to invest in a strategic commodity and grow our manufacturing sector. This is why the Alberta-based Energy Futures Lab has called lithium one of the ‘Five big ideas for Alberta’s economic recovery.’  The assets of today’s energy economy can be used to help build and launch new resource industries like lithium, required for the low-carbon energy system of the future.

Industry needs support

To do this, however, governments will have to step up the way they did a generation ago. In 1975, the Alberta government kick-started oil-sands development by funding the Alberta Oil Sands Technology and Research Authority. AOSTRA developed a technology called SAGD (steam-assisted gravity drainage) that now accounts for 80% of Alberta’s in situ oil-sands production.

Canada’s lithium industry needs similar support. Despite the compelling long-term economics of lithium, some industry investors need help to balance the risks of pioneering such a new industry in Canada. The U.S. government has recognized a similar need, with the Department of Energy’s recent US$30 million earmarked for innovation in critical minerals processing and the California Energy Commission’s recent grants of US$7.8 million for geothermal-related lithium extraction.

To accelerate lithium development in Canada, this kind of leadership is needed. Government-assisted financing could help early-stage lithium-extraction technologies kick-start a whole new industry.

Aspiring lithium producers are also looking for government’s help to repurpose inactive oil and gas wells. The federal government has earmarked $1 billion for cleaning up inactive Alberta oil wells. Allocating a small percentage of that total for repurposing wells could help transform environmental liabilities into valuable clean-energy assets.

The North American lithium-battery supply chain will soon be looking for local sources of supply, and there is room for Canada-U.S. collaboration as companies turn to electric cars, strengthening regional resilience.


Related News

View more

Starved of electricity, Lebanon picks Dubai's ENOC to swap Iraqi fuel

Lebanon-ENOC Fuel Swap secures Iraqi high sulphur fuel oil, Grade B fuel oil, and gasoil via tender, easing electricity generation shortfalls, diesel shortages, and grid outages amid Lebanon's energy crisis and power sector emergency.


Key Points

A tender-based exchange trading Iraqi HSFO for cleaner fuel oil and gasoil to stabilize Lebanon's electricity generation.

✅ Swaps 84,000t Iraqi HSFO for 30,000t Grade B fuel oil and 33,000t gasoil

✅ Supports state electricity generation during acute power shortages

✅ Tender won by ENOC under Lebanon-Iraq goods-for-fuel deal


Lebanon's energy ministry said it had picked Dubai's ENOC in a tender to swap 84,000 tonnes of Iraqi high sulphur fuel oil, as LNG export authorizations expand globally, with 30,000 tonnes of Grade B fuel oil and 33,000 tonnes of gasoil.

ENOC won the tender, part of a deal between the two countries that allows the cash-strapped Lebanese government, even as electricity tensions persist, to pay for 1 million tonnes of Iraqi heavy fuel oil a year in goods and services.

As Lebanon suffers what the World Bank has described as one of the deepest depressions of modern history, shortages of fuel this month have meant state-powered electricity, alongside ongoing electricity sector reform, has been available for barely a few hours a day if at all.

Residents turning to private generators for their power supply face diesel shortages, even as other countries roll out measures to secure electricity supplies to mitigate risks.

The swap tenders are essential as Iraqi fuel is unsuitable for Lebanese electricity generation, and regional projects like the Jordan-Saudi electricity linkage underscore broader grid strategies.

Lebanese caretaker Energy Minister Raymond Ghajar said in July the fuel from the Iraqi deal would be used for electricity generation by the state provider, even as France advances a new electricity pricing scheme in Europe, and was enough for around four months.

ENOC is set to receive the Iraq fuel between Sept. 3-5 and will deliver it to Lebanon two weeks after, the energy ministry said, following a recent deal on electricity prices abroad that could influence markets.


Related News

View more

B.C. Diverting Critical Minerals, Energy from U.S

Canadian Softwood Lumber Tariffs challenge British Columbia's forestry sector, strain U.S.-Canada trade, and risk redirecting critical minerals and energy resources, threatening North American supply chains, manufacturing, and energy security across integrated markets.


Key Points

Duties imposed by the U.S. on Canadian lumber, affecting BC forestry, trade flows, and North American energy security.

✅ U.S. duties strain BC forestry and cross-border supply chains

✅ Risks redirecting critical minerals and energy exports

✅ Tariff rollback could bolster North American energy security


British Columbia Premier David Eby has raised concerns that U.S. tariffs on Canadian softwood lumber are prompting the province to redirect its critical minerals and energy resources, while B.C. challenges Alberta's electricity export restrictions domestically, away from the United States. In a recent interview, Eby emphasized the broader implications of these tariffs, suggesting they could undermine North American energy security and put electricity exports at risk across the border.

Since 2017, the U.S. Department of Commerce has imposed tariffs on Canadian softwood lumber imports, alleging that Canadian producers benefit from unfair subsidies. These duties have been a persistent source of tension between the two nations, coinciding with Canadian support for energy and mineral tariffs and significantly impacting British Columbia's forestry sector—a cornerstone of the province's economy.

Premier Eby highlighted that the financial strain imposed by these tariffs not only jeopardizes the Canadian forestry industry but also has unintended repercussions for the United States. He pointed out that the economic challenges faced by Canadian producers might lead them to seek alternative markets for their critical minerals and energy resources, as tariff threats boost support for Canadian energy projects domestically, thereby reducing the supply to the U.S. British Columbia is endowed with an abundance of critical minerals essential for various industries, including technology and defense.

The potential redirection of these resources could have significant consequences for American industries that depend on a stable and affordable supply of critical minerals and energy. Eby suggested that the tariffs might incentivize Canadian producers to explore other international markets, even as experts advise against cutting Quebec's energy exports amid the tariff dispute, diminishing the availability of these vital resources to the U.S.

In light of these concerns, Premier Eby has advocated for a reassessment of the tariffs, urging a more cooperative approach between Canada and the United States. He contends that eliminating the tariffs would be mutually beneficial, aligning with views that Biden is better for Canada's energy sector and cross-border collaboration, ensuring a consistent supply of critical resources and fostering economic growth in both countries.

The issue of U.S. tariffs on Canadian softwood lumber remains complex and contentious, with far-reaching implications for trade relations and resource distribution between the two nations. As discussions continue, stakeholders on both sides of the border are closely monitoring the situation, noting that Ford has threatened to cut U.S. electricity exports amid trade tensions, recognizing the importance of collaboration in addressing shared economic and security challenges.


Related News

View more

Solar Becomes #3 Renewable Electricity Source In USA

U.S. Solar Generation 2017 surpassed biomass, delivering 77 million MWh versus 64 million MWh, trailing only hydro and wind; driven by PV expansion, capacity additions, and utility-scale and small-scale growth, per EIA.


Key Points

It was the year U.S. solar electricity exceeded biomass, hitting 77 million MWh and trailing only hydro and wind.

✅ Solar: 77 million MWh; Biomass: 64 million MWh (2017, EIA)

✅ PV expansion; late-year capacity additions dampen annual generation

✅ Hydro: 300 and wind: 254 million MWh; solar thermal ~3 million MWh


Electricity generation from solar resources in the United States reached 77 million megawatthours (MWh) in 2017, surpassing for the first time annual generation from biomass resources, which generated 64 million MWh in 2017. Among renewable sources, only hydro and wind generated more electricity in 2017, at 300 million MWh and 254 million MWh, respectively. Biomass generating capacity has remained relatively unchanged in recent years, while solar generating capacity has consistently grown.

Annual growth in solar generation often lags annual capacity additions because generating capacity tends to be added late in the year. For example, in 2016, 29% of total utility-scale solar generating capacity additions occurred in December, leaving few days for an installed project to contribute to total annual generation despite being counted in annual generating capacity additions. In 2017, December solar additions accounted for 21% of the annual total. Overall, solar technologies operate at lower annual capacity factors and experience more seasonal variation than biomass technologies.

Biomass electricity generation comes from multiple fuel sources, such as wood solids (68% of total biomass electricity generation in 2017), landfill gas (17%), municipal solid waste (11%), and other biogenic and nonbiogenic materials (4%).These shares of biomass generation have remained relatively constant in recent years, even as renewables' rise in 2020 across the grid.

Solar can be divided into three types: solar thermal, which converts sunlight to steam to produce power; large-scale solar photovoltaic (PV), which uses PV cells to directly produce electricity from sunlight; and small-scale solar, which are PV installations of 1 megawatt or smaller. Generation from solar thermal sources has remained relatively flat in recent years, at about 3 million MWh, even as renewables surpassed coal in 2022 nationwide. The most recent addition of solar thermal capacity was the Crescent Dunes Solar Energy plant installed in Nevada in 2015, and currently no solar thermal generators are under construction in the United States.

Solar photovoltaic systems, however, have consistently grown in recent years, as indicated by 2022 U.S. solar growth metrics across the sector. In 2014, large-scale solar PV systems generated 15 million MWh, and small-scale PV systems generated 11 million MWh. By 2017, annual electricity from those sources had increased to 50 million MWh and 24 million MWh, respectively, with projections that solar could reach 20% by 2050 in the U.S. mix. By the end of 2018, EIA expects an additional 5,067 MW of large-scale PV to come online, according to EIA’s Preliminary Monthly Electric Generator Inventory, with solar and storage momentum expected to accelerate. Information about planned small-scale PV systems (one megawatt and below) is not collected in that survey.


Related News

View more

Why Is Central Asia Suffering From Severe Electricity Shortages?

Central Asia power shortages strain grids across Kazakhstan, Uzbekistan, Kyrgyzstan, Tajikistan, and Turkmenistan, driven by drought-hit hydropower, aging coal and gas plants, rising demand, cryptomining loads, and winter peak consumption risks.


Key Points

Regionwide blackouts from drought, aging plants and grids, rising demand, and winter peaks stressing Central Asia.

✅ Drought slashes hydropower in Kyrgyzstan, Tajikistan, Uzbekistan

✅ Aging coal and gas TPPs and weak grids cause frequent outages

✅ Cryptomining loads and winter heating spike demand and stress supply


Central Asians from western Kazakhstan to southern Tajikistan are suffering from power and energy shortages that have caused hardship and emergency situations affecting the lives of millions of people.

On October 14, several units at three power plants in northeastern Kazakhstan were shut down in an emergency that resulted in a loss of more than 1,000 megawatts (MW) of electricity.

It serves as an example of the kind of power failures that plague the region 30 years after the Central Asian countries gained independence and despite hundreds of millions of dollars being invested in energy infrastructure and power grids, and echo risks seen in other advanced markets such as Japan's near-blackouts during recent cold snaps.

Some of the reasons for these problems are clear, but with all the money these countries have allocated to their energy sectors and financial help they have received from international financial institutions, it is curious the situation is already so desperate with winter officially still weeks away.


The Current Problems
Three power plants were affected in the October 14 shutdowns of units: Ekibastuz-1, Ekibastuz-2, and the Aksu power plant.

Ekibastuz-1 is the largest power plant in Kazakhstan, capable of generating some 4,000 MW, roughly 13 percent of Kazakhstan’s total power output.

The Kazakhstan Electricity Grid Operating Company (KEGOC) explained the problems resulted partially from malfunctions and repair work, but also from overuse of the system that the government would later say was due to cryptominers, a large number of whom have moved to Kazakhstan recently from China after Beijing banned the mining needed by Bitcoin and other cryptocurrencies, amid its own China's power cuts across several provinces in 2021.

But between November 8 and 9, rolling blackouts were reported in the East Kazakhstan, North Kazakhstan, and Kyzylorda provinces, as well as the area around Almaty, Kazakhstan’s biggest city, and Shymkent, its third largest city.

People in Uzbekistan say they, too, are facing blackouts that the Energy Ministry described as “short-term outages,” even as authorities have looked to export electricity to Afghanistan to support regional demand, though it has been clear for several weeks that the country will have problems with natural gas supplies this winter.


Power lines in Uzbekistan
Kyrgyz President Sadyr Japarov continues to say there won't be any power rationing in Kyrgyzstan this winter, but at the end of September the National Energy Holding Company ordered “restrictions on the lighting of secondary streets, advertisements, and facades of shops, cafes, and other nonresidential customers.”

Many parts of Tajikistan are already experiencing intermittent supplies of electricity.

Even in Turkmenistan, a country with the fourth-largest reserves of natural gas in the world, there were reports of problems with electricity and heating in the capital, Ashgabat.


What Is Going On?
The causes of some of these problems are easy to see.

The population of the region has grown significantly, with the population of Central Asia when the Soviet Union collapsed in late 1991 being some 50 million and today about 75 million.

Kyrgyzstan and Tajikistan are mountainous countries that have long been touted for their hydropower potential and some 90 percent of Kyrgyzstan’s domestically produced electricity and 98 percent of Tajikistan’s come from hydropower.

But a severe drought that struck Central Asia this year has resulted in less hydropower and, in general, less energy for the region, similar to constraints seen in Europe's reduced hydro and nuclear output this year.

Tajik authorities have not reported how low the water in the country’s key reservoirs is, but Kyrgyzstan has reported the water level in the reservoir at its Toktogul hydropower plant (HPP) is 11.8 billion cubic meters (bcm), the lowest level in years and far less than the 14.7 bcm of water it had in November 2020.

The Toktogul HPP, with an installed capacity of 1,200 MW, provides some 40 percent of the country's domestically produced electricity, but operating the HPP this winter to generate desperately needed energy brings the risk of leaving water levels at the reservoir critically low next spring and summer when the water is also needed for agricultural purposes.

This year’s drought is something Kyrgyzstan and Tajikistan will have to take into consideration as they plan how to provide power for their growing populations in the future. Hydropower is a desirable option but may be less reliable with the onset of climate change, prompting interest in alternatives such as Ukraine's wind power to diversify generation.

Uzbekistan is also feeling the effects of this year’s drought, and, like the South Caucasus where Georgia's electricity imports have increased, supply shortfalls are testing grids.

According to the International Energy Agency, HPPs account for some 12 percent of Uzbekistan’s generating capacity.

Uzbekistan’s Energy Ministry attributed low water levels at HPPs that have caused a 23 percent decrease in hydropower generation this year.


A reservoir in Kyrgyzstan
Kazakhstan and Uzbekistan are the most populous Central Asian countries, and both depend on thermal power plants (TPP) for generating most of their electricity.

Most of the TPPs in Kazakhstan are coal-fired, while most of the TPPs in Uzbekistan are gas-fired.

Kazakhstan has 68 power plants, 80 percent of which are coal-fired TPPs, and most are in the northern part of the country where the largest deposits of coal are located. Kazakhstan has the world's 10th largest reserves of coal.

About 88 percent of Uzbekistan’s electricity comes from TTPs, most of which use natural gas.

Uzbekistan’s proven reserves are some 800 billion cubic meters, but gas production in Uzbekistan has been decreasing.

In December 2020, Uzbek President Shavkat Mirziyoev ordered a halt to the country’s gas exports and instructed that gas to be redirected for domestic use. Mirziyoev has already given similar instructions for this coming winter.


How Did It Come To This?
The biggest problem with the energy infrastructure in Central Asia is that it is generally very old. Nearly all of its power plants date back to the Soviet era -- and some well back into the Soviet period.

The use of power plants and transmission lines that some describe as “obsolete” and a few call “decrepit” has unfortunately been a necessity in Central Asia, even as regional players pursue new interconnections like Iran's plan to transmit electricity to Europe as a power hub.

Reporting on Kazakhstan in September 2016, the Asian Development Bank (ADB) said, “70 percent of the power generation infrastructure is in need of rehabilitation.”

The Ekibastuz-1 TPP is relatively new by the power-plant standards of Central Asia. The first unit of the eight units of the TPP was commissioned in 1980.

The first unit at the AKSU TPP was commissioned in 1968, and the first unit of the gas- and fuel-fired TPP in southern Kazakhstan’s Zhambyl Province was commissioned in 1967.


Related News

View more

Parsing Ontario's electricity cost allocation

Ontario Global Adjustment and ICI balance hydro rates, renewable cost shift, and peak demand. Class A and Class B customers face demand response decisions amid pandemic occupancy uncertainty and volatile GA charges through 2022.


Key Points

A pricing model where GA costs and ICI peak allocation shape Class A/B bills, driven by renewables cost shifts.

✅ Renewable cost shift trims GA; larger Class A savings expected.

✅ Class A peak strategy returns; occupancy uncertainty persists.

✅ Class B faces volatile GA; limited levers beyond efficiency.


Ontario’s large commercial electricity customers can approach the looming annual decision about their billing structure for the 12 months beginning July 1 with the assurance of long-term relief on a portion of their costs, amid changes coming for electricity consumers that could affect planning. That’s to be weighed against uncertainties around energy demand and whether a locked-in cost allocation formula that looked favourable in pre-pandemic times will remain so until June 30, 2022.

“The biggest unknown is we just don’t know when the people are coming back,” Jon Douglas, director of sustainability with Menkes Property Management Services, reflected during a webinar sponsored by the Building Owners and Managers Association (BOMA) of Greater Toronto last week. “The occupancy in our office buildings this fall, and going into the new year, could really impact the outcome of the decision.”

After a year of operational upheaval and more modifications to provincial electricity pricing policies, BOMA Toronto’s regularly scheduled workshop ahead of the June 15 deadline for eligible customers to opt into the Industrial Conservation Initiative (ICI) program had a lot of ground to cover. Notably, beginning in January, all commercial customers have seen a reduction in the global adjustment (GA) component of their monthly hydro bills after the Ontario government shifted costs associated with contracted non-hydroelectric renewable supply to reduce the burden on industrial ratepayers from electricity rates to the general provincial account — a move that trims approximately $258 million per month from the total GA charged to industrial and commercial customers. However, they won’t garner the full benefit of that until 2022 since they’re currently repaying about $333 million in GA costs that were deferred in April, May and June of 2020.

Renewable cost shift pares the global adjustment
For now, Ontario government officials estimate the renewable cost shift equates to a 12 per cent discount relative to 2020 prices, even as typical bills may rise about 2% as fixed pricing ends in some cases. Once last year’s GA deferral is repaid at the end of 2021, they project the average Class A customer participating in the ICI program should realize a 16 per cent saving on the total hydro bill, while Class B customers paying the GA on a volumetric per kilowatt-hour (kWh) basis will see a slightly more moderate 15 per cent decrease.

“This is the biggest change to electricity pricing that’s happened since the introduction of ICI,” Tim Christie, director of electricity policy, economics and system planning for Ontario’s Ministry of Energy, Northern Development and Mines, told online workshop attendees. “The government is funding the out-of-market costs of renewables. It does tail off into the 2030s as those contracts (for wind, solar and biomass generation) expire, but over the next eight-ish years, it’s pretty steady at around just over $3 billion per year.”

Extrapolating from 2020 costs, he pegged average electricity costs at roughly 9.1 cents/kWh for Class A commercial customers and 13.2 cents/kWh for Class B, a point of concern for Ontario manufacturers facing high rates as well. However, energy management specialists suggest actual 2021 numbers haven’t proved that out.

“In commercial buildings, we’re averaging 10 to 12 cents for Class A in 2021, and we’re seeing more than that for about 14, 15 cents for Class B,” reported Scott Rouse, managing partner with the consulting firm, Energy@Work.

GA costs for Class B customers dropped nearly 30 per cent in the first four months of 2021 compared to the last four months of 2020, when they averaged 11.8 cents/kWh. Thus far, though, there have been significant month-to-month fluctuations, with a low of 5.04 cents/kWh in February and a high of 10.9 cents/kWh in April contributing to the four-month average of 8.3 cents/kWh.

“In 2020, system-wide GA very often averaged more than $1 billion per month,” Rouse said. “This February it dropped to $500 million, which was really quite surprising. So it is a very volatile cost.”

Although welcome, the renewable cost shift does alter the payback on energy-saving investments, particularly for demand response mechanisms like energy storage. When combined with pandemic-related uncertainty and a series of policy and program reversals alongside calls to clean up Ontario’s hydro policy in recent years, the industry’s appetite for some more capital-intensive technologies appears to be flagging.

“Volatility puts a pause on some of the innovation,” said Terry Flynn, general manager with BentallGreenOak and chair of BOMA Toronto’s energy committee. “It could be a leading edge, but it might be a bleeding edge that won’t bear any fruit because the way the commodity costs are structured will change.”

“There’s kind of a wait-and-see approach on some of these bigger investments,” Douglas concurred.

Industrial Conservation Initiative underpins commercial class divide
Turning to the ICI, Class A customers — defined as those with average monthly energy demand of at least 1 megawatt (MW) — encountered some unexpected changes to the program rules during 2020. Meanwhile, Class B customers — encompassing the vast share of commercial properties smaller than about 350,000 square feet — confront the persistent reality of electricity cost allocation that offloads the burden from larger players onto them.

Through the ICI, participating Class A customers pay a share of the global adjustment that’s prorated to their energy use during the five hours of the period from May 1 to April 30 when the highest overall system demand is recorded. This gives Class A customers the opportunity to lock in a favourable factor for calculating their share of monthly system-wide global adjustment costs if they can successful project and curtail energy loads during those five hours of peak demand. On the flipside, Class B customers pay the remainder of those system-wide costs, on a straightforward per-kWh basis, once Class A payments have been reconciled.

“Class B has sometimes been regarded as the forgotten middle child of the customer classes in Ontario where all the shifted costs in the system kind of pile up,” acknowledged Mark Olsheski, vice president, energy and environment, with Sussex Strategy Group. “Likewise, there can be big unpredictable and uncontrollable swings in the global adjustment rate from month to month and, outside of pure energy efficiency, there really is precious little opportunity or empowerment for a Class B customer to take actions to lower their bills.”

Nevertheless, COVID-19 presents a few extra hiccups for Class A customers this year. Conventionally, late May is when they receive notification of the cost allocation factor that would be used to determine their GA for the upcoming July 1 to June 30 period. This year, though, all current ICI participants will retain the factor they secured by responding to the five hours of peak demand during the 12 months from May 1, 2019 to April 30, 2020 after the Ontario government placed a temporary halt on the peak demand response aspect of the program last summer. Regardless, eligible ICI participants must formally opt into the program by June 15 or they will be billed as Class B customers.

Peak chasing resumes for summer 2021
Since peak demand hours conventionally occur from June to September, Class A customers will once again be studying forecasts intently and preparing to respond via Peak Perks as the heat wave season sets in. That should help alleviate some of the system stresses that arose last summer — prompting policy-makers to reject lobbying for a continued pause on peak demand response.

“The policy rationale was to allow consumers to focus on their operations when recovering from COVID as opposed to reducing peaks. The other issue was that we did not expect the peaks to be high last summer given COVID shutdowns,” Christie recounted. “But due to some hot weather, more people at home and also the lack of ICI response, we saw peaks we haven’t seen in many, many years come up last summer. So the peak hiatus has ended and this summer we’ll be back to responding to ICI as per normal.”

Among Class A customers, owners/managers of office and retail facilities generally have the most to lose from a billing formula tied to the energy demand of more densely occupied buildings in the summer of 2019. However, they could be much more competitively positioned for 2022-23 if their buildings remain below full occupancy and energy demand stays lower than usual this summer.

“Where we can improve is the IESO (Independent Electricity System Operator) and the LDCs (local distribution companies) need to help customers get their real-time data, especially in light of the phantom demand issue, interpret their bills and their Class A versus B scenarios much more easily and comprehensively,” urged Lee Hodgkinson, vice president, technical services, sustainability and ESG, with Dream Unlimited. “ I look for APIs (application programming interface) and direct data flow from the LDCs to the building owners so that we can access that data really easily.”

Given Class A’s historic advantages, few eligible ICI participants are expected to migrate out to Class B. From a sustainability perspective, there’s perhaps more cause to question how the ICI’s 1-MW threshold encourages strategies to move in the other direction.

“You could jack up demand in some buildings and get them into Class A basically by firing up the chillers on the weekend and then pouring cooling outside to get rid of it,” Douglas noted. “That has nothing to do with climate change strategy or sustainability, but it’s a cost- saving strategy, and, sometimes, when you look at the math, it’s hundreds of thousands of dollars you can save.”

Brian Hewson, vice president, consumer protection and industry performance with the Ontario Energy Board (OEB), confirmed the OEB is currently scrutinizing the discrepancy that leaves Class B as the only consumer group with no flexibility to curtail energy load during higher-priced periods, and will be providing advice to the Ministry of Energy. In the interim, that status does, at least, simplify tactics.

“Just reduce your kWh and it doesn’t matter what time of day because you’re paying that fixed rate for 24 hours a day. So if you can curb your demand at night, you get a big bang for your dollar,” Rouse advised.

“We do talk about rates a lot, but if you’re not using it, you’re not paying for it,” Flynn agreed. “A lot of our focus is still on really to try to reduce the number of kilowatts that we use. That seems to be the best thing to do.”


Related News

View more

Sign Up for Electricity Forum’s Newsletter

Stay informed with our FREE Newsletter — get the latest news, breakthrough technologies, and expert insights, delivered straight to your inbox.

Electricity Today T&D Magazine Subscribe for FREE

Stay informed with the latest T&D policies and technologies.
  • Timely insights from industry experts
  • Practical solutions T&D engineers
  • Free access to every issue

Live Online & In-person Group Training

Advantages To Instructor-Led Training – Instructor-Led Course, Customized Training, Multiple Locations, Economical, CEU Credits, Course Discounts.

Request For Quotation

Whether you would prefer Live Online or In-Person instruction, our electrical training courses can be tailored to meet your company's specific requirements and delivered to your employees in one location or at various locations.