
CSA Z462 Arc Flash Training – Electrical Safety Compliance Course
Our customized live online or in‑person group training can be delivered to your staff at your location.

- Live Online
- 6 hours Instructor-led
- Group Training Available
Regular Price:
$249
Coupon Price:
$199
TORONTO
—
Toronto Olli 2.0 Self-Driving Shuttle connects West Rouge to Rouge Hill GO with autonomous micro-transit. Electric shuttle pilot by Local Motors and Pacific Western Transportation, funded by Transport Canada, features accessibility, TTC and Metrolinx support.
What's Behind the News
An autonomous micro-transit pilot linking West Rouge to Rouge Hill GO, with accessibility and onboard staff.
Autonomous micro-shuttle linking West Rouge to Rouge Hill GO
6-12 month pilot by Local Motors and Pacific Western Transportation
Funded by Transport Canada with TTC and Metrolinx support
Eight seats, ramp, wheelchair securement, audio/visual alerts
Onboard operator and TTC or Metrolinx ambassador each trip
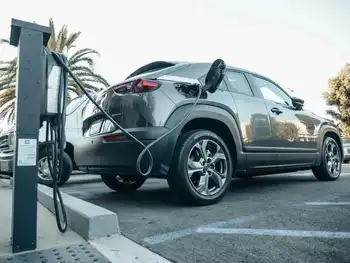
The city of Toronto, which recently opened an EV education centre to support adoption, has approved the use of a small, self-driving electric shuttle vehicle that will connect its West Rouge neighbourhood to the Rouge Hill GO station, a short span of a few kilometres.
It’s called the Olli 2.0, and it’s a micro-shuttle with service provided by Local Motors, in partnership with Pacific Western Transportation, as the province makes it easier to build EV charging stations to support growing demand.
The vehicle is designed to hold only eight people, and has an accessibility ramp, a wheelchair securement system, audio and visual announcements, and other features for providing rider information, aligning with transit safety policies such as the TTC’s winter lithium-ion device restrictions across the system.
“We are continuing to move our city forward on many fronts including micro-transit as we manage the effects of COVID-19,” said Mayor John Tory. “This innovative project will provide valuable insight, while embracing innovation that could help us build a better, more sustainable and equitable transportation network.”
At the provincial level, the public EV charging network has faced delays, underscoring infrastructure challenges.
Although the vehicle is “self-driving,” it will still require two people onboard for every trip during the six- to 12-month trial; those people will be a certified operator from Pacific Western Transportation, and either a TTC ambassador from an agency introducing battery electric buses across its fleet, or a Metrolinx customer service ambassador.
Funding for the program comes from Transport Canada, as part of a ten-year pilot program to test automated vehicles on Ontario’s roads that was approved in 2016, and it complements lessons from the TTC’s largest battery-electric bus fleet as well as emerging vehicle-to-grid programs that engage EV owners.
Related News
Related News

OEB Launches New 2026 Public EV Charging Rate
Ontario’s energy regulator will introduce a discounted charging-station electricity rate in 2026, cutting delivery costs…
View more

Canada must commit to 100 per cent clean electricity
Canada Green Investment Gap highlights lagging EV and clean energy funding as peers surge. With…
View more

Is it finally time to buy an electric car?
Electric Vehicles deliver longer range, faster charging, and broader price options, with incentives and lease…
View more

Biden seen better for Canada’s energy sector
Biden Impact on Canadian Energy Exports highlights shifts in trade policy, tariffs, carbon pricing, and…
View more
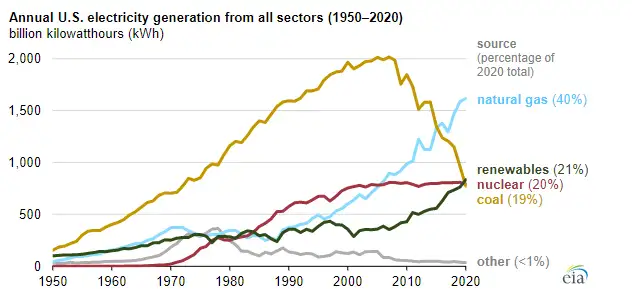
Renewables became the second-most prevalent U.S. electricity source in 2020
2020 U.S. Renewable Electricity Generation set a record as wind, solar, hydro, biomass, and geothermal…
View more
Will the next wave of Ontario's electric vehicles run on clean power?
Ontario EV Clean Electricity Plan aligns EV adoption with clean power, natural gas phaseout, and…
View more
Sign Up for Electricity Forum’s Newsletter
Stay informed with our FREE Newsletter — get the latest news, breakthrough technologies, and expert insights, delivered straight to your inbox.
Electricity Today T&D Magazine Subscribe for FREE

Stay informed with the latest T&D policies and technologies.
- Timely insights from industry experts
- Practical solutions T&D engineers
- Free access to every issue
