Texas Power Grid Crisis strains ERCOT as extreme cold, ice storms, and heavy snow trigger rolling blackouts, load shedding, and boil-water notices, leaving millions without electricity while frozen turbines and low gas pressure hinder generation.
Key Points
A statewide emergency of outages and boil-water notices as ERCOT battles extreme cold and load shedding.
✅ Millions without power; ERCOT orders load shedding
✅ Boil-water notices in Austin, Houston, Fort Worth
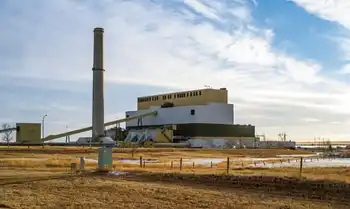
✅ Frozen equipment, low gas pressure, extreme cold disrupt supply
Nearly 3 million homes and businesses in Texas remain without power, some for a third consecutive day, as severe winter weather continues to pummel the state, forcing some localities to issue boil-water notices and urge residents to reduce their electricity usage.
Heavy snowfall, ice storms and bitter temperatures continue to put an enormous strain on the state's power grid. This as the Electric Reliability Council of Texas (ERCOT), which manages roughly 75% of the Texas power grid, announced Wednesday morning that some 600,000 households had power restored overnight.
That still left another 2.7 million customers having to endure extreme cold with no indication of when the thaw would break in their homes.
"We know millions of people are suffering," ERCOT's president and CEO, Bill Magness, said in a statement Wednesday. "We have no other priority than getting them electricity. No other priority."
ERCOT also said Wednesday that it was urging local utilities to shed some 14,000 megawatts of load, which translates to roughly 2.8 million customers, to prepare for a sudden increase in demand.
"The ability to restore more power is contingent on more generation coming back online," said Dan Woodfin, the senior director of ERCOT's system operations, and utility supply-chain constraints can further complicate repair timelines for some utilities.
He said that about 185 generating units were offline, stemming from a range of factors including frozen wind turbines, low gas pressure and frozen instrumentation.
But many Texans feel abandoned by the council and power companies and they are lashing out at the local face of utilities.
The City of Austin's community-owned electric utility, Austin Energy, issued a tweet saying crews that are working to restore power are facing harassment.
"Our crews have been working 24/7 and in these elements," Austin Energy announced. "Some of our crews are reporting incidents of harassment, threatening them and even throwing things at them."
Officials pleaded with the public to remain calm. "I know people are extremely frustrated. But please, I bet of you, do not approach AE crews."
Parts of Austin are under a boil water notice, which Austin Water Director Greg Meszaros attempted to explain during a press briefing Wednesday afternoon.
"There was a large main break in that area, maybe multiple ones. We're seeing main breaks and pipes bursting by the tens of thousands. Our entire system is under stress," Meszaros said.
It's not just the Lone Star State that is being crippled by the arctic blast, with a deep freeze slamming the energy sector across the country.
At least two dozen people have died this week from weather-related incidents, according to The Associated Press.
The National Weather Service reports that more than 100 million Americans are being affected by extreme winter weather from the south central U.S. to the East Coast, including Arkansas, Louisiana, Mississippi, North Carolina, Virginia and West Virginia, and analysts warn of blackout risks nationwide during extreme heat as well.
The National Weather Service adds that cold temperatures over the nation's heartland will begin to "moderate in the coming days" but that many parts will remain 20 to 35 degrees below normal in the Great Plains, Mississippi Valley and lower Great Lakes region.
"Potential is increasing for significant icing across portions of the Mid-Atlantic, which will be very impactful, especially for those hardest hit from the previous ice storm," the National Weather Service tweeted Wednesday.
Texas Gov. Greg Abbott railed against ERCOT, and Elon Musk criticized the agency as unreliable, saying the utility "has been anything but reliable over the past 48 hours."
"This is unacceptable," Abbott added, as residents were facing rotating intentional power outages. The governor issued an executive order that will add reforms for how the power grid is managed, including grid reliability improvements under discussion, as an emergency legislative item for the state legislature to review.
The rolling power outages forced Fort Worth to extend a boil-water notice for roughly 212,000 residents. Officials said the outages affected the city's systems that both treat water and move it to customers.
Fort Worth officials said nine other localities that purchase water from the city are also affected, including Haslet, Keller, Lake Worth and Northlake.
Officials in Houston also issued a boil-water notice for the city's residents Wednesday.
"Do not drink the water without boiling it first," Houston Public Works said from its official Twitter account. "Bring all water to a boil for at least two minutes. Let it cool before using."
In Harris County, which includes Houston, Judge Lina Hidalgo warned residents about extended power outages.
"Let me give it to you straight, based on the visibility I have: Whether you have power or not right now, there is a possibility of power outages even beyond the length of this weather," Hidalgo said, according to Houston Public Media.
The NPR member station adds that county officials have also reported more than 300 cases of carbon monoxide poisoning since Monday as residents going without electricity search desperately for alternative sources of warmth.
"In no uncertain terms, this is a public health disaster and a public health emergency," Samuel Prater, an emergency physician at Memorial Hermann-Texas Medical Center, said at a news briefing Tuesday.
Prater warned residents that over the last 24 hours, emergency officials "have seen a striking increase in the number of cases related to improper heating sources," including indoor use of generators, charcoal grills, campfire stoves and other devices that are being used to warm homes. The result, he added, is carbon monoxide poisoning of entire families.
"If you think you or a loved one has become ill from carbon monoxide poisoning, first thing you need to do is get outside to fresh air," Prater said.
A woman and an 8-year-old girl are among those who have reportedly died from carbon monoxide poisoning after a vehicle was left running inside a garage in an attempt to generate heat, according to Houston's ABC affiliate.
As Texas endures further weather-related issues, including road and highway closures, there's a renewed focus on how the Texas power grid has failed, and why the grid is facing another crisis amid this prolonged cold.
The Texas electrical grid is "facing conditions that it was not designed for," said Emily Grubert, a professor at Georgia Tech whose expertise includes electric networks.
"These are really extreme conditions for the Texas grid. It's very cold. It's cold across the entire state, and it's cold for a long time. This does not happen very often," she said in an interview with NPR's Morning Edition.
"Demand really spiked both in the electricity and the natural gas systems at the same time as a lot of the generators were not able to operate because of those cold conditions, and not being prepared for it is really what's going on," Grubert said. "But a lot of grids are susceptible to really, really major failures when they are this far outside of design conditions."
Abbott told Fox News on Tuesday that with weather-related shutdowns in wind and solar energy, which account for more than 10% of the state's grid, renewable energy is partly to blame for the Texas power crisis, even as he later touted the grid's readiness heading into the fall.
"It just shows that fossil fuel is necessary for the state of Texas as well as other states to make sure that we'll be able to heat our homes in the wintertime and cool our homes in the summertime," Abbott said.
But Grubert said that "coal, gas and nuclear actually shut down because of the extreme cold due to things like instruments freezing, et cetera. So I think the overall point here is all of the fuels were really, really struggling."
Related News