Bitcoin Energy Debate examines electricity usage, mining costs, environmental impact, and blockchain efficiency, weighing renewable power, carbon footprint, scalability, and transaction throughput to clarify stakeholder claims from Tesla, Square, academics, and policymakers.
Key Points
Debate on Bitcoin mining's power use, environmental impact, efficiency, and scalability versus alternative blockchains.
✅ Compares energy intensity with transaction throughput and system outputs.
✅ Weighs renewables, stranded power, and carbon footprint in mining.
✅ Assesses PoS blockchains, stablecoins, and scalability tradeoffs.
There is a great debate underway about the electricity required to process Bitcoin transactions. The debate is significant, the stakes are high, the views are diverse, and there are smart people on both sides. Bitcoin generates a lot of emotion, thereby producing too much heat and not enough light. In this post, I explain the importance of identifying the key issues in the debate, and of understanding the nature and extent of disagreement about how much electrical energy Bitcoin consumes.
Consider the background against which the debate is taking place. Because of its unstable price, Bitcoin cannot serve as a global mainstream medium of exchange. The instability is apparent. On January 1, 2021, Bitcoin’s dollar price was just over $29,000. Its price rose above $63,000 in mid-April, and then fell below $35,000, where it has traded recently. Now the financial media is asking whether we are about to experience another “cyber winter” as the prices of cryptocurrencies continue their dramatic declines.
Central banks warns of bubble on bitcoins as it skyrockets
As bitcoins skyrocket to more than $12 000 for one BTC, many central banks as ECB or US Federal ... [+] NURPHOTO VIA GETTY IMAGES
Bitcoin is a high sentiment beta asset, and unless that changes, Bitcoin cannot serve as a global mainstream medium of exchange. Being a high sentiment beta asset means that Bitcoin’s market price is driven much more by investor psychology than by underlying fundamentals.
As a general matter, high sentiment beta assets are difficult to value and difficult to arbitrage. Bitcoin qualifies in this regard. As a general matter, there is great disagreement among investors about the fair values of high sentiment beta assets. Bitcoin qualifies in this regard.
One major disagreement about Bitcoin involves the very high demand for electrical power associated with Bitcoin transaction processing, an issue that came to light several years ago. In recent months, the issue has surfaced again, in a drama featuring disagreement between two prominent industry leaders, Elon Musk (from Tesla and SpaceX) and Jack Dorsey (from Square).
On one side of the argument, Musk contends that Bitcoin’s great need for electrical power is detrimental to the environment, especially amid disruptions in U.S. coal and nuclear power that increase supply strain. On the other side, Dorsey argues that Bitcoin’s electricity profile is a benefit to the environment, in part because it provides a reliable customer base for clean electric power. This might make sense, in the absence of other motives for generating clean power; however, it seems to me that there has been a surge in investment in alternative technologies for producing electricity that has nothing to do with cryptocurrency. So I am not sure that the argument is especially strong, but will leave it there. In any event, this is a demand side argument.
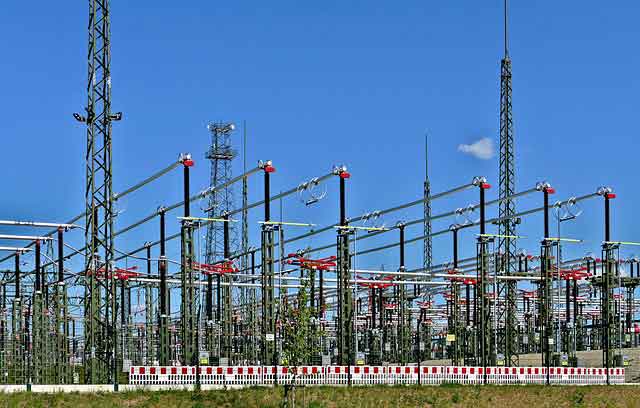
A supply side argument favoring Bitcoin is that the processing of Bitcoin transactions, known as “Bitcoin mining,” already uses clean electrical power, power which has already been produced, as in hydroelectric plants at night, but not otherwise consumed in an era of flat electricity demand across mature markets.
Both Musk and Dorsey are serious Bitcoin investors. Earlier this year, Tesla purchased $1.5 billion of Bitcoin, agreed to accept Bitcoin as payment for automobile sales, and then reversed itself. This reversal appears to have pricked an expanding Bitcoin bubble. Square is a digital transaction processing firm, and Bitcoin is part of its long-term strategy.
Consider two big questions at the heart of the digital revolution in finance. First, to what degree will blockchain replace conventional transaction technologies? Second, to what degree will competing blockchain based digital assets, which are more efficient than Bitcoin, overcome Bitcoin’s first mover advantage as the first cryptocurrency?
To gain some insight about possible answers to these questions, and the nature of the issues related to the disagreement between Dorsey and Musk, I emailed a series of academics and/or authors who have expertise in blockchain technology.
David Yermack, a financial economist at New York University, has written and lectured extensively on blockchains. In 2019, Yermack wrote the following: “While Bitcoin and successor cryptocurrencies have grown remarkably, data indicates that many of their users have not tried to participate in the mainstream financial system. Instead they have deliberately avoided it in order to transact in black markets for drugs and other contraband … or evade capital controls in countries such as China.” In this regard, cyber-criminals demanding ransom for locking up their targets information systems often require payment in Bitcoin. Recent examples of cyber-criminal activity are not difficult to find, such as incidents involving Kaseya and Colonial Pipeline.
David Yermack continues: “However, the potential benefits of blockchain for improving data security and solving moral hazard problems throughout the financial system have become widely apparent as cryptocurrencies have grown.” In his recent correspondence with me, he argues that the electrical power issue associated with Bitcoin “mining,” is relatively minor because Bitcoin miners are incentivized to seek out cheap electric power, and patterns shifted as COVID-19 changed U.S. electricity consumption across sectors.
Thomas Philippon, also a financial economist at NYU, has done important work characterizing the impact of technology on the resource requirements of the financial sector. He has argued that historically, the financial sector has comprised about 6-to-7% of the economy on average, with variability over time. Unit costs, as a percentage of assets, have consistently been about 2%, even with technological advances. In respect to Bitcoin, he writes in his correspondence with me that Bitcoin is too energy inefficient to generate net positive social benefits, and that energy crisis pressures on U.S. electricity and fuels complicate the picture, but acknowledges that over time positive benefits might be possible.
Emin Gün Sirer is a computer scientist at Cornell University, whose venture AVA Labs has been developing alternative blockchain technology for the financial sector. In his correspondence with me, he writes that he rejects the argument that Bitcoin will spur investment in renewable energy relative to other stimuli. He also questions the social value of maintaining a fairly centralized ledger largely created by miners that had been in China and are now migrating to other locations such as El Salvador.
Bob Seeman is an engineer, lawyer, and businessman, who has written a book entitled Bitcoin: The Mother of All Scams. In his correspondence with me, he writes that his professional experience with Bitcoin led him to conclude that Bitcoin is nothing more than unlicensed gambling, a point he makes in his book.
David Gautschi is an academic at Fordham University with expertise in global energy. I asked him about studies that compare Bitcoin’s use of energy with that of the U.S. financial sector. In correspondence with me, he cautioned that the issues are complex, and noted that online technology generally consumes a lot of power, with electricity demand during COVID-19 highlighting shifting load profiles.
My question to David Gautschi was prompted by a study undertaken by the cryptocurrency firm Galaxy Digital. This study found that the financial sector together with the gold industry consumes twice as much electrical power as Bitcoin transaction processing. The claim by Galaxy is that Bitcoin’s electrical power needs are “at least two times lower than the total energy consumed by the banking system as well as the gold industry on an annual basis.”
Galaxy’s analysis is detailed and bottom up based. In order to assess the plausibility of its claims, I did a rough top down analysis whose results were roughly consistent with the claims in the Galaxy study. For sake of disclosure, I placed the heuristic calculations I ran in a footnote.1 If we accept the Galaxy numbers, there remains the question of understanding the outputs produced by the electrical consumption associated with both Bitcoin mining and U.S. banks’ production of financial services. I did not see that the Galaxy study addresses the output issue, and it is important.
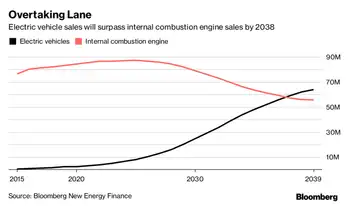
Consider some quick statistics which relate to the issue of outputs. The total market for global financial services was about $20 trillion in 2020. The number of Bitcoin transactions processed per day was about 330,000 in December 2020, and about 400,000 in January 2021. The corresponding number for Bitcoin’s digital rival Ethereum during this time was about 1.1 million transactions per day. In contrast, the global number of credit card transactions per day in 2018 was about 1 billion.2
Bitcoin Value Falls
LONDON, ENGLAND - NOVEMBER 20: A visual representation of the cryptocurrencies Bitcoin and Ethereum ... [+] GETTY IMAGES
These numbers tell us that Bitcoin transactions comprise a small share, on the order of 0.04%, of global transactions, but use something like a third of the electricity needed for these transactions. That said, the associated costs of processing Bitcoin transactions relate to tying blocks of transactions together in a blockchain, not to the number of transactions. Nevertheless, even if the financial sector does indeed consume twice as much electrical power as Bitcoin, the disparity between Bitcoin and traditional financial technology is striking, and the experience of Texas grid reliability underscores system constraints when it comes to output relative to input. This, I suggest, weakens the argument that Bitcoin’s electricity demand profile is inconsequential because Bitcoin mining uses slack electricity.
A big question is how much electrical power Bitcoin mining would require, if Bitcoin were to capture a major share of the transactions involved in world commerce. Certainly much more than it does today; but how much more?
Given that Bitcoin is a high sentiment beta asset, there will be a lot of disagreement about the answers to these two questions. Eventually we might get answers.
At the same time, a high sentiment beta asset is ill suited to being a medium of exchange and a store of value. This is why stablecoins have emerged, such as Diem, Tether, USD Coin, and Dai. Increased use of these stable alternatives might prevent Bitcoin from ever achieving a major share of the transactions involved in world commerce.
We shall see what the future brings. Certainly El Salvador’s recent decision to make Bitcoin its legal tender, and to become a leader in Bitcoin mining, is something to watch carefully. Just keep in mind that there is significant downside to experiencing foreign exchange rate volatility. This is why global financial institutions such as the World Bank and IMF do not support El Salvador’s decision; and as I keep saying, Bitcoin is a very high sentiment beta asset.
In the past I suggested that Bitcoin bubble would burst when Bitcoin investors conclude that its associated processing is too energy inefficient. Of course, many Bitcoin investors are passionate devotees, who are vulnerable to the psychological bias known as motivated reasoning. Motivated reasoning-based sentiment, featuring denial,3 can keep a bubble from bursting, or generate a series of bubbles, a pattern we can see from Bitcoin’s history.
I find the argument that Bitcoin is necessary to provide the right incentives for the development of clean alternatives for generating electricity to be interesting, but less than compelling. Are there no other incentives, such as evolving utility trends, or more efficient blockchain technologies? Bitcoin does have a first mover advantage relative to other cryptocurrencies. I just think we need to be concerned about getting locked into an technologically inferior solution because of switching costs.
There is an argument to made that decisions, such as how to use electric power, are made in markets with self-interested agents properly evaluating the tradeoffs. That said, think about why most of the world adopted the Windows operating system in the 1980s over the superior Mac operating system offered by Apple. Yes, we left it to markets to determine the outcome. People did make choices; and it took years for Windows to catch up with the Mac’s operating system.
My experience as a behavioral economist has taught me that the world is far from perfect, to expect to be surprised, and to expect people to make mistakes. We shall see what happens with Bitcoin going forward.
As things stand now, Bitcoin is well suited as an asset for fulfilling some people’s urge to engage in high stakes gambling. Indeed, many people have a strong need to engage in gambling. Last year, per capita expenditure on lottery tickets in Massachusetts was the highest in the U.S. at over $930.
High sentiment beta assets offer lottery-like payoffs. While Bitcoin certainly does a good job of that, it cannot simultaneously serve as an effective medium of exchange and reliable store of value, even setting aside the issue at the heart of the electricity debate.
Related News