B.C. energy minister to rein in hydro rates

By Globe and Mail


Substation Relay Protection Training

Our customized live online or in‑person group training can be delivered to your staff at your location.

  • Live Online
  • 12 hours Instructor-led
  • Group Training Available
Regular Price:
$699
Coupon Price:
$599
Reserve Your Seat Today
B.C. Energy Minister Rich Coleman is expected to announce his plans to bring BC Hydro rates under control as part of his governmentÂ’s new agenda to rein in soaring household costs.

And Blair Lekstrom, the Minister of Transportation, is taking a run at BC FerriesÂ’ fares, which he says are rising at an unsustainable rate.

The twin reviews are part of Premier Christy ClarkÂ’s promise to look at the total tax burden on families.

But the one tax hike that sheÂ’s shown no interest in reviewing is one of the most controversial: The carbon tax is set to jump on July 1, bringing prices at the pumps up another six cents a litre.

Finance Minister Kevin Falcon suggested a freeze on the carbon tax when he was seeking the party leadership. But that isn’t on the table, said the minister in charge of Ms. Clark’s so-called family-first agenda, Mary McNeil. “We haven’t had that discussion.”

ItÂ’s a reflection of the fine line Ms. Clark is walking. The new Premier has promised a rethink of the host of taxes and fees piled on to B.C. families by public institutions.

While the Liberal government has long relied on bragging about its low personal income-tax rates, Ms. Clark has taken a broader, less flattering view. She points instead to the B.C. Progress Board assessment that puts the province in the middle of the pack, compared with the rest of Canada. The board looks at the consolidated tax burden of the provincial and local governments on a per-capita basis. By that measure, B.C. ranks fifth among the provinces for individual taxpayers.

Ms. Clark has raised expectations that families will be able to count on a break from a populist premier who has set her sights on an early election.

But at the same time, Ms. Clark has also committed to eliminating the deficit, and the present budget does not afford her significant manoeuvring room. So higher subsidies for BC Ferries, for example, are not an easy solution.

Ms. McNeil, the Minister for Children and Families, said putting a “families first” lens on government action doesn’t mean taxpayers can count on a freeze on rates. “We do have some issues here, it is tough on families. Do we need to do as much as we were planning or can we scale it back and do it over a longer term? That’s the kind of realistic discussion we have to have.”

BC Hydro has proposed rate increases of roughly 50 per cent over the next five years. A rate hike that was supposed to take effect April 1 has been put on hold pending Mr. ColemanÂ’s review.

Jock Finlayson, chief economist for the Business Council of B.C., said hydro-rate increases will be tough to suppress – although he applauds any effort to try.

He said he understands why Ms. Clark would be taken aback at the proposed rate hikes. “This is a huge jump in an essential consumption item for businesses and households,” he said. “She’s reflecting a common-sense reaction.”

But he said BC Hydro does need to invest in its crumbling infrastructure. “It would be a huge mistake to think as a result of this review the cost of power is going to stop rising.” The province needs to look at some of the policies it has imposed on BC Hydro – such as conservation and self-sufficiency targets – in order to give Hydro, and its ratepayers, some breathing room.

Mr. Lekstrom, meanwhile, has 90 days to craft a plan to address ferry-fare increases that were tentatively approved by the ferries commissioner last week, with ticket prices rising by 18 per cent on the major routes over the next four years, higher still on the money-losing minor routes.

“I don’t think anyone can continue to afford to continue to travel if the rate increases continue at this pace,” he said. “This isn’t about taking on BC Ferries. There are some cost challenges and the public is looking to government, saying, ‘We want you to fix this’ and I’m not going to sidestep that.”

Related News

Solar + Wind = 10% of US Electricity Generation in 1st Half of 2018

US Electricity Generation H1 2018 saw wind and solar gains but hydro declines, as natural gas led the grid mix and coal fell; renewables' share, GWh, emissions, and capacity additions shaped the power sector.


Key Points

It is the H1 2018 US power mix, where natural gas led, coal declined, and wind and solar grew while hydro fell.

✅ Natural gas reached 32% of generation, highest share

✅ Coal fell; renewables roughly tied nuclear at ~20%

✅ Wind and solar up; hydro output down vs 2017


To complement our revival of US electricity capacity reports, here’s a revival of our reports on US electricity generation.

As with the fresh new capacity report, things are not looking too bright when it comes to electricity generation. There’s still a lot of grey — in the bar charts below, in the skies near fossil fuel power plants, and in the human and planetary outlook based on how slowly we are cutting fossil fuel electricity generation.

As you can see in the charts above, wind and solar energy generation increased notably from the first half of 2017 to the first half of 2018, and the EIA expected larger summer solar and wind generation in subsequent months, reinforcing that momentum.

A large positive when it comes to the environment and human health is that coal generation dropped a great deal year over year — by even more than renewables increased, though the EIA later noted an increase in coal-fired generation in a subsequent year, complicating the trend. However, on the down side, natural gas soared as it became the #1 source of electricity generation in the United States (32% of US electricity). Furthermore, coal was still solidly in the #2 position (27% of US electricity). Renewables and nuclear were essentially in a tie at 19.8% of generation, with renewables just a tad above nuclear.

Actually, combined with an increase in nuclear power generation, natural gas electricity production increased so much that the renewable energy share of electricity generation actually dropped in the first half of 2018 versus the first half of 2017, even amid declining electricity use in some periods. It was 19.8% this year and 20% last year.

Again, solar and wind saw a significant growth in its market share, from 9% to 9.9%, but hydro brought the whole category down due to a decrease from 9% to 8%.

The visuals above are probably the best way to examine it all. The H1 2018 chart was still dominated by fossil fuels, which together accounted for approximately 60% of electricity generation, even though by 2021 non-fossil sources supplied about 40% of U.S. electricity, highlighting the longer-term shift. In H1 2017, the figure was 59.7%. Furthermore, if you switch to the “Change H1 2018 vs H1 2017 (GWh)” chart, you can watch a giant grey bar representing natural gas take over the top of the chart. It almost looks like it’s part of the border of the chart. The biggest glimmer of positivity in that chart is seeing the decline in coal at the bottom.

What will the second half of the year bring? Well, the gigantic US electricity generation market shifts slowly, even as monthly figures can swing, as January generation jumped 9.3% year over year according to the EIA, reminding us about volatility. There is so much base capacity, and power plants last so long, that it takes a special kind of magic to create a rapid transition to renewable energy. As you know from reading this quarter’s US renewable energy capacity report, only 43% of new US power capacity in the first half of the year was from renewables. The majority of it was from natural gas. Along with other portions of the calculation, that means that electricity generation from natural gas is likely to increase more than electricity generation from renewables.

Jump into the numbers below and let us know if you have any more thoughts.


Related News

View more

Electricity Prices in France Turn Negative

Negative Electricity Prices in France signal oversupply from wind and solar, stressing the wholesale market and grid. Better storage, demand response, and interconnections help balance renewables and stabilize prices today.


Key Points

They occur when renewable output exceeds demand, pushing power prices below zero as excess energy strains the grid.

✅ Driven by wind and solar surges with low demand

✅ Challenges thermal plants; erodes margins at negative prices

✅ Needs storage, demand response, and cross-border interties


France has recently experienced an unusual and unprecedented situation in its electricity market: negative electricity prices. This development, driven by a significant influx of renewable energy sources, highlights the evolving dynamics of energy markets as countries increasingly rely on clean energy technologies. The phenomenon of negative pricing reflects both the opportunities and renewable curtailment challenges associated with the integration of renewable energy into national grids.

Negative electricity prices occur when the supply of electricity exceeds demand to such an extent that producers are willing to pay consumers to take the excess energy off their hands. This situation typically arises during periods of high renewable energy generation coupled with low energy demand. In France, this has been driven primarily by a surge in wind and solar power production, which has overwhelmed the grid and created an oversupply of electricity.

The recent surge in renewable energy generation can be attributed to a combination of favorable weather conditions and increased capacity from new renewable energy installations. France has been investing heavily in wind and solar energy as part of its commitment to reducing greenhouse gas emissions and transitioning towards a more sustainable energy system, in line with renewables surpassing fossil fuels in Europe in recent years. While these investments are essential for achieving long-term climate goals, they have also led to challenges in managing energy supply and demand in the short term.

One of the key factors contributing to the negative prices is the variability of renewable energy sources. Wind and solar power are intermittent by nature, meaning their output can fluctuate significantly depending on weather conditions, with solar reshaping price patterns in Northern Europe as deployment grows. During times of high wind or intense sunshine, the electricity generated can far exceed the immediate demand, leading to an oversupply. When the grid is unable to store or export this excess energy, prices can drop below zero as producers seek to offload the surplus.

The impact of negative prices on the energy market is multifaceted. For consumers, negative prices can lead to lower energy costs as wholesale electricity prices fall during oversupply, and even potential credits or payments from energy providers. This can be a welcome relief for households and businesses facing high energy bills. However, negative prices can also create financial challenges for energy producers, particularly those relying on conventional power generation methods. Fossil fuel and nuclear power plants, which have higher operating costs, may struggle to compete when prices are negative, potentially affecting their profitability and operational stability.

The phenomenon also underscores the need for enhanced energy storage and grid management solutions. Excess energy generated from renewable sources needs to be stored or redirected to maintain grid stability and avoid negative pricing situations. Advances in battery storage technology, such as France's largest battery storage platform, and improvements in grid infrastructure are essential to addressing these challenges and optimizing the integration of renewable energy into the grid. By developing more efficient storage solutions and expanding grid capacity, France can better manage fluctuations in renewable energy production and reduce the likelihood of negative prices.

France's experience with negative electricity prices is part of a broader trend observed in other countries with high levels of renewable energy penetration. Similar situations have occurred in Germany, where solar plus storage is now cheaper than conventional power, the United States, and other regions where renewable energy capacity is rapidly expanding. These instances highlight the growing pains associated with transitioning to a cleaner energy system and the need for innovative solutions to balance supply and demand.

The French government and energy regulators are closely monitoring the situation and exploring measures to mitigate the impact of negative prices. Policy adjustments, market reforms, and investments in energy infrastructure are all potential strategies to address the challenges posed by high renewable energy generation. Additionally, encouraging the development of flexible demand response programs and enhancing grid interconnections with neighboring countries can help manage excess energy and stabilize prices.

In the long term, the rise of renewable energy and the occurrence of negative prices represent a positive development for the energy transition. They indicate progress towards cleaner energy sources and a more sustainable energy system. However, managing the associated challenges is crucial for ensuring that the transition is smooth and economically viable for all stakeholders involved.

In conclusion, the recent instance of negative electricity prices in France highlights the complexities of integrating renewable energy into the national grid. While the phenomenon reflects the success of France’s efforts to expand its renewable energy capacity, it also underscores the need for advanced grid management and storage solutions. As the country continues to navigate the transition to a more sustainable energy system, addressing these challenges will be essential for maintaining a stable and efficient energy market. The experience serves as a valuable lesson for other nations undergoing similar transitions and reinforces the importance of innovation and adaptability in the evolving energy landscape.


Related News

View more

Electricity Demand In The Time Of COVID-19

COVID-19 Impact on U.S. Power Demand shows falling electricity load, lower wholesale prices, and resilient utilities in competitive markets, with regional differences tied to weather, renewable energy, stay-at-home orders, and hedging strategies.


Key Points

It outlines reduced load and prices, while regulatory design and hedging support utility stability across regions.

✅ Load down in NY, New England, PJM; weather drives South up.

✅ Wholesale prices fall 8-10% in key markets.

✅ Decoupling, contracts, hedging support utility earnings.


On March 27, Bloomberg New Energy Finance (BNEF) released a report on electricity demand and wholesale market prices impact from COVID-19 fallout. The model compares expected load based largely on weather with actual observed electricity demand changes.

So far, the hardest hit power grid is New York, with load down 7 and prices off by 10 percent. That’s expected, given New York City is the current epicenter of the US health crisis.

Next is New England, with 5 percent lower demand and 8 percent reduced wholesale prices for the week from March 19-25. BNEF says the numbers could go higher following advisories and orders issued March 24 for some 70 percent of the region’s population to stay at home.

Demand on the biggest grid in the US, the PJM (Pennsylvania/Jersey/Maryland), is 4 percent lower, with prices dropping 8 percent, as recent capacity auction payouts fell sharply. BNEF believes there will be more impact as stay at home orders are ramped up in several states.

California’s power demand for March 19-25 was 5 percent below what BNEF’s model expects without COVID-19 impact. That reflects a full week of stay-at-home orders from Governor Newsom issued March 19.

Health officials in Los Angeles and elsewhere expect a spike in COVID-19 cases in coming weeks. But BNEF’s model now actually projects rising electricity load for the state, due to what it calls "freakishly mild weather a year ago."

Rounding out the report, power demand is up for a band of southern states stretching from Florida to the desert Southwest, with weather more than offsetting public response to COVID-19 so far. BNEF says the Northwest’s grid "has not yet been highly impacted," while the Southeast is "generally in line" with pre-virus expectations.

Clearly, all of this data can change quickly and radically. Only California and New York are currently in full shutdown mode. Following them are New England (70 percent), the Midwest (65 percent), Texas (50 percent), PJM (50 percent) and the Northwest (50 percent).

In contrast, only small parts of Florida, the Southeast and Southwest are restricting movement. That could mean a big future increase for shut-ins, with heightened risks of electricity shut-offs that burden households and a corresponding impact on power demand.

Also, weather will play a major role on what happens to actual electricity demand, just as it always does. A very hot summer, for example, could offset virus-related shut-ins, just as it apparently is now in states like Texas. And it should be pointed out that regions vary widely by exposure to recession-sensitive sources of demand, such as heavy industry.

Most important for investors, however, is the built in protection US utility earnings enjoy from declining power demand, even amid broader energy crisis pressures facing the sector. For one thing, US power grids in California, ERCOT (Texas), MISO (Midwest), New England, New York and PJM have wholesale power markets, where producers compete for sales and the lowest bidder sets the price.

In those states, most regulated utilities don’t produce power at all. In fact, companies’ revenue is decoupled entirely from demand in California, as well as much of New England. In the roughly three-dozen states where utilities still operate as integrated monopolies, demand does affect revenue, and in many regions flat electricity demand already persists. But the cost of electricity is passed through directly to customers, whether produced or purchased.

A number of US electric companies have invested in renewable energy facilities as part of broader electrification trends nationwide. These sell their output under long-term contracts primarily with other utilities and government entities.

This isn’t a risk free business: For the past year, generators selling electricity to bankrupt PG&E Corp (PCG) have had their cash trapped at the power plant level as surety for lenders. But even PG&E has honored its contracts. And with states continuing aggressive mandates for renewable energy adoption, growth doesn’t appear at risk to COVID-19 fallout either.

The wholesale price of power from natural gas, coal and many nuclear plants was already sliding before COVID-19, due to renewables adoption and low natural gas prices, even as coal and nuclear disruptions raise reliability concerns. But here too, big producers like Exelon Corp (EXC) and Vistra Energy (VST) have employed aggressive price hedging near term, with regulated utilities and retail businesses protecting long-term health, respectively.

Bottom line: It’s early days for the COVID-19 crisis and much can still change. But so far at least, the US power industry is absorbing the blow of reduced demand, just as it’s done in previous crises.

That means future selloffs in the ongoing bear market are buying opportunities for best in class electric utilities, not a reason to sell. For top candidates, see the Conrad’s Utility Investor Portfolios and Dream Buy List in the March issue. 


Related News

View more

Renewables are not making electricity any more expensive

Renewables' Impact on US Wholesale Electricity Prices is clear: DOE analysis shows wind and solar, capacity gains, and natural gas lowering rates, shifting daily patterns, and triggering occasional negative pricing in PJM and ERCOT.


Key Points

DOE data show wind and solar lower wholesale prices, reshape price curves, and cause negative pricing in markets.

✅ Natural gas price declines remain the largest driver of cheaper power

✅ Wind and solar shift seasonal and time-of-day price patterns

✅ Negative wholesale prices appear near high wind and solar output


One of the arguments that's consistently been raised against doing anything about climate change is that it will be expensive. On the more extreme end of the spectrum, there have been dire warnings about plunging standards of living due to skyrocketing electricity prices. The plunging cost of renewables like solar cheaper than gas has largely silenced these warnings, but a new report from the Department of Energy suggests that, even earlier, renewables were actually lowering the price of electricity in the United States.


Plunging prices
The report focuses on wholesale electricity prices in the US. Note that these are distinct from the prices consumers actually pay, which includes taxes, fees, payments to support the grid that delivers the electricity, and so on. It's entirely possible for wholesale electricity prices to drop even as consumers end up paying more, and market reforms determine how those changes are passed through. That said, large changes in the wholesale price should ultimately be passed on to consumers to one degree or another.

The Department of Energy analysis focuses on the decade between 2008 and 2017, and it includes an overall analysis of the US market, as well as large individual grids like PJM and ERCOT and, finally, local prices. The decade saw a couple of important trends: low natural gas prices that fostered a rapid expansion of gas-fired generators and the rapid expansion of renewable generation that occurred concurrently with a tremendous drop in price of wind and solar power.

Much of the electricity generated by renewables in this time period would be more expensive than that generated by wind and solar installed today. Not only have prices for the hardware dropped, but the hardware has improved in ways that provide higher capacity factors, meaning that they generate a greater percentage of the maximum capacity. (These changes include things like larger blades on wind turbines and tracking systems for solar panels.) At the same time, operating wind and solar is essentially free once they're installed, so they can always offer a lower price than competing fossil fuel plants.

With those caveats laid out, what does the analysis show? Almost all of the factors influencing the wholesale electricity price considered in this analysis are essentially neutral. Only three factors have pushed the prices higher: the retirement of some plants, the rising price of coal, and prices put on carbon, which only affect some of the regional grids.

In contrast, the drop in the price of natural gas has had a very large effect on the wholesale power price. Depending on the regional grid, it's driven a drop of anywhere from $7 to $53 per megawatt-hour. It's far and away the largest influence on prices over the past decade.


Regional variation and negative prices
But renewables have had an influence as well. That influence has ranged from roughly neutral to a cost reduction of $2.2 per MWh in California, largely driven by solar. While the impact of renewables was relatively minor, it is the second-largest influence after natural gas prices, and the data shows that wind and solar are reducing prices rather than increasing them.

The reports note that renewables are influencing wholesale prices in other ways, however. The growth of wind and solar caused the pattern of seasonal price changes to shift in areas of high wind and solar, as seen with solar reshaping prices in Northern Europe as daylight hours and wind patterns shift with the seasons. Similarly, renewables have a time-of-day effect for similar reasons, helping explain why the grid isn't 100% renewable today, which also influences the daily timing price changes, something that's not an issue with fossil fuel power.

A map showing the areas where wholesale electricity prices have gone negative, with darker colors indicating increased frequency.
Enlarge / A map showing the areas where wholesale electricity prices have gone negative, with darker colors indicating increased frequency.

US DOE
One striking feature of areas where renewable power is prevalent is that there are occasional cases in which an oversupply of renewable energy produces negative electricity prices in the wholesale market. (In the least-surprising statement in the report, it concludes that "negative prices in high-wind and high-solar regions occurred most frequently in hours with high wind and solar output.") In most areas, these negative prices are rare enough that they don't have a significant influence on the wholesale price.

That's not true everywhere, however. Areas on the Great Plains see fairly frequent negative prices, and they're growing in prevalence in areas like California, the Southwest, and the northern areas of New York and New England, while negative prices in France have been observed in similar conditions. In these areas, negative wholesale prices near solar plants have dropped the overall price by 3%. Near wind plants, that figure is 6%.

None of this is meant to indicate that there are no scenarios where expanded renewable energy could eventually cause wholesale prices to rise. At sufficient levels, the need for storage, backup plants, and grid management could potentially offset their low costs, a dynamic sometimes referred to as clean energy's dirty secret by analysts. But it's clear we have not yet reached that point. And if the prices of renewables continue to drop, then that point could potentially recede fast enough not to matter.


Related News

View more

Global oil demand to decline in 2020 as Coronavirus weighs heavily on markets

COVID-19 Impact on Global Oil Demand 2020 signals an IEA forecast of declining consumption as travel restrictions curb transport fuels, disrupt energy markets, and shift OPEC and non-OPEC supply dynamics amid economic slowdown.


Key Points

IEA sees first demand drop since 2009 as COVID-19 curbs travel, weakening transport fuels and unsettling energy markets.

✅ IEA base case: 2020 demand at 99.9 mb/d, down 90 kb/d from 2019.

✅ Travel restrictions hit transport fuels; China drives the decline.

✅ Scenarios: low -730 kb/d; high +480 kb/d in 2020.


Global oil demand is expected to decline in 2020 as the impact of the new coronavirus (COVID-19) spreads around the world, constricting travel and broader economic activity, according to the International Energy Agency’s latest oil market forecast.

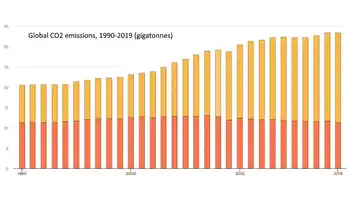
The situation remains fluid, creating an extraordinary degree of uncertainty over what the full global impact of the virus will be. In the IEA’s central base case, even as global CO2 emissions flatlined in 2019 according to the IEA, demand this year drops for the first time since 2009 because of the deep contraction in oil consumption in China, and major disruptions to global travel and trade.

“The coronavirus crisis is affecting a wide range of energy markets – including coal-fired electricity generation, gas and renewables – but its impact on oil markets is particularly severe because it is stopping people and goods from moving around, dealing a heavy blow to demand for transport fuels,” said Dr Fatih Birol, the IEA’s Executive Director. “This is especially true in China, the largest energy consumer in the world, which accounted for more than 80% of global oil demand growth last year. While the repercussions of the virus are spreading to other parts of the world, what happens in China will have major implications for global energy and oil markets.”

The IEA now sees global oil demand at 99.9 million barrels a day in 2020, down around 90,000 barrels a day from 2019. This is a sharp downgrade from the IEA’s forecast in February, which predicted global oil demand would grow by 825,000 barrels a day in 2020.

The short-term outlook for the oil market will ultimately depend on how quickly governments move to contain the coronavirus outbreak, how successful their efforts are, and what lingering impact the global health crisis has on economic activity.

To account for the extreme uncertainty facing energy markets, the IEA has developed two other scenarios for how global oil demand could evolve this year. In a more pessimistic low case, global measures fail to contain the virus, and global demand falls by 730,000 barrels a day in 2020. In a more optimistic high case, the virus is contained quickly around the world, and global demand grows by 480,000 barrels a day.

“We are following the situation extremely closely and will provide regular updates to our forecasts as the picture becomes clearer,” Dr Birol said. “The impact of the coronavirus on oil markets may be temporary. But the longer-term challenges facing the world’s suppliers are not going to go away, especially those heavily dependent on oil and gas revenues. As the IEA has repeatedly said, these producer countries need more dynamic and diversified economies in order to navigate the multiple uncertainties that we see today.”

The IEA also published its medium-term outlook examining the key issues in global demand, supply, refining and trade to 2025, as well as the trajectory of the global energy transition now shaping markets. Following a contraction in 2020 and an expected sharp rebound in 2021, yearly growth in global oil demand is set to slow as consumption of transport fuels grows more slowly and as national net-zero pathways, with Canada needing more electricity to reach net-zero influencing power demand, according to the report. Between 2019 and 2025, global oil demand is expected to grow at an average annual rate of just below 1 million barrels a day. Over the period as whole, demand rises by a total of 5.7 million barrels a day, with China and India accounting for about half of the growth.

At the same time, the world’s oil production capacity is expected to rise by 5.9 million barrels a day, with more than three-quarters of it coming from non-OPEC producers, the report forecasts. But production growth in the United States and other non-OPEC countries is set to lose momentum after 2022, amid shifts in Wall Street's energy strategy linked to policy signals, allowing OPEC producers from the Middle East to turn the taps back up to help keep the global oil market in balance.

The medium-term market report, Oil 2020, also considers the impact of clean energy transitions on oil market trends. Demand growth for gasoline and diesel between 2019 and 2025 is forecast to weaken as countries around the world implement policies to improve efficiency and cut carbon dioxide emissions – and as solar power becomes the cheapest electricity in many markets and electric vehicles increase in popularity. The impact of energy transitions on oil supply remains unclear, with many companies prioritising short-cycle projects for the coming years.

“The coronavirus crisis is adding to the uncertainties the global oil industry faces as it contemplates new investments and business strategies,” Dr Birol said. “The pressures on companies are changing, with European oil majors turning electric to diversify. They need to show that they can deliver not just the energy that economies rely on, but also the emissions reductions that the world needs to help tackle our climate challenge.”


Related News

View more

California Halts Energy Rebate Program Amid Trump Freeze

California energy rebate freeze disrupts heat pump incentives, HVAC upgrades, and climate funding, as federal uncertainty stalls Inflation Reduction Act support, delaying home electrification, energy efficiency gains, and greenhouse gas emissions reductions statewide.


Key Points

A statewide pause on $290M incentives for heat pumps and HVAC upgrades due to federal climate funding uncertainty.

✅ $290M program paused amid federal funding freeze

✅ Heat pump, HVAC, electrification upgrades delayed

✅ Previously approved rebates honored; new apps halted


California’s push for a more energy-efficient future has hit a significant roadblock as the state pauses a $290 million rebate program aimed at helping homeowners replace inefficient heating and cooling systems with more energy-efficient alternatives. The California Energy Commission announced the suspension of the program, citing uncertainty stemming from President Donald Trump’s decision to freeze funding for various climate-related initiatives.

The Halted Program

The energy rebate program, which utilizes federal funding to encourage the use of energy-efficient appliances such as heat pumps, was a crucial part of California’s efforts to reduce energy consumption and greenhouse gas emissions. By providing financial incentives for homeowners to upgrade to more efficient heating and cooling systems, the program aimed to make green energy solutions more accessible and affordable to residents. The rebate program had been popular, with many homeowners eager to participate in the initiative to lower their energy costs and improve the sustainability of their homes.

However, due to the uncertainty surrounding federal funding, the California Energy Commission announced on Monday that it would no longer be accepting new applications for the program. The agency did clarify that it would continue to honor rebates for applications that had already been approved. The pause will remain in effect until the Trump administration provides more clarity regarding the program's future funding.

The Trump Administration’s Role

This move highlights a broader issue regarding access to federal funding for state-level energy programs. The Trump administration’s decision to freeze funding for climate-related initiatives has left many states in limbo, as previously approved federal money has not been distributed as expected. Despite federal court rulings directing the Trump administration to restore these funds, states like California are still struggling to navigate the uncertainty of climate-related financial support from the federal government.

California’s decision to pause the rebate program comes after similar actions by other states. Arizona paused a similar program just a week prior, and Rhode Island had already paused new applications earlier this year. These states are all recipients of funding from a larger $4.3 billion initiative under the Inflation Reduction Act, which is designed to help homeowners purchase energy-efficient appliances like heat pumps, water heaters, and electric cooktops.

Impact of the Freeze

The pause of California's rebate program has serious implications for both consumers and the state’s energy goals. For residents, the halt means delays in the ability to upgrade to more energy-efficient home systems, which could lead to higher energy costs in the short term, a concern amid soaring electricity prices across the state.

The $290 million program was a significant step in encouraging homeowners to invest in energy efficiency, and its suspension leaves a gap in the availability of resources for those who were hoping to make energy-saving upgrades. Many of these upgrades are not just beneficial to homeowners, but they also contribute to the state’s overall energy efficiency goals, helping to reduce reliance on non-renewable energy sources, even as California's dependence on fossil fuels persists, and decrease greenhouse gas emissions.

Federal and State Tensions

The freeze in funding is just one of many points of tension between the Trump administration and states like California, which have pursued aggressive environmental policies aimed at reducing emissions and combating climate change. California has often found itself at odds with the federal government on environmental issues, especially under the leadership of President Trump. The state’s ambitious environmental policies have sometimes clashed with the federal government's approach, including efforts to wind down its fossil fuel industry in line with climate goals.

In this case, the freeze on climate-related funding appears to be part of a broader strategy by the Trump administration to limit federal spending on environmental programs, and as regulators weigh whether the state may need more power plants, planning remains complex. While the freeze impacts states that are working to transition to clean energy, critics argue that such moves undermine efforts to tackle climate change and could slow down progress toward a greener future.

The Path Forward

For California, the next steps will depend heavily on the actions of the federal government. While the state can continue to push for climate funding in the courts, the lack of clarity around the release of federal funds creates uncertainty for state programs that rely on these resources. As California continues to navigate this funding freeze, it will need to explore alternative solutions to keep its energy efficiency programs on track, such as efforts to revamp electricity rates to clean the grid, even in the face of federal challenges.

In the meantime, California residents and homeowners who were hoping to take advantage of the rebate program may have to wait until further clarification from the federal government is provided, even as officials warn of a looming electricity shortage in coming years. Whether the program can be restored or expanded in the future remains to be seen, but for now, the pause serves as a reminder of the ongoing struggles that states face when dealing with shifting federal priorities.

As the issue unfolds, other states facing similar challenges may take cues from California’s actions, and with California exporting energy policies to Western states, broader conversations about how federal and state governments can collaborate to ensure that energy efficiency initiatives and climate goals are not sidelined due to political or budgetary differences.

California’s decision to pause its $290 million energy rebate program is a significant development in the ongoing struggle between state and federal governments over climate-related funding. The uncertainty created by the Trump administration’s freeze on energy efficiency programs has led to disruptions in state-level efforts to promote sustainability and reduce emissions. As the situation continues to evolve, both California and other states will need to consider how to move forward without relying on federal funding that may or may not be available in the future.


Related News

View more

Sign Up for Electricity Forum’s Newsletter

Stay informed with our FREE Newsletter — get the latest news, breakthrough technologies, and expert insights, delivered straight to your inbox.

Electricity Today T&D Magazine Subscribe for FREE

Stay informed with the latest T&D policies and technologies.
  • Timely insights from industry experts
  • Practical solutions T&D engineers
  • Free access to every issue

Live Online & In-person Group Training

Advantages To Instructor-Led Training – Instructor-Led Course, Customized Training, Multiple Locations, Economical, CEU Credits, Course Discounts.

Request For Quotation

Whether you would prefer Live Online or In-Person instruction, our electrical training courses can be tailored to meet your company's specific requirements and delivered to your employees in one location or at various locations.