EPA Telework Policy restricts remote work, balancing work-from-home guidance during the COVID-19 pandemic with flexible schedules, union contracts, OMB guidance, and federal workforce rules, impacting managers, SES staff, and non-bargaining employees nationwide.
Key Points
A directive limiting many EPA staff to two telework days weekly, with pandemic exceptions and flexible schedules.
✅ Limits telework to two days per week for many employees
✅ Allows flexible schedules, including maxiflex, during emergencies
✅ Aligns with OMB, OPM, CDC guidance; honors union agreements
EPA has moved forward on a new policy that would restrict telework even as agency leadership has encouraged staff to work from home during the coronavirus outbreak.
The new EPA order obtained by E&E News would require employees to report to the office at least three days every week.
"Full-time employees are expected to report to the official worksite and duty station a minimum of three (3) days per week," says the order, dated as approved on Feb. 27. It went into effect March 15 — that night, EPA Administrator Andrew Wheeler authorized telework for the entire agency due to the pandemic.
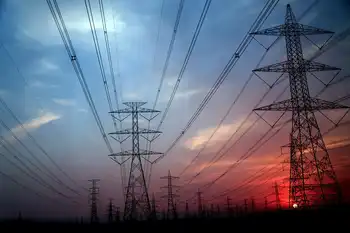
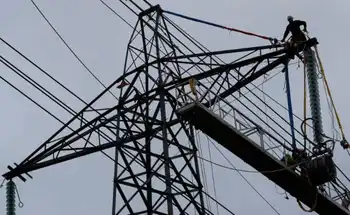
The order focuses on EPA employees' work schedules and gives them new flexibilities that could come in handy during a public health emergency like the COVID-19 virus, when parts of the power sector consider on-site staffing to ensure continuity.
It also stipulates a deep reduction in EPA employees' capability to work remotely, leaving them with two days of telework per week. An agency order on telework, issued in January 2016, said staff could telework full time.
"The EPA supports the use of telework," said that order. "Regular telework may range from one day per pay period up to full time."
An EPA spokeswoman said the new order doesn't change the agency's guidance to staff to work from home during the pandemic.
"The health and safety of our employees is our top priority, and that is why we have requested that all employees telework, even as residential electricity use increases with more people at home, until at least April 3. There is no provision in the work schedules policy, telework policy or collective bargaining agreement that limits this request," said the spokeswoman.
"While EPA did implement the national work schedule policy effective 3/15/2020, it was implemented in order to provide increased work schedule flexibilities for non-bargaining unit employees who were not previously afforded flexible schedules, including maxiflex," she added.
"The implementation of the policy does not currently impact telework opportunities for EPA employees, and EPA has strongly encouraged all staff to telework," she said.
Still, the new order has caused consternation among EPA employees.
One EPA manager described it as another move by the Trump administration to restrict telework across the government.
"Amidst the COVID-19 crisis, this policy seems particularly ill-timed and unwise. It doesn't even give the administration the chance to evaluate the situation once the COVID-19 pandemic passes," said the manager.
"I think this is a dramatic change in the flexibilities available to the EPA employees without any data to support such a drastic move," the manager said. "It has huge ramifications for employees, many of whom commute over an hour each way to the office, increasing air pollution in the process."
Another EPA staffer said, "I honestly think such an order, given current circumstances, would elicit little more than a scoff and a smirk."
The person added, "How tone-deaf and heavy-handed can one administration be?"
Inside EPA first reported on the new order. E&E News obtained the memo independently.
The recently issued policy applies only to non-bargaining-unit employees, including "full-time and part-time" agency staff as well as "supervisors and managers in the competitive, excepted, Senior Level, Scientific and Professional, and Senior Executive Service positions."
In addition, the order covers "Public Health Service Officers, Schedule C, Administratively Determined employees and non-EPA employees serving on Intergovernmental Personnel Act assignments to EPA."
Nevertheless, EPA employees covered under union contracts must adhere to those contracts if the policy runs counter to them.
"If provisions of this order conflict with the provisions of a collective bargaining agreement, the provisions of the agreement must be applied," the order says.
EPA has taken a more restrictive approach with the agency's largest union, American Federation of Government Employees Council 238, which represents about 7,500 EPA employees. EPA imposed a contract on the council's bargaining unit employees last July that limited them to one day of telework per week, among other changes that triggered union protests.
EPA and AFGE have since relaunched contract negotiations, and how to handle telework is one of the issues under discussion. Both sides committed to complete those bargaining talks by April 15 and work with the Federal Service Impasses Panel if needed (Greenwire, Feb. 27).
Both sides of the telework debate
EPA's new order has been under consideration for some time.
E&E News obtained a draft version last year. The agency had circulated it for comment in July, noting the proposal "limits the number of days an employee may telework per week," among other changes (Greenwire, Sept. 12, 2019).
EPA, like other federal agencies under the Trump administration, has sought to reduce employees' telework. That effort, though, has run into the headwinds of a global pandemic, with a U.S. grid warning highlighting broader risks, leading agency leaders to reverse course and now encourage staff to work remotely in order to stop the spread of the COVID-19 virus.
Wheeler in an email last week told staff that he authorized telework for employees across the country. Federal worker unions had sought the opportunity for remote work on behalf of EPA employees, and the agency had already relaxed telework policies at various offices the prior week where the coronavirus had begun to take hold.
The EPA spokeswoman said the agency moved toward telework after guidance from other agencies.
"Consistent with [Office of Management and Budget], [Centers for Disease Control and Prevention] and [Office of Personnel Management] guidance, along with state and local directives, we have taken swift action in regions and at headquarters to implement telework for all employees. We continue to tell all employees to telework," said the spokeswoman.
Wheeler said in a later video message that his expectation was most EPA employees were working from home.
"I understand that this is a difficult and scary time for all of us," said the EPA administrator.
The coronavirus has become a real challenge for EPA, and utilities like BC Hydro Site C updates illustrate broader operational adjustments.
Agency staff have been exposed to the virus while some have tested positive, and nuclear plant workers have raised similar concerns, according to internal emails. That has led to employees self-quarantining while their colleagues worry they may next fall ill (Greenwire, March 20).
One employee said that since EPA's operations have been maintained with staff working from home, even as household electricity bills rise for many, it's harder for the Trump administration to justify restricting remote work.
"With the current climate, I think employees have shown we can keep the agency going with nearly 95% teleworking full time. It makes their argument hard to justify in light of things," said the EPA employee.
The Trump administration overall has pushed for more remote work by the federal workforce in the battle with the COVID-19 virus. The Office of Management and Budget issued guidance to agencies last week "to minimize face-to-face interactions" and "maximize telework across the nation."
Lawmakers have also pushed to expand telework for federal workers due to the virus.
Democratic senators sent a letter last week urging President Trump to issue an executive order directing agencies to use telework.
In addition, Sens. James Lankford (R-Okla.), Chris Van Hollen (D-Md.) and Kyrsten Sinema (D-Ariz.) introduced legislation that would allow federal employees to telework full time during the pandemic.
Some worry EPA's new order could further sour morale at the agency after the pandemic passes, as other utilities consider measures like unpaid days off to trim costs. Employees may leave if they can't work from home more.
"People will quit EPA over something like this. Maybe that's the goal," said the EPA manager.
Related News