SCE signs on for more than 900 MWs of wind energy

By Business Wire


NFPA 70e Training

Our customized live online or in‑person group training can be delivered to your staff at your location.

  • Live Online
  • 6 hours Instructor-led
  • Group Training Available
Regular Price:
$199
Coupon Price:
$149
Reserve Your Seat Today
Southern California Edison (SCE) signed a 20-year contract with DCE, an affiliate of Caithness Energy, which will provide up to 909 megawatts of wind power. Developers say that once completed, the Caithness project will be one of the worldÂ’s largest fully permitted wind farms.

The project, called Caithness ShepherdÂ’s Flat, involves the installation of 303 wind turbines across 30 square miles in Gilliam and Morrow Counties in North-Central Oregon between 2011 and 2012. ShepherdÂ’s Flat is expected to generate 2 billion kilowatt-hours per year of renewable energy, which is more than one-tenth of SCEÂ’s overall renewable portfolio.

“This contract is a crown jewel in our renewable energy portfolio,” said Stuart Hemphill, SCE vice president, Renewable and Alternative Power. “The project is attractive to SCE because of its size, near-term delivery and its competitive price.”

The project will benefit SCE customers because it requires no additional or upgraded transmission lines, which significantly lessens the time it takes for a power plant of this magnitude to come on line.

“Caithness has been successfully partnering with Southern California Edison since the 1980s to bring renewable energy to the region,” said Les Gelber, president and chief operating officer of Caithness Energy. “The Shepherd’s Flat project is particularly exciting and will bring a significant new renewable energy supply to the western United States.”

SCE leads the nation in renewable energy delivery, procuring about 12.5 billion kilowatt-hours of renewable energy in 2007, more than any U.S. utility. In 2007, renewable energy constituted about 16 percent of SCEÂ’s total energy portfolio. SCE currently has sufficient contracts in place that, when delivering, will meet or exceed 20 percent or more of its customersÂ’ energy needs with renewable energy.

Related News

The crisis in numbers: How COVID-19 has reshaped Saskatchewan

Saskatchewan COVID-19 economic impact: real-time data shows drops in electricity demand, oil well licensing, traffic and tickets, plus spikes in internet usage, government site visits, remote work, and alcohol wholesale volumes.


Key Points

COVID-19 reduced energy use, drilling and traffic, while pushing activity online; jobs, rents and sales show strain.

✅ Electricity demand down 6.7%; residential usage up

✅ Oil well license applications fell 15-fold in April

✅ Internet traffic up 16%-46%; wireless LTE up 34%


We’re only just beginning to grasp how COVID-19 has upended Saskatchewan’s economy, its government and all of our lives.

The numbers that usually make headlines — job losses, economic contraction, bankruptcies — are still well behind the pace of the virus and its toll.

But other numbers change more quickly. Saskatchewan people are using less power, and the power industry is adopting on-site staffing plans to ensure reliability as conditions evolve. We’re racking up fewer speeding tickets. And as new restrictions come, we’re clicking onto Saskatchewan.ca as much as 10,000 times per minute.

Here’s some data that provides a first glimpse into how much our province has changed in just six weeks.

Electricity use tends to rise and fall in tandem with the health of the economy, and the most recent data from SaskPower suggests businesses are powering down, while regional utilities such as Manitoba Hydro seek unpaid days off to trim costs.

Peak load requirements between March 15 and April 26 were 220 MW lower than during the same period in 2019, and elsewhere BC Hydro is posting COVID-19 updates at Site C as it manages project impacts. That’s a decrease of 6.7 per cent, with total load on April 29 at 2,551 MW. A megawatt is enough electricity to power about 1,000 homes.

Separate from pandemic impacts, an external investigation at Manitoba Hydro has drawn attention to workplace conduct issues.

But it’s not homes that are turning off the lights. SaskPower spokesman Joel Cherry said commercial and industrial usage is down, while residential demand is up, with household electricity bills rising as more people stay home.

The timing of power demand has also shifted, a pattern seen as residential electricity use rises during work-from-home routines. Peak load would usually come around 8 or 9 p.m. in April. Now it’s coming earlier, typically between 5 and 6 p.m.

Oil well applications fall 15-fold
Oil prices have cratered since late February, and producers in Saskatchewan have reacted by pulling back on drilling plans, while neighbouring Alberta provides transition support for coal workers amid broader energy shifts.

Applications for well licences fell from 242 in January to 203 in February (including nine potash and one helium operations), before dropping to 84 in March. April, the month benchmark oil prices went negative for one day, producers submitted just 15 applications.

That’s 15 times fewer than the 231 applications the Ministry of Energy and Resources received in April 2019.

Well licences are needed for drilling, operating, injecting, producing or exploring an oil and gas or potash well in the province.

There has been no clear trend in well abandonment, however. There were 176 applications for abandonment in March and 155 in April, roughly in line with figures from the year before.

SGI spokesman Tyler McMurchy believes the lower numbers might stem from a combination of lower traffic volumes during part of the month, possibly combined with a shift in police priorities. The March 2020 numbers are also well below January and February figures.

Indeed, the Ministry of Highways and infrastructure reported a 16 per cent decrease in average daily traffic last month compared to March 2019, through its traffic counts at 11 different spots on highways across the province.

In Regina, traffic counts at 16 locations dropped from a high of 2.1 million in the first week of March to a low of 1.3 million during the week of March 22. That’s a 44 per cent decrease.

Counts have gradually recovered to 1.6 million in the weeks since. The data was fairly consistent at all 16 spots, which are largely major intersections, though the city cautioned they may not be representative of Regina as a whole.

Tickets for cellphone use while driving also fell, dropping from 562 in February to 314 in March. McMurchy noted that distracted driving numbers in general have been falling since November as stiffer penalties were announced. Impaired driving tickets were up, by contrast, but still within a typical range.

Internet traffic shoots up 16 per cent, far more for rural high speed
You may be spending a lot more time on Netflix and Facebook in the age of social distancing, and SaskTel has noticed.

From late February to late April, SaskTel has seen “very significant increases in provincial data traffic.” DSL and fibre optic networks have handled a 16 per cent increase in traffic, while demand on the wireless LTE network is up 34 per cent.

Usage on the Fusion network up 46 per cent. That network serves rural areas that don’t have access to other high-speed options.

The specific reference dates for comparison were February 24 and April 27.

“We attribute these changes in data usage to the pandemic and not expected seasonal or yearly shifts in usage patterns,” said spokesman Greg Jacobs.

Saskatchewan.ca was attracting just 70 page views per minute on average in February. But page views jumped over 10,000 per minute at 2:38 p.m. on March 18, as Moe was still announcing the new measures.

That’s a 14,000 per cent increase.

For all of March, visitor sessions on the site clocked in at 3,905,061, almost four times the 944,904 recorded for February.

Bureaucracy has increasingly migrated to cyberspace, with 62 per cent of civil servants now working from home. Government Skype calls, both audio and video, have tripled from 12,000 sessions per day to 35,000.Telephone conference calls increased by a factor of 14 from the first week of February to the second full week of April, with 25 times more weekly call participants. 

The Ministry of Central Services reported a 17 per cent jump in emails received by government over the past two months, excluding the Ministry of Health.

But as civil servants spend more time on their computers, the government’s fleet is spending a lot less time on the road. The ministry has purchased 40 per cent fewer litres of fuel for its vehicles over the past four weeks, compared to the same time last year.

Alcohol wholesale volumes up 22 per cent, then fall back to normal
Retailers bought more alcohol from the Saskatchewan Liquor and Gaming Authority (SLGA) last month, just as the government began tightening pandemic restrictions.

Wholesale sales volumes were up 22 per cent over March 15 to 28, compared to the same period in 2019. SLGA spokesman David Morris said the additional demand “was likely the result of retailers stocking-up as restrictions related to COVID-19 took effect.”

But the jump didn’t last. Wholesale volumes were back to normal for the first two weeks of April. SLGA did notice a very slight uptick last week, however, with volumes out of its distribution centre up three per cent. The numbers do not include Brewer’s Distributors Ltd.

It’s unclear how much more alcohol consumers actually purchased, since province-wide retail numbers were not available.

There was no discernible trend in March for anti-anxiety medication, however. The number of prescriptions filled for benzodiazepines like Valium, Xanax and Ativan see-sawed over March, according to data provided by the College of Physicians and Surgeons, but its associate registrar does not believe the trends are statistically relevant.

One-fifth of tenants miss April rent
About 20 per cent of residential rent went totally unpaid in the first six days of April, according to the Saskatchewan Landlord Association (SLA).

The precise number is 19.7 per cent, but there’s some uncertainty due to the survey method, which is based on responses from 300 residential landlords with 14,000 units. An additional 12 per cent of tenants paid a portion of their rent, but not the full amount. The figures do not include social housing.

Cameron Choquette, the association’s executive officer, partly blames the province’s decision to suspend most landlord tenant board hearings for evictions, saying it “allows more people to take advantage of landlords by not paying their rent and not facing any consequences.”

The government has defended the suspension by saying it’s needed to ensure everyone has a safe place to self-isolate if needed during the pandemic.

March’s jobs numbers were bad, with almost 21,000 fewer Saskatchewan people employed compared to February.

April’s labour force survey is expected on Friday. But new April numbers released Wednesday show that two-thirds of the province’s businesses managed to avoid laying off staff almost entirely.

According to Statistics Canada, 66.2 per cent of businesses reported laying off between zero and one per cent of their employees due to COVID-19. That was better than any other province. Just 7.6 per cent laid off all of their employees, again the best number outside the territories. The survey period was April 3 to 24.

Some businesses are even hiring. Walmart, for instance, has hired 300 people in Saskatchewan since mid-March.

Trade and Export Development Minister Jeremy Harrison chalked the data up to a relatively more optimistic business outlook in Saskatchewan, combined with “very targeted” restrictions and a support program for small and medium businesses.

That support program, which provides $5,000 grants to qualifying businesses affected by government restrictions, has only been around for three weeks. But it’s already been bombarded with 6,317 applications.

The total value of those applications would be $24,178,000, according to Harrison. Of them, 3,586 have been approved with a value of $11,755,000.

Businesses are coming to Harrison’s ministry with thousands of questions. Since it opened in March, the Business Response Team has received 4,125 calls and 1,758 emails.

The kinds of questions have changed over the course of the pandemic. Many are now asking when they can open their doors, according to Harrison, as they wonder about “grey areas” in the Re-Open Saskatchewan plan.


Related News

View more

As California enters a brave new energy world, can it keep the lights on?

California Grid Transition drives decarbonization with renewable energy, EV charging, microgrids, and energy storage, while tackling wildfire risk, aging infrastructure, and cybersecurity threats to build grid resilience and reliability across a rapidly electrifying economy.


Key Points

California Grid Transition is the statewide shift to renewables, storage, EVs, and resilient, secure infrastructure.

✅ Integrates solar, wind, storage, and demand response at scale

✅ Expands microgrids and DERs to enhance reliability and resilience

✅ Addresses wildfire, aging assets, and cybersecurity risks


Gretchen Bakke thinks a lot about power—the kind that sizzles through a complex grid of electrical stations, poles, lines and transformers, keeping the lights on for tens of millions of Californians who mostly take it for granted.

They shouldn’t, says Bakke, who grew up in a rural California town regularly darkened by outages. A cultural anthropologist who studies the consequences of institutional failures, she says it’s unclear whether the state’s aging electricity network and its managers can handle what’s about to hit it, as U.S. blackout risks continue to mount.

California is casting off fossil fuels to become something that doesn’t yet exist: a fully electrified state of 40 million people. Policies are in place requiring a rush of energy from renewable sources such as the sun and wind and calling for millions of electric cars that will need charging—changes that will tax a system already fragile, unstable and increasingly vulnerable to outside forces.

“There is so much happening, so fast—the grid and nearly everything about energy is in real transition, and there’s so much at stake,” said Bakke, who explores these issues in a book titled simply, “The Grid.”

The state’s task grew more complicated with this week’s announcement that Pacific Gas and Electric, which provides electricity for more than 5 million customer accounts, intends to file for bankruptcy in the face of potentially crippling liabilities from wildfires. But the reshaping of California’s energy future goes far beyond the woes of a single company.

The 19th-century model of one-way power delivery from utility companies to customers is being reimagined. Major utilities—and the grid itself—are being disrupted by rooftops paved with solar panels and the rise of self-sufficient neighborhood mini-grids. Whole cities and counties are abandoning big utilities and buying power from wholesalers and others of their choosing.

With California at the forefront of a new energy landscape, officials are racing to design a future that will not just reshape power production and delivery but also dictate how we get around and how our goods are made. They’re debating how to manage grid defectors, weighing the feasibility of an energy network that would expand to connect and serve much of the West and pondering how to appropriately regulate small power producers.

“We are in the depths of the conversation,” said Michael Picker, president of the state Public Utilities Commission, who cautions that even as the system is being rebooted, like repairing a car while driving in practice, there’s no real plan for making it all work.

Such transformation is exceedingly risky and potentially costly. California still bears the scars of having dropped its regulatory reins some 20 years ago, leaving power companies to bilk the state of billions of dollars it has yet to completely recover. And utility companies will undoubtedly pass on to their customers the costs of grid upgrades to defend against natural and man-made threats.

Some weaknesses are well known—rodents and tree limbs, for example, are common culprits in power outages, even as longer, more frequent outages afflict other parts of the U.S. A gnawing squirrel squeezed into a transformer on Thanksgiving Day three years ago, shutting off power to parts of Los Angeles International Airport. The airport plans to spend $120 million to upgrade its power plant.

But the harsh effects of climate change expose new vulnerabilities. Rising seas imperil coastal power plants. Electricity infrastructure is both threatened by and implicated in wildfires. Picker estimates that utility operations are related to one in 10 wildland fires in California, which can be sparked by aging equipment and winds that send tree branches crashing into power lines, showering flammable landscapes with sparks.

California utilities have been ordered to make their lines and equipment more fire-resistant as they’re increasingly held accountable for blazes they cause. Pacific Gas and Electric reported problems with some of its equipment at a starting point of California’s deadliest wildfire, which killed at least 86 people in November in the town of Paradise. The cause of the fire is under investigation.

New and complex cyber threats are more difficult to anticipate and even more dangerous. Computer hackers, operating a world away, can—and have—shut down electricity systems, toggling power on and off at will, and even hijacked the computers of special teams dispatched to restore control.

Thomas Fanning, CEO of Southern Co., one of the country’s largest utilities, recently disclosed that his teams have fended off multiple attempts to hack a nuclear power plant the firm operates. He called grid hacking “the most important under-reported war in American history.”

However, if you’ve got what seems like an insoluble problem requiring a to-the-studs teardown and innovative rebuild, California is a good place to start. After all, the first electricity grid was built in San Francisco in 1879, three years before Thomas Edison’s power station in New York City. (Edison’s plant burned to the ground a decade later.)

California’s energy-efficiency regulations have helped reduce statewide energy use, which peaked a decade ago and is on the decline, somewhat easing pressure on the grid. The major utilities are ahead of schedule in meeting their obligation to obtain power from renewable sources.

California’s universities are teaming with national research labs to develop cutting-edge solutions for storing energy produced by clean sources. California is fortunate in the diversity of its energy choices: hydroelectric dams in the north, large-scale solar operations in the Mojave Desert to the east, sprawling windmill farms in mountain passes and heat bubbling in the Geysers, the world’s largest geothermal field north of San Francisco. A single nuclear-power plant clings to the coast near San Luis Obispo, but it will be shuttered in 2025.

But more renewable energy, accessible at the whims of weather, can throw the grid off balance. Renewables lack the characteristic that power planners most prize: dispatchability, ready when called on and turned off when not immediately needed. Wind and sun don’t behave that way; their power is often available in great hunks—or not at all, as when clouds cover solar panels or winds drop.

In the case of solar power, it is plentiful in the middle of the day, at a time of low demand. There’s so much in California that most days the state pays its neighbors to siphon some off,  lest the excess impede the grid’s constant need for balance—for a supply that consistently equals demand.

So getting to California’s new goals of operating on 100 percent clean energy by 2045 and having 5 million electric vehicles within 12 years will require a shift in how power is acquired and managed. Consumers will rely more heavily on battery storage, whose efficiency must improve to meet that demand.


Related News

View more

Climate change: Greenhouse gas concentrations again break records

Rising Greenhouse Gas Concentrations drive climate change, with CO2, methane, and nitrous oxide surging; WMO data show higher radiative forcing, elevated pre-industrial baselines, and persistent atmospheric concentrations despite Paris Agreement emissions pledges.


Key Points

Increasing atmospheric CO2, methane, and nitrous oxide levels that raise radiative forcing and drive warming.

✅ WMO data show CO2 at 407.8 ppm in 2018, above decade average

✅ Methane and nitrous oxide surged, elevating total radiative forcing

✅ Concentrations differ from emissions; sinks absorb about half


The World Meteorological Organization (WMO) says the increase in CO2 was just above the average rise recorded over the last decade.

Levels of other warming gases, such as methane and nitrous oxide, have also surged by above average amounts.

Since 1990 there's been an increase of 43% in the warming effect on the climate of long lived greenhouse gases.

The WMO report looks at concentrations of warming gases in the atmosphere rather than just emissions.

The difference between the two is that emissions refer to the amount of gases that go up into the atmosphere from the use of fossil fuels, such as burning coal for coal-fired electricity generation and from deforestation.

Concentrations are what's left in the air after a complex series of interactions between the atmosphere, the oceans, the forests and the land. About a quarter of all carbon emissions are absorbed by the seas, and a similar amount by land and trees, while technologies like carbon capture are being explored to remove CO2.

Using data from monitoring stations in the Arctic and all over the world, researchers say that in 2018 concentrations of CO2 reached 407.8 parts per million (ppm), up from 405.5ppm a year previously.

This increase was above the average for the last 10 years and is 147% of the "pre-industrial" level in 1750.

The WMO also records concentrations of other warming gases, including methane and nitrous oxide, and some countries have reported declines in certain potent gases, as noted in US greenhouse gas controls reports, though global levels remain elevated. About 40% of the methane emitted into the air comes from natural sources, such as wetlands, with 60% from human activities, including cattle farming, rice cultivation and landfill dumps.

Methane is now at 259% of the pre-industrial level and the increase seen over the past year was higher than both the previous annual rate and the average over the past 10 years.

Nitrous oxide is emitted from natural and human sources, including from the oceans and from fertiliser-use in farming. According to the WMO, it is now at 123% of the levels that existed in 1750.

Last year's increase in concentrations of the gas, which can also harm the ozone layer, was bigger than the previous 12 months and higher than the average of the past decade.

What concerns scientists is the overall warming impact of all these increasing concentrations. Known as total radiative forcing, this effect has increased by 43% since 1990, and is not showing any indication of stopping.

There is no sign of a slowdown, let alone a decline, in greenhouse gases concentration in the atmosphere despite all the commitments under the Paris agreement on climate change and the ongoing global energy transition efforts," said WMO Secretary-General Petteri Taalas.

"We need to translate the commitments into action and increase the level of ambition for the sake of the future welfare of mankind," he added.

"It is worth recalling that the last time the Earth experienced a comparable concentration of CO2 was three to five million years ago. Back then, the temperature was 2-3C warmer, sea level was 10-20m higher than now," said Mr Taalas.

The UN Environment Programme will report shortly on the gap between what actions countries are taking to cut carbon, for example where Australia's emissions rose 2% recently, and what needs to be done to keep under the temperature targets agreed in the Paris climate pact.

Preliminary findings from this study, published during the UN Secretary General's special climate summit last September, indicated that emissions continued to rise during 2018, although global emissions flatlined in 2019 according to the IEA.

Both reports will help inform delegates from almost 200 countries who will meet in Madrid next week for COP25, following COP24 in Katowice the previous year, the annual round of international climate talks.


Related News

View more

Energy dashboard: how is electricity generated in Great Britain?

Great Britain electricity generation spans renewables and baseload: wind, solar, nuclear, gas, and biomass, supported by National Grid interconnectors, embedded energy estimates, and BMRS data for dynamic imports and exports across Europe.


Key Points

A diverse, weather-driven mix of renewables, gas, nuclear, and imports coordinated by National Grid.

✅ Baseload from nuclear and biomass; intermittent wind and solar

✅ Interconnectors trade zero carbon imports via subsea cables

✅ Data from BMRS and ESO covers embedded energy estimates


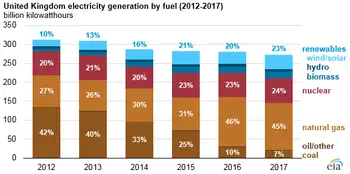
Great Britain has one of the most diverse ranges of electricity generation in Europe, with everything from windfarms off the coast of Scotland to a nuclear power station in Suffolk tasked with keeping the lights on. The increasing reliance on renewable energy sources, as part of the country’s green ambitions, also means there can be rapid shifts in the main source of electricity generation. On windy days, most electricity generation comes from record wind generation across onshore and offshore windfarms. When conditions are cold and still, gas-fired power stations known as peaking plants are called into action.

The electricity system in Great Britain relies on a combination of “baseload” power – from stable generators such as nuclear and biomass plants – and “intermittent” sources, such as wind and solar farms that need the right weather conditions to feed energy into the grid. National Grid also imports energy from overseas, through subsea cables known as interconnectors that link to France, Belgium, Norway and the Netherlands. They allow companies to trade excess power, such as renewable energy created by the sun, wind and water, between different countries. By 2030 it is hoped that 90% of the energy imported by interconnectors will be from zero carbon energy sources, though low-carbon electricity generation stalled in 2019 for the UK.

The technology behind Great Britain’s power generation has evolved significantly over the last century, and at times wind has been the main source of electricity. The first integrated national grid in the world was formed in 1935 linking seven regions of the UK. In the aftermath of industrialisation, coal provided the vast majority of power, before oil began to play an increasingly important part in the 1950s. In 1956, the world’s first commercial nuclear reactor, Calder Hall 1 at Windscale (later Sellafield), was opened by Queen Elizabeth II. Coal use fell significantly in the 1990s while the use of combined cycle gas turbines grew, and in 2016 wind generated more electricity than coal for the first time. Now a combination of gas, wind, nuclear and biomass provide the bulk of Great Britain’s energy, with smaller sources such as solar and hydroelectric power also used. From October 2024, coal will no longer be used to generate electricity, following coal-free power records set in recent years.

Energy generation data is fetched from the Balancing Mechanism Reporting Service public feed, provided by Elexon – which runs the wholesale energy market – and is updated every five minutes, covering periods when wind led the power mix as well.

Elexon’s data does not include embedded energy, which is unmetered and therefore invisible to Great Britain’s National Grid. Embedded energy comprises all solar energy and wind energy generated from non-metered turbines. To account for these figures we use embedded energy estimates from the National Grid electricity system operator, which are published every 30 minutes.

Import figures refer to the net flow of electricity from the interconnectors with Europe and with Northern Ireland. A positive value represents import into the GB transmission system, while a negative value represents an export.

Hydro figures combine renewable run-of-the-river hydropower and pumped storage.

Biomass figures include Elexon’s “other” category, which comprises coal-to-biomass conversions and biomass combined heat and power plants.


Related News

View more

TransAlta Poised to Finalize Alberta Data Centre Agreement in 2025 

TransAlta Alberta Data Centre integrates AI, cloud computing, and renewable energy, tackling electricity demand, grid capacity, decarbonization, and energy storage with clean power, cooling efficiency, and PPA-backed supply for hyperscale workloads.


Key Points

TransAlta Alberta Data Centre is a planned AI facility powered mostly by renewables to meet high electricity demand.

✅ Targets partner exclusivity mid-year; ops 18-24 months post-contract.

✅ Supplies ~90% power via TransAlta; balance from market.

✅ Anchors $3.5B clean energy growth and storage in Alberta.


TransAlta Corp., one of Alberta’s leading power producers, is moving toward finalizing agreements with partners to establish a data centre in the province, aligned with AI data center grid integration efforts nationally, aiming to have definitive contracts signed before the end of the year.

CEO John Kousinioris stated during an analyst conference that the company seeks to secure exclusivity with key partners by mid-year, with detailed design plans and final agreements expected by late 2025. Once the contracts are signed, the data centre is anticipated to be operational within 18 to 24 months, a horizon mirrored by Medicine Hat AI grid upgrades initiatives that aim to modernize local systems.

Data centres, which are critical for high-tech industries such as artificial intelligence, consume large amounts of electricity to run and cool servers, a trend reflected in U.S. utility power challenges reporting, underscoring the scale of energy demand. In this context, TransAlta plans to supply around 90% of its partner's energy needs for the facility, with the remainder coming from the broader electricity market.

Alberta has identified data centres as a strategic priority, aiming to see $100 billion in AI-related data centre construction over the next five years. However, the rapid growth of this sector presents challenges for the region’s energy infrastructure. Electricity demand from data centres has already outpaced the available capacity in Alberta’s power grid, intensifying discussions about a western Canadian electricity grid to improve regional reliability, potentially impacting the province’s decarbonization goals.

To address these challenges, TransAlta has adopted a renewable energy investment strategy. The company announced a $3.5 billion growth plan focused primarily on clean electricity generation and storage, as British Columbia's clean energy shift advances across the region, through 2028. By then, more than two-thirds of TransAlta’s earnings are expected to come from renewable power generation, supporting progress toward a net-zero electricity grid by 2050 nationally.

The collaboration between TransAlta and data centre developers represents an opportunity to balance growing energy demand with sustainability goals. By integrating renewable energy generation into data centre operations and broader macrogrid investments, Alberta could move toward a cleaner and more resilient energy future.


Related News

View more

Almost 500-mile-long lightning bolt crossed three US states

Longest Lightning Flash Record confirmed by WMO: a 477.2-mile megaflash spanning Mississippi, Louisiana, and Texas, detected by satellite sensors, highlighting Great Plains supercell storms, lightning safety, and extreme weather monitoring advancements.


Key Points

It is the WMO-verified 477.2-mile megaflash across MS, LA, and TX, detected via satellites.

✅ Spanned 477.2 miles across Mississippi, Louisiana, and Texas

✅ Verified by WMO using space-based lightning detection

✅ Occurs in megaflash-prone regions like the U.S. Great Plains


An almost 500-mile long bolt of lightning that lit up the sky across three US states has set a new world record for longest flash, scientists have confirmed.

The lightning bolt, extended a total of 477.2 miles (768 km) and spread across Mississippi, Louisiana, and Texas.

The previous record was 440.6 miles (709 km) and recorded in Brazil in 2018.

Lightning rarely extends over 10 miles and usually lasts under a second, yet utilities plan for severe weather when building long-distance lines such as the TransWest Express transmission project to enhance reliability.

Another lightning flash recorded in 2020 - in Uruguay and Argentina - has also set a new record for duration at 17.1 seconds. The previous record was 16.7 seconds.

"These are extraordinary records from lightning flash events," Professor Randall Cerveny, the WMO's rapporteur of weather and climate extremes, said.

According to the WMO, both records took place in areas prone to intense storms that produce 'megaflashes', namely the Great Plains region of the United States and the La Plata basin of South America's southern cone, where utilities adapting to climate change is an increasing priority.

Professor Cerveny added that greater extremes are likely to exist and are likely to be recorded in the future thanks to advances in space-based lightning detection technology.

The WMO warned that lightning was a hazard and urged people in both regions and around the world to take caution during storms, which can lead to extensive disruptions like the Tennessee power outages reported after severe weather.

"These extremely large and long-duration lightning events were not isolated but happened during active thunderstorms," lightning specialist Ron Holle said in a WMO statement.

"Any time there is thunder heard, it is time to reach a lightning-safe place".

Previously accepted WMO 'lightning extremes' include a 1975 incident in which 21 people were killed by a single flash of a lightning as they huddled inside a tent in Zimbabwe, and modern events show how dangerous weather can also cut electricity for days, as with the Hong Kong typhoon outages that affected families.

In another incident, 469 people were killed when lightning struck the Egyptian town of Dronka in 1994, causing burning oil to flood the town, and major incidents can also disrupt infrastructure, as seen during the LA power outage following a substation fire.

The WMO notes that the only lightning-safe locations are "substantial" buildings with wiring and plumbing, and dedicated lightning protection training helps reinforce these guidelines, rather than structures such as bus stops or those found at beaches.

Fully enclosed metal-topped vehicles are also considered reliably safe, and regional storm safety tips offer additional guidance.


Related News

View more

Sign Up for Electricity Forum’s Newsletter

Stay informed with our FREE Newsletter — get the latest news, breakthrough technologies, and expert insights, delivered straight to your inbox.

Electricity Today T&D Magazine Subscribe for FREE

Stay informed with the latest T&D policies and technologies.
  • Timely insights from industry experts
  • Practical solutions T&D engineers
  • Free access to every issue

Download the 2025 Electrical Training Catalog

Explore 50+ live, expert-led electrical training courses –

  • Interactive
  • Flexible
  • CEU-cerified