Biden Clean Energy Plan 2035 accelerates carbon-free electricity with renewables, nuclear, hydropower, and biomass, invests $2T in EVs, grid and energy efficiency, and tightens fuel economy standards beyond the Clean Power Plan.
Key Points
A $2T U.S. climate plan for carbon-free power by 2035, boosting renewables, nuclear, EVs, efficiency, and grid upgrades.
✅ Targets a zero-carbon electric grid nationwide by 2035
✅ Includes renewables, nuclear, hydropower, and biomass in standard
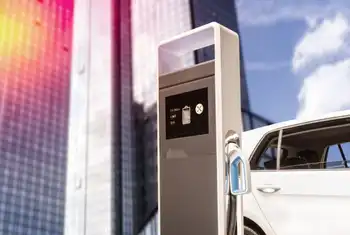
✅ Funds EVs, grid modernization, weatherization, and fuel economy rules
This month the Democratic presumptive presidential nominee, Joe Biden, outlined an ambitious plan, including Biden’s solar plan to expand clean energy, for tackling climate change that shows how far the party has shifted on the issue since it controlled the White House.
President Barack Obama’s Clean Power Plan had called for the electricity sector to cut its carbon pollution 32 percent by 2030, and did not lay out a trajectory for phasing out oil, coal or natural gas production.
This year, Democratic 2020 hopefuls such as Sen. Bernie Sanders (I-Vt.) went much further, suggesting the United States should derive all of its electricity from renewable sources by 2030, moving to 100% renewables as part of a $16.3 trillion plan to wean the nation away from fossil fuels. Many other congressional Democrats have embraced the Green New Deal — the nonbinding resolution calling for a carbon-free power sector by 2030 and more energy efficient buildings and vehicles, along with a massive investment in electric vehicles and high-speed rail.
Last year, 38 percent of U.S. electricity generated came from clean sources, according to a Washington Post analysis of data from the U.S. Energy Information Administration, and in April renewables hit a record 28% nationwide.
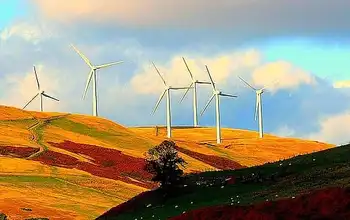
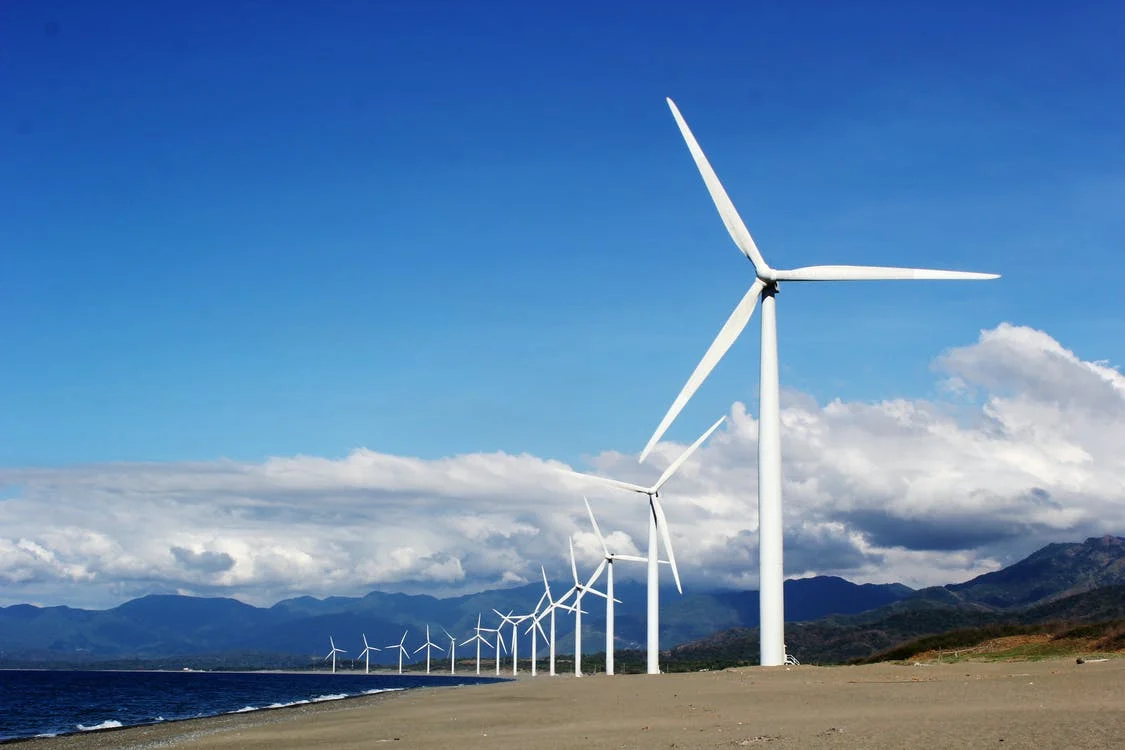
Biden’s new plan, which carries a price tag of $2 trillion, would eliminate carbon emissions from the electric sector by 2035, impose stricter gas mileage standards, fund investments to weatherize millions of homes and commercial buildings, and upgrade the nation’s transportation system. To reach its 2035 carbon-free electricity goal, the campaign includes wind, solar and several forms of energy, acknowledging why the grid isn’t yet 100% renewable while balancing reliability, that are not always counted in state renewable portfolio standards, such as nuclear, hydropower and biomass.
“A great appeal of the Biden proposal is that it is much closer to targeting carbon directly, which is the ultimate enemy, and plays fewer favorites with particular technologies,” said Michael Greenstone, who directs the University of Chicago’s Energy Policy Institute. “This will reduce the costs to consumers and give more carbon bang for the buck.”
But some environmentalists, such as Friends of the Earth President Erich Pica, question the idea of including more controversial carbon-free technologies. “There is no role for nuclear in a least-cost, low carbon world. Including these dinosaurs in a clean energy standard is going to incentivize industry efforts to keep aging, dangerous facilities online,” Pica said in an email.
Hydropower, which relies on a system of moving water that constantly recharges, is defined as renewable by the Environmental Protection Agency. Biomass is often considered as carbon neutral because even though it releases carbon dioxide when it is burned, the plants capture nearly the same amount of CO2 while growing.
Both forms of energy have come under fire for their environmental impacts, however. Damming streams and rivers can destroy fish habitat and make it more difficult for them to spawn, and it also seems unlikely that hydropower will expand its current 6 percent share of the nation’s electrical grid.
Many experts argue that classifying biomass energy as carbon neutral provides an incentive to cut down trees that would otherwise remain standing and sequester carbon. “If burning this wood were good for the climate, then we should not recycle paper, we should burn it,” noted Tim Searchinger, a research scholar at the Princeton School of Public and International Affairs.
Illinois lead the nation in the amount of electricity generated from nuclear power
More than half of the country — 30 states, Washington, and three territories — have adopted a renewable portfolio standard (RPS), according to the National Conference of State Legislatures, and seven states and one territory have set renewable energy goals. While 14 states, along with the District, Puerto Rico and the Virgin Islands, have established requirements of 50 percent or more carbon-free electricity, nearly as many have set theirs at 15 percent or less.
Maine Gov. Janet Mills (D), who has called for 100% renewable electricity in the state, has pushed clean electricity aggressively since taking office in 2019, lifting a wind energy moratorium imposed by her predecessor and signing bills aimed at expanding the state’s carbon-free energy sources. Biomass accounts for a quarter of the state’s electricity, more than any other state.
New York has one of the country’s most ambitious climate targets, which it scaled up last year. It aims to obtain 70 percent of its power from renewable sources within a decade, a period when renewables surpassed coal in U.S. generation, and eliminate carbon altogether by 2040, even as the state is in the process of shutting down a major nuclear plant near New York City, Indian Point, which is slated to cease operating on April 30, 2021.
... while other states are weakening theirs
Last year, Ohio weakened its renewable energy standard from a target of 12.5 percent in 2027 to 8.5 percent by 2026, even as renewables topped coal nationwide for the first time in over a century, without setting any future goals, and jettisoned its energy efficiency standard. West Virginia — which established modest renewable requirements in 2009 — repealed them altogether in 2015, the year they were set to take effect.
Related News