North Korea deal reached

By Reuters


NFPA 70b Training - Electrical Maintenance

Our customized live online or in‑person group training can be delivered to your staff at your location.

  • Live Online
  • 12 hours Instructor-led
  • Group Training Available
Regular Price:
$599
Coupon Price:
$499
Reserve Your Seat Today
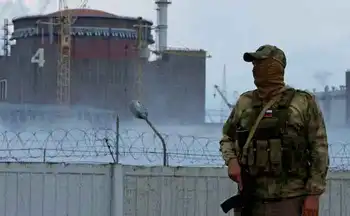
Negotiators from six nations have announced a tentative – and fragile – agreement that could begin the nuclear disarmament of the isolated and secretive regime in North Korea.

Christopher Hill, the chief U.S. negotiator in the so-called "six party talks," emerged from a marathon meeting in Beijing to declare a framework for an agreement had been reached. But envoys from other nations at the table cautioned further talks will be needed to nail down a final pact.

In essence, North Korea has traded away its ability to produce new nuclear fuel in return for immediate energy and other aid.

But it will still hold on, for now, to an arsenal U.S. intelligence officials believe contains a half dozen or more nuclear weapons or the fuel to produce them.

Any deal involving Washington and Pyongyang would be globally significant because it comes only four months after North Korea sent shock waves around the world when it tested a nuclear weapon.

It would also mark a diplomatic success for a Bush administration more practised at issuing threats, notably the U.S. president's now infamous 2002 State of the Union speech in which he branded North Korea a member of the world's "axis of evil." Back then, Washington told the world it would not stand by idly as autocratic leader Kim Jong-il armed himself with weapons of mass destruction while starving his citizens.

Now, George W. Bush appears to be taking a page from the diplomatic playbook of his predecessor, Democratic president Bill Clinton. Although details remain sketchy, the overarching framework of the emerging deal mirrors a 1994 pact reached with North Korea by the Clinton administration.

That pact fell apart shortly after Bush came to power and took a harder line with the repressive Kim, a policy the president's critics charge allowed Pyongyang to embark on a nuclear program which made these talks much more crucial to averting a nuclear crisis.

Hill offered no details of the pact, but the outline of the deal on the table called for North Korea to seal its main nuclear reactor within 60 days and allow international nuclear inspectors into the country.

The status of its existing nuclear weapons and weapons fuel would be the subject of a further agreement and Washington has already signalled it would move on a second deal in the spring if it could get initial agreement from North Korea.

In return for closing the reactor and letting in inspectors, North Korea was to receive a package of energy and economic assistance worth some $400 million (US), along with unspecified security guarantees.

Published reports indicated North Korea was seeking immediate shipments of up to two million tonnes of fuel oil and two million kilowatts of electricity in exchange for its agreement.

Hill said he had been in constant contact with U.S. Secretary of State Condoleezza Rice and said approval from Washington did not appear to be a problem.

If the deal is approved in the various capitals, as it must be, it would be the first significant step toward North Korean disarmament since talks were restarted in 2003.

Even before the deal won official approval in Washington, it was under fire from the former U.S. envoy to the United Nations, John Bolton, who pushed for a package of sanctions against Pyongyang following the October test.

Bolton said the tentative deal would make Washington look weak and sets a bad precedent.

But Bill Richardson, the New Mexico governor and former UN envoy, offered praise, while cautioning details would have to be scrutinized.

"Although the devil is in the details, this is a first important step that might lead to the denuclearization of the Korean Peninsula," said Richardson, a Democratic presidential hopeful who has held direct talks with North Korean officials.

There was no official word from North Korea's representative. First word of the tentative deal came from China.

Other parties at the table included Russia, Japan, and South Korea.

Japanese and Russian envoys reacted cautiously, questioning whether details would be approved by their governments.

Related News

Can Europe's atomic reactors bridge the gap to an emissions-free future?

EU Nuclear Reactor Life Extension focuses on energy security, carbon-free electricity, and safety as ageing reactors face gas shortages, high power prices, and regulatory approvals across the UK and EU amid winter supply risks.


Key Points

EU Nuclear Reactor Life Extension is the policy to keep ageing reactors safely generating affordable, low-carbon power.

✅ Extends reactor operation via inspections and component upgrades

✅ Addresses gas shortages, price volatility, and winter supply risks

✅ Requires national regulator approval and cost-benefit analysis


Shaken by the loss of Russian natural gas since the invasion of Ukraine, European countries are questioning whether they can extend the lives of their ageing nuclear reactors to maintain the supply of affordable, carbon-free electricity needed for net-zero across the bloc — but national regulators, companies and governments disagree on how long the atomic plants can be safely kept running.

Europe avoided large-scale blackouts last winter despite losing its largest supplier of natural gas, and as Germany temporarily extended nuclear operations to bolster stability, but industry is still grappling with high electricity prices and concerns about supply.

Given warnings from the International Energy Agency that the coming winters will be particularly at risk from a global gas shortage, governments have turned their attention to another major energy source — even as some officials argue nuclear would do little to solve the gas issue in the near term — that would exacerbate the problem if it too is disrupted: Europe’s ageing fleet of nuclear power plants.

Nuclear accounts for nearly 10% of energy consumed in the European Union, with transport, industry, heating and cooling traditionally relying on coal, oil and natural gas.

Historically nuclear has provided about a quarter of EU electricity and 15% of British power, even as Germany shut down its last three nuclear plants recently, underscoring diverging national paths.

Taken together, the UK and EU have 109 nuclear reactors running, even as Europe is losing nuclear power in several markets, most of which were built in the 1970s and 1980s and were commissioned to last about 30 years.

That means 95 of those reactors — nearly 90% of the fleet — have passed or are nearing the end of their original lifespan, igniting debates over how long they can safely continue to be granted operating extensions, with some arguing it remains a needed nuclear option for climate goals despite age-related concerns.

Regulations differ across borders, with some countries such as Germany turning its back on nuclear despite an ongoing energy crisis, but life extension discussions are usually a once-a-decade affair involving physical inspections, cost/benefit estimates for replacing major worn-out parts, legislative amendments, and approval from the national nuclear safety authority.


Related News

View more

Operating record for Bruce Power as Covid-19 support Council announced

Bruce Power Life-Extension Programme advances Ontario nuclear capacity through CANDU Major Component Replacement, reliable operation milestones, supply chain retooling for COVID-19 recovery, PPE production, ventilator projects, and medical isotope supply security.


Key Points

A program to refurbish CANDU reactors, extend asset life, and mobilize Ontario nuclear supply chain and isotopes.

✅ Extends CANDU units via Major Component Replacement

✅ Supports COVID-19 recovery with PPE and ventilator projects

✅ Boosts Ontario energy reliability and medical isotopes


Canada’s Bruce Power said on 1 May that unit 1 at the Bruce nuclear power plant had set a record of 624 consecutive days of reliable operation – the longest since it was returned to service in 2012.

It exceeded Bruce 8’s run of 623 consecutive days between May 2016 and February 2018. Bruce 1, a Candu reactor, was put into service in 1977. It was shut down and mothballed by the former Ontario Hydro in 1997, and was refurbished and returned to service in 2012 by Bruce Power.

Bruce units 3 and 4 were restarted in 2003 and 2004. They are part of Bruce Power’s Life-Extension Programme, and future planning such as Bruce C project exploration continues across the fleet, with units 3 and 4 to undergo Major Component Replacement (MCR) Projects from 2023-28, adding about 30 years of life to the reactors.

The refurbishment of Bruce 6 has begun and will be followed by MCR Unit 3 which is scheduled to begin in 2023. Nuclear power accounts for more than 60% of Ontario’s supply, with Bruce Power providing more than 30%   of the province’s electricity.

Set up of Covid recovery council
On 30 April, Bruce Power announced the establishment of the Bruce Power Retooling and Economic Recovery Council to leverage the province’s nuclear supply chain to support Ontario’s fight against Covid-19 and to help aid economic recovery.

Bruce Power’s life extension programme is Canada’s second largest infrastructure project and largest private sector infrastructure programme. It is creating 22,000 direct and indirect jobs, delivering economic benefits that are expected to contribute $4 billion to Ontario’s GDP and $8-$11 billion to Canada’s gross domestic product (GDP), Bruce Power said.

“With 90% of the investment in manufactured goods and services coming from 480 companies in Ontario and other provinces, including recent manufacturing contracts with key suppliers, we can harness these capabilities in the fight against Covid-19, and help drive our economic recovery,” the company said.

“An innovative and dynamic nuclear supply chain is more important than ever in meeting this new challenge while successfully implementing our mission of providing clean, reliable, flexible, low-cost nuclear energy and a global supply of medical isotopes,” said Bruce Power president and CEO Mike Rencheck. “We are mobilising a great team with our extended supply chain, which spans the province, to assist in the fight against Covid-19 and to help drive our economic recovery in the future.”

Greg Rickford, the Minister of Energy, Mines, Northern Development, and Minister of Indigenous Affairs, said the launch of the council is consistent with Ontario’s focus to fight Covid-19 as a top priority and a look ahead to economic recovery, and initiatives like Pickering life extensions supporting long-term system reliability.

The creation of the Council was announced during a live event on Bruce Power's Facebook page, in which Rencheck was joined by Associate Minister of Energy Bill Walker and Rocco Rossi, the president and CEO of the Ontario Chamber of Commerce.

Walker reiterated the Government of Ontario’s commitment to nuclear power over the long term and to the life extension programme, including the Pickering B refurbishment as part of this strategy.

The Council, which will be formed for the duration of the pandemic and will include of all of Bruce Power’s Ontario-based suppliers, will focus on the continued retooling of the supply chain to meet front-line Covid-19 needs to contribute to the province’s economy recovery in the short, medium and long term.

New uses for nuclear medical applications will be explored, including isotopes for the sterilisation of medical equipment and long-term supply security.

The supply chain will be leveraged to support the health care sector through the rapid production of medical Personal Protection Equipment for front line-workers and large-scale PPE donations to communities as well as participation in pilot projects to make ventilators within the Bruce Power supply chain or help identify technology to better utilise existing ventilators;

“Buy Local” tools and approaches will be emphasised to ensure small businesses are utilised fully in communities where nuclear suppliers are located.

The production of hand sanitiser and other cleaning products will be facilitated for distribution to communities.


Related News

View more

Which of the cleaner states imports dirty electricity?

Hourly Electricity Emissions Tracking maps grid balancing areas, embodied emissions, and imports/exports, revealing carbon intensity shifts across PJM, ERCOT, and California ISO, and clarifying renewable energy versus coal impacts on health and climate.


Key Points

An hourly method tracing generation, flows, and embodied emissions to quantify carbon intensity across US balancing areas.

✅ Hourly traces of imports/exports and generation mix

✅ Consumption-based carbon intensity by balancing area

✅ Policy insights for renewables, coal, health costs


In the United States, electricity generation accounts for nearly 30% of our carbon emissions. Some states have responded to that by setting aggressive renewable energy standards; others are hoping to see coal propped up even as its economics get worse. Complicating matters further is the fact that many regional grids are integrated, and as America goes electric the stakes grow, meaning power generated in one location may be exported and used in a different state entirely.

Tracking these electricity exports is critical for understanding how to lower our national carbon emissions. In addition, power from a dirty source like coal has health and environment impacts where it's produced, and the costs of these aren't always paid by the parties using the electricity. Unfortunately, getting reliable figures on how electricity is produced and where it's used is challenging, even for consumers trying to find where their electricity comes from in the first place, leaving some of the best estimates with a time resolution of only a month.

Now, three Stanford researchers—Jacques A. de Chalendar, John Taggart, and Sally M. Benson—have greatly improved on that standard, and they have managed to track power generation and use on an hourly basis. The researchers found that, of the 66 grid balancing areas within the United States, only three have carbon emissions equivalent to our national average, and they have found that imports and exports of electricity have both seasonal and daily changes. de Chalendar et al. discovered that the net results can be substantial, with imported electricity increasing California's emissions/power by 20%.

Hour by hour
To figure out the US energy trading landscape, the researchers obtained 2016 data for grid features called balancing areas. The continental US has 66 of these, providing much better spatial resolution on the data than the larger grid subdivisions. This doesn't cover everything—several balancing areas in Canada and Mexico are tied in to the US grid—and some of these balancing areas are much larger than others. The PJM grid, serving Pennsylvania, New Jersey, and Maryland, for example, is more than twice as large as Texas' ERCOT, in a state that produces and consumes the most electricity in the US.

Despite these limitations, it's possible to get hourly figures on how much electricity was generated, what was used to produce it, and whether it was used locally or exported to another balancing area. Information on the generating sources allowed the researchers to attach an emissions figure to each unit of electricity produced. Coal, for example, produces double the emissions of natural gas, which in turn produces more than an order of magnitude more carbon dioxide than the manufacturing of solar, wind, or hydro facilities. These figures were turned into what the authors call "embodied emissions" that can be traced to where they're eventually used.

Similar figures were also generated for sulfur dioxide and nitrogen oxides. Released by the burning of fossil fuels, these can both influence the global climate and produce local health problems.

Huge variation
The results were striking. "The consumption-based carbon intensity of electricity varies by almost an order of magnitude across the different regions in the US electricity system," the authors conclude. The low is the Bonneville Power grid region, which is largely supplied by hydropower; it has typical emissions below 100kg of carbon dioxide per megawatt-hour. The highest emissions come in the Ohio Valley Electric region, where emissions clear 900kg/MW-hr. Only three regional grids match the overall grid emissions intensity, although that includes the very large PJM (where capacity auction payouts recently fell), ERCOT, and Southern Co balancing areas.

Most of the low-emissions power that's exported comes from the Pacific Northwest's abundant hydropower, while the Rocky Mountains area exports electricity with the highest associated emissions. That leads to some striking asymmetries. Local generation in the hydro-rich Idaho Power Company has embodied emissions of only 71kg/MW-hr, while its imports, coming primarily from Rocky Mountain states, have a carbon content of 625kg/MW-hr.

The reliance on hydropower also makes the asymmetry seasonal. Local generation is highest in the spring as snow melts, but imports become a larger source outside this time of year. As solar and wind can also have pronounced seasonal shifts, similar changes will likely be seen as these become larger contributors to many of these regional grids. Similar things occur daily, as both demand and solar production (and, to a lesser extent, wind) have distinct daily profiles.

The Golden State
California's CISO provides another instructive case. Imports represent less than 30% of its total electric use in 2016, yet California electricity imports provided 40% of its embodied emissions. Some of these, however, come internally from California, provided by the Los Angeles Department of Water and Power. The state itself, however, has only had limited tracking of imported emissions, lumping many of its sources as "other," and has been exporting its energy policies to Western states in ways that shape regional markets.

Overall, the 2016 inventory provides a narrow picture of the US grid, as plenty of trends are rapidly changing our country's emissions profile, including the rise of renewables and the widespread adoption of efficiency measures and other utility trends in 2017 that continue to evolve. The method developed here can, however, allow for annual updates, providing us with a much better picture of trends. That could be quite valuable to track things like how the rapid rise in solar power is altering the daily production of clean power.

More significantly, it provides a basis for more informed policymaking. States that wish to promote low-emissions power can use the information here to either alter the source of their imports or to encourage the sites where they're produced to adopt more renewable power. And those states that are exporting electricity produced primarily through fossil fuels could ensure that the locations where the power is used pay a price that includes the health costs of its production.


Related News

View more

ABO to build 10MW Tunisian solar park

ABO Wind Tunisia 10MW Solar Project will build a photovoltaic park in Gabes with a STEG PPA, fixed tariff, 2,500 m grid connection, producing 18 million kWh annually, targeted for 2020 commissioning with local partners.


Key Points

A 10MW photovoltaic park in Gabes with a 20-year STEG PPA and fixed tariff, slated for 2020 commissioning.

✅ 18 million kWh/year; 2,500 m grid tie, 20-year fixed tariff

✅ Electricity supplied to STEG under PPA; 2020 commissioning

✅ Located in Gabes; built with local partners, 10MW capacity


ABO Wind has received a permit and a tariff for a 10MW photovoltaic project in Tunisia, amid global activity such as Spain's 90MW wind project now underway, which it plans to build and commission in 2020.

The solar park, in the governorate of Gabes, is 400km south of the country’s capital Tunis and aligns with renewable funding initiatives seen across developing markets.

The developer said it plans to build the project next year in close cooperation with local partners, as regional markets from North Africa to the Gulf expand, with Saudi Arabia boosting wind capacity as well.

ABO Wind department head Nicolas Konig said: “The solar park will produce more than 18 million kilowatt hours of electricity per year and will feed it into the grid at a distance of 2500 metres.”

The developer will conclude an electricity supply contract with the state-owned energy supplier (Societe tunisienne de l’electricite et du gaz (STEG), which will provide a fixed remuneration over 20 years, a model echoed by Germany's wind-solar tender for the electricity fed into the grid.

Earlier this year, ABO Wind had already secured a tariff for a wind farm with a capacity of 30MW in a tender, 35km south-east of Tunis, underscoring Tunisia's wind investments under its long-term plan.

The company is working on half a dozen Tunisian wind and solar projects, as institutions like the World Bank support wind growth in developing countries.

“We are making good progress on our way to assemble a portfolio of several ready-to-build wind and solar projects attractive to investors, as Saudi clean energy targets continue to expand globally,” said ABO Wind general manager responsible for international business development Patrik Fischer.


Related News

View more

4 ways the energy crisis hits U.S. electricity, gas, EVs

U.S. Energy Crunch disrupts fuel and power markets, driving natural gas price spikes, coal resurgence, utility mix shifts, supply chain strains for EV batteries, and inflation pressures, complicating climate policy, OPEC outreach and LNG trade


Key Points

Supply-demand gaps raise fuel costs, revive coal, strain EV materials, and complicate U.S. climate policy and plans.

✅ Natural gas spikes shift generation from gas to coal

✅ Supply chain shortages hit nickel, silicon, and chips

✅ Policy tensions between price relief and decarbonization


A global energy crunch is creating pain for people struggling to fill their tanks and heat their homes, as well as roiling the utility industry’s plans to change its mix of generation and complicating the Biden administration’s plans to tackle climate change.

The ripple effects of a surge in natural gas prices include a spike in coal use and emissions that counter clean energy targets. High fossil fuel prices also are translating into high prices and a supply crunch for key minerals like silicon used in clean energy projects. On a call with investors yesterday, a Tesla Inc. executive said the company is having a hard time finding enough nickel for batteries.

The crisis could pose political problems for the Biden administration, which spent the last few months fending off criticism about rising fuel prices and inflation (Energywire, Oct. 14).

“Energy issues at this moment are as salient to the American public as they have been in quite some time,” said Christopher Borick, who directs the Muhlenberg College Institute of Public Opinion in Pennsylvania, where Biden stopped yesterday to pitch his infrastructure plan.

While gasoline prices have gotten headlines all summer, natural gas prices have risen faster than motor fuels, more than doubling from an average $1.92 per thousand cubic feet in September 2020 to $5.16 last month. By comparison, gasoline prices have risen about 55 percent in the last year, to $3.36 per gallon nationwide this week, according to AAA.

The roots of the problem go back to the beginning of the pandemic and the recession in 2020. Oil and gas prices fell so fast then that many producers, particularly in the U.S., simply stopped drilling.

Oil companies began predicting a few months later that the abrupt shutdown would eventually lead to shortages and price spikes when the economy recovered. Those predictions turned out to be accurate.

With the economy beginning to recover, demand for gas has gone up, but there’s not enough supply to go around.

While the U.S. energy crunch isn’t as severe as Europe’s energy crisis today, and analysts predict that gas prices will gradually fall next year, consumers could be in for a rough couple of months.

Here’s four ways the global energy crisis is impacting the United States, from the electricity sector to the political landscape:

What are the political repercussions?
For the Biden administration, the energy price hikes come amid fears of rising inflation and persistent supply bottlenecks at the nation’s ports as its climate ambitions face headwinds in Congress.

“The confluence of energy prices, logistical challenges and the need to move on climate have raised this to the top tier,” said Borick, who in the past has polled on energy and environmental issues in Pennsylvania.

Borick noted the administration is facing counterpressures: Even as it pushes to decarbonize the nation’s electric system, it wants to keep gas prices in check. High gasoline prices have been linked to declining political approval ratings, including for presidents, even if much of the price hikes are beyond their control.

White House press secretary Jen Psaki said earlier this month that the administration can take steps to address what it called “short-term supply issues,” but also needs to focus on the long term — and climate.

In hopes of capping prices, the White House has spoken with members of OPEC about increasing oil production — though OPEC has little control over natural gas prices. And earlier this month, the administration talked to U.S. oil and gas producers about helping to bring down prices.

That comes even as environmentalists have pushed Biden to ban federal fossil fuel leasing and drilling and stop new projects.

The moves to curb prices have prompted ridicule from Republicans, who have accused Biden of declaring war on U.S. energy by canceling the Keystone XL pipeline.

“The Biden administration won’t say it out loud, yet let’s admit it: There is a crisis,” Sen. John Barrasso (R-Wyo.) said this week on the Senate floor. “It is one that Joe Biden and his administration has created. It is a crisis of Joe Biden’s own making.”

The situation has also resurfaced comparisons to former President Carter, who struggled politically in the 1970s with gasoline shortages and other energy pressures. Some political scientists say, though, the comparison between the two isn’t apples to apples.

"In 1979, the crisis began with the Iranian Revolution, producing a supply shortage. In the USA, some states rationed the supply. That’s not occurring now. Oil prices were also regulated, another difference, “ said Terry Madonna, a senior fellow in residence for political affairs at Millersville University.

A Morning Consult poll released yesterday carried warning signs for Democrats with worries about the economy on the rise across the political spectrum.

Voters, however, were evenly split on how Biden is handling energy. Forty-two percent of respondents approve of Biden’s energy policy, compared with 45 percent who disapproved. The margin of error is 2 percentage points.

Will the electricity mix change?
Higher gas prices are giving coal a boost in some markets.

Atlanta-based Southern Co. told CNBC earlier this week, for instance, that coal was about 17 percent of the company’s power mix last year. That has changed in 2021.

“The unintended consequence of high gas prices is that coal becomes more economic, and so my sense is … our coal production has bumped up above 20 percent,” Southern CEO Tom Fanning said. “Now, how long that’ll persist, I don’t know.”

Fanning said “what we’re seeing right now, and the real challenge in America, is this notion of energy in transition.”

But the U.S. power sector has been evolving for years, with more renewables and less coal on the grid, and experts say the current energy crunch won’t change long-term utility trends in the industry.

“In general, I wouldn’t place too much emphasis on short-term fluctuations,” Jay Apt, a professor at Carnegie Mellon University, said in an email. “There is still a robust supply chain for most components needed for low-pollution power, including renewables.”

In fact, elevated fossil fuel prices, and high natural gas prices in particular, could accelerate the move toward wind, solar and batteries in some areas. That’s because power plants that run on coal and natural gas can be affected by rising and volatile fuel prices, as illustrated by the recent move in commodities globally. That means higher costs to run the facilities, even if power prices often climb along with gas prices.

“If I were a utility planner, this would cause me to double down on new generation from [wind] and solar and storage as opposed to building additional natural gas plants where, you know, I could be having these super high and volatile operating costs,” said Bri-Mathias Hodge, an associate professor in the Department of Electrical, Computer and Energy Engineering at the University of Colorado, Boulder.

Ed Hirs, an energy fellow at the University of Houston, said the current global situation doesn’t change the U.S. power sector’s overall move toward generation with lower operating costs.

For example, he said nuclear and coal plants can require hundreds of employees, and both have fuel costs. Hirs said a gas facility also needs fuel and may need dozens of employees. Wind and solar facilities often need a smaller number of workers and don’t require fuel in their operations, he noted.

“Eventually the cheap wins out,” Hirs said.

That isn’t even factoring in climate change — the reason world leaders are seeking to slash greenhouse gas emissions. Indeed, lowering emissions remains a priority among many states and big companies in the U.S.

Over the next 10 to 15 years, Hirs said, a key question will be whether battery technology can compete economically in terms of backing up renewables. He said a national carbon price, if enacted, would aid renewables and enhance returns on batteries.

“The real battle is going to be between natural gas and battery storage,” Hirs said.

Apt and M. Granger Morgan, who’s also a Carnegie Mellon professor, noted in a Hill piece last month that the U.S. gets about 40 percent of its power from carbon-free sources, including nuclear.

“Modelers and many power system operators agree that it is possible that renewables can cost-effectively make up roughly 80% of electricity generation,” the professors wrote, adding that other sources could include “storage and gas turbines powered with hydrogen, synfuels, or natural gas with carbon capture.”

What about EVs and renewables?
As for electric vehicles, executives with Tesla said on a call yesterday that supply-chain problems are the major brake on production for both vehicles and batteries.

Chief Financial Officer Zachary Kirkhorn said that the company’s factories aren’t running at full capacity because of an ongoing shortage of semiconductor chips. Customers are waiting longer for vehicles, he said, and wait lists are growing.

The challenges extend to raw materials. In batteries, Kirkhorn said, the company is having trouble finding enough nickel, and in vehicles, it is scrounging for aluminum. He said the problem is "not small," and that prices may rise as supply contracts come up for renewal.

The supply problems are creating "cost headwinds," he said, and so are rising labor costs. Tesla is not immune from the worker shortages that are plaguing the entire U.S. economy.

The production woes aren’t limited to Tesla: Automakers around the world have have had their output crimped by the chip shortage that accompanied the economic rebound after pandemic lockdowns. Unlike many other automakers, Tesla hasn’t been forced to pause its factory lines.

Tesla said it is poised to greatly expand its production of batteries for the electric grid — with a caveat.

Last month, Tesla broke ground on a new California factory to make Megapack, its 3 megawatt-per-hour lithium-ion batteries for use by power companies. That future factory’s capacity, 40 gigawatt per hour a year, is vastly more than the 3 GWh it made in the last calendar year.

However, today’s supply-chain problems are braking the making of both Megapack and Powerwall, Tesla’s battery for homes, Kirkhorn said. He added that production will increase "as soon as parts allow us."

Other advocates for EVs and renewable power expressed little concern about the supply crunch’s meaning for their industries, noting that higher prices alone don’t automatically trigger a broader green revolution on their own.

Those problems likely wouldn’t change the immediate course of the energy transition, researchers said.

"Short-term trends, week to week or even month to month, don’t matter much for investors or policy makers," wrote John Graham, a former budget official with the Bush administration and professor at Indiana University’s O’Neill School of Public and Environmental Affairs, in an email to E&E News.

The crunch may give policymakers a glimpse of the future, however, according to one minerals analyst.

"This isn’t going to be an outlier. I think increasingly you’re going to see pockets of the world start to feel these strains," said Andrew Miller, product director at Benchmark Mineral Intelligence, which focuses its research on battery minerals and battery supply chains.

The U.S. and its allies are only now beginning to develop their own supply chains for batteries and other key clean energy technologies, he noted. "The issue you’re facing, and this is one coming over time, is to have the platform in place. You have to have the supply chain of raw materials," he said.

"I think you’re going to see the most turbulence over the coming decade. … It’s not going to be a smooth transition,” added Miller.

How long will gas prices stay high?
The gap between natural gas demand and supply has led to severe price spikes in Europe, where utilities and other gas buyers have to compete against China for cargoes of liquefied natural gas, according to a research note from IHS Markit Ltd.

Here in the U.S., the causes are the same, but the results aren’t as extreme. Less than 10 percent of domestic gas production is exported as LNG, so American customers don’t have to compete as much against overseas buyers.

Instead, gas-hungry sectors of the economy have run into another problem, IHS analyst Matthew Palmer said in an interview. Gas producers have been cautious about increasing their output, largely because of pressure from investors to limit their spending.

“That theme has really put a governor on production,” he said.

The disconnect will likely mean higher home gas bills and higher electric prices this winter, although deep freeze events or warm weather could disrupt the trend, he said. The U.S. Energy Information Administration is predicting that average heating bills for homes that use gas furnaces will rise 30 percent this winter.

This comes as U.S. gas supply remains high, according to a biennial assessment from the Potential Gas Committee, a group of volunteer geoscientists, engineers and other experts.

Including reserves, future gas supply in the U.S. stands at a record 3,863 trillion cubic feet, up 25 tcf from levels reported in 2019, the group said Tuesday at an event co-hosted with the American Gas Association.

Of that total, so-called technically recoverable resources — or those in the ground but not yet recovered — are 3,368 tcf, the PGC said, down less than 0.2 percent from the last assessment.

The amount of technically recoverable gas went relatively unchanged from year-end 2018 for several reasons, including a lack of company activity in exploration efforts last year due to COVID, said Alexei Milkov, the group’s executive director.

Another factor is that basins mature and shale plays “cannot increase in resources forever,” said Milkov, also a professor of geology and geological engineering at the Colorado School of Mines.

Still, Milkov added, “We cannot tell you right now if we are on a new plateau, or if we are going to start seeing more growth in gas resources again, right, because it’s a complex issue.”

The EIA predicts that gas production will increase and prices will begin to drop in 2022.

David Flaherty, CEO of the Republican polling firm Magellan Strategies in Colorado, said prices could particularly hit seniors. But he said he expected the energy crunch to ease in the U.S. well before the election.

“By early summer, this is likely to be behind us,” he said.


Related News

View more

Can California Manage its Solar Boom?

California Duck Curve highlights midday solar oversupply and steep evening peak demand, stressing grid stability. Solutions include battery storage, demand response, diverse renewables like wind, geothermal, nuclear, and regional integration to reduce curtailment.


Key Points

A mismatch between midday solar surplus and evening demand spikes, straining the grid without storage and flexibility.

✅ Midday solar oversupply forces curtailment and wasted clean energy.

✅ Evening ramps require fast, fossil peaker plants to stabilize load.

✅ Batteries, demand response, regional trading flatten the curve.


California's remarkable success in adopting solar power, including a near-100% renewable milestone, has created a unique challenge: managing the infamous "duck curve." This distinctive curve illustrates a growing mismatch between solar electricity generation and the state's energy demands, creating potential problems for grid stability and ultimately threatening to slow California's progress in the fight against climate change.


The Shape of the Problem

The duck curve arises from a combination of high solar energy production during midday hours and surging energy demand in the late afternoon and evening when solar power declines. During peak solar hours, the grid often has an overabundance of electricity, and curtailments are increasing as a result, while as the sun sets, demand surges when people return home and businesses ramp up operations. California's energy grid operators must scramble to make up this difference, often relying on fast-acting but less environmentally friendly power sources.


The Consequences of the Duck Curve

The increasing severity of the duck curve has several potential consequences for California:

  • Grid Strain: The rapid ramp-up of power sources to meet evening demand puts significant strain on the electrical grid. This can lead to higher operational costs and potentially increase the risk of blackouts during peak demand times.
  • Curtailed Energy: To avoid overloading the grid, operators may sometimes have to curtail excess solar energy during midday, as rising curtailment reports indicate, essentially wasting clean electricity that could have been used to displace fossil fuel generation.
  • Obstacle to More Solar: The duck curve can make it harder to add new solar capacity, as seen in Alberta's solar expansion challenges, for fear of further destabilizing the grid and increasing the need for fossil fuel-based peaking plants.


Addressing the Challenge

California is actively seeking solutions to mitigate the duck curve, aligning with national decarbonization pathways that emphasize practicality. Potential strategies include:

  • Energy Storage: Deploying large-scale battery storage can help soak up excess solar electricity during the day and release it later when demand peaks, smoothing out the duck curve.
  • Demand Flexibility: Encouraging consumers to shift their energy use to off-peak hours through incentives and smart grid technologies can help reduce late-afternoon surges in demand.
  • Diverse Power Sources: While solar is crucial, a balanced mix of energy sources, including geothermal, wind, and nuclear, can improve grid stability and reduce reliance on rapid-response fossil fuel plants.
  • Regional Cooperation: Integrating California's grid with neighboring states can aid in balancing energy supply and demand across a wider geographical area.


The Ongoing Solar Debate

The duck curve has become a central point of debate about the future of California's energy landscape. While acknowledging the challenge, solar advocates argue for continued expansion, backed by measures like a bill to require solar on new buildings, emphasizing the urgent need to transition away from fossil fuels. Grid operators and some utility companies call for a more cautious approach, emphasizing grid reliability and potential costs if the problem isn't effectively managed.


Balancing California's Needs and its Green Ambitions

Finding the right path forward is essential; it will determine whether California can continue to lead the way in solar energy adoption while ensuring a reliable and affordable electricity supply. Successfully navigating the duck curve will require innovation, collaboration, and a strong commitment to building a sustainable energy system, as wildfire smoke impacts on solar continue to challenge generation predictability.


Related News

View more

Sign Up for Electricity Forum’s Newsletter

Stay informed with our FREE Newsletter — get the latest news, breakthrough technologies, and expert insights, delivered straight to your inbox.

Electricity Today T&D Magazine Subscribe for FREE

Stay informed with the latest T&D policies and technologies.
  • Timely insights from industry experts
  • Practical solutions T&D engineers
  • Free access to every issue

Live Online & In-person Group Training

Advantages To Instructor-Led Training – Instructor-Led Course, Customized Training, Multiple Locations, Economical, CEU Credits, Course Discounts.

Request For Quotation

Whether you would prefer Live Online or In-Person instruction, our electrical training courses can be tailored to meet your company's specific requirements and delivered to your employees in one location or at various locations.