Canada Clean Electricity leads decarbonization, slashing power-sector emissions through coal phase-out, renewables like hydro, wind, and solar, and nuclear. Provinces cut carbon intensity, enabling electrification of transport and buildings toward net-zero goals.
Key Points
Canada Clean Electricity is the shift to low-emission power by phasing out coal and scaling renewables and nuclear.
✅ 38% cut in electricity emissions since 2005; 84% fossil-free power.
✅ Provinces lead coal phase-out; carbon intensity plummets.
✅ Enables EVs, heat pumps, and building electrification.
It's our country’s one big climate success so far.
"All across Canada, electricity generation has been getting much cleaner. It's our country’s one big climate success so far,"
To illustrate how quickly electric power is being cleaned up, what's still left to do, and the benefits it brings, I've dug into Canada's latest emissions inventory and created a series of charts below.
The sector that could
Climate pollution by Canadian economic sector, 2005 to 2017My first chart shows how Canada's economic sectors have changed their climate pollution since 2005.
While most sectors have increased their pollution or made little progress in the climate fight, our electricity sector has shined.
As the green line shows, Canadians have eliminated an impressive 38 per cent of the climate pollution from electricity generation in just over a decade.
To put these shifts into context, I've shown Canada's 2020 climate target on the chart as a gray star. This target was set by the Harper government as part of the global Copenhagen Accord. Specifically, Canada pledged to cut our climate pollution 17 per cent below 2005 levels under evolving Canadian climate policy frameworks of the time.
As you can see, the electricity sector is the only one to have done that so far. And it didn’t just hit the target — it cut more than twice as much.
Change in Canada's electricity generation, 2005 to 2017My next chart shows how the electricity mix changed. The big climate pollution cuts came primarily from reductions in coal burning, highlighting the broader implications of decarbonizing Canada's electricity grid for fuel choices.
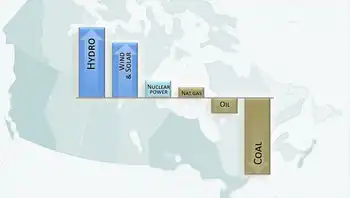
The decline in coal-fired power was replaced (and then some) by increases in renewable electricity and other zero-emissions sources — hydro, wind, solar and nuclear.
As a result, Canada's overall electricity generation is now 84 per cent fossil free.
Every province making progress
A primary reason why electricity emissions fell so quickly is because every province worked to clean up Canada's electricity together.
Change in Canadian provincial electricity carbon intensity, 2005 to 2017
My next chart illustrates this rare example of Canada-wide climate progress. It shows how quickly the carbon-intensity of electricity generation has declined in different provinces.
(Note: carbon-intensity is the amount of climate pollution emitted per kilowatt-hour of electricity generated: gCO2e/kWh).
Ontario clearly led the way with an amazing 92 per cent reduction in climate pollution per kWh in just twelve years. Most of that came from ending the burning of coal in their power plants. But a big chunk also came from cutting in half the amount of natural gas they burn for electricity.
Manitoba, Quebec and B.C. also made huge improvements.
Even Alberta and Saskatchewan, which were otherwise busy increasing their overall climate pollution, made progress in cleaning up their electricity.
These real-world examples show that rapid and substantial climate progress can happen in Canada when a broad-spectrum of political parties and provinces decide to act.
Most Canadians now have superclean electricity
As a result of this rapid cleanup, most Canadians now have access to superclean energy.
Canadian provincial electricity carbon intensity in 2017
Who has it? And how clean is it?
The biggest climate story here is the superclean electricity generated by the four provinces shown on the left side — Quebec, Manitoba, B.C. and Ontario. Eighty per cent of Canadians live in these provinces and have access to this climate-safe energy source.
Those living in Alberta and Saskatchewan, however, still have fairly dirty electricity — as shown in orange on the right — and options like bridging the electricity gap between Alberta and B.C. could accelerate progress in the West.
A lot more cleanup must happen here before the families and businesses in these provinces have a climate-safe energy supply.
What's left to do?
Canada's electricity sector has two big climate tasks remaining: finishing the cleanup of existing power and generating even more clean energy to replace fossil fuels like the gasoline and natural gas used by vehicles, factories and other buildings.
Finishing the clean up
Climate pollution from Canadian provincial electricity 2005 and 2017
As we saw above, more than a third of the climate pollution from electricity has already been eliminated. That leaves nearly two-thirds still to clean up.
Back in 2005, Canada's total electricity emissions were 125 million tonnes (MtCO2).
Over the next twelve years, emissions fell by more than a third (-46 MtCO2). Ontario did most of the work by cutting 33 MtCO2. Alberta, New Brunswick and Nova Scotia made the next biggest cuts of around 4 MtCO2 each.
Now nearly eighty million tonnes of climate pollution remain.
As you can see, nearly all of that now comes from Alberta and Saskatchewan. As a result, continuing Canada's climate progress in the power sector now requires big cuts in the electricity emissions from these two provinces.
Generating more clean electricity
The second big climate task remaining for Canada's electricity is to generate more clean electricity to replace the fossil fuels burned in other sectors. My next chart lets you see how big a task this is.
Clean electricity generation by Canadian province, 2017
It shows how much climate-safe electricity is currently generated in major provinces. This includes zero-emissions renewables (blue bars) and nuclear power (pale blue).
Quebec tops the list with 191 terawatt-hours (TWh) per year. While impressive, it only accounts for around half of the energy Quebecers use. The other half still comes from climate-damaging fossil fuels and to replace those, Quebec will need to build out more clean energy.
The good news here is that electricity is more efficient for most tasks, so fossil fuels can be replaced with significantly less electric energy. In addition, other efficiency and reduction measures can further reduce the amount of new electricity needed.
Newfoundland and Labrador is in the best situation. They are the only province that already generates more climate-safe electricity than they would need to replace all the fossil fuels they burn. They currently export most of that clean electricity.
At the other extreme are Alberta and Saskatchewan. These provinces currently produce very little climate-safe energy. For example, Alberta's 7 TWh of climate-safe electricity is only enough to cover 1 per cent of the energy used in the province.
All told, Canadians currently burn fossil fuels for three-quarters of the energy we use. To preserve a safe-and-sane climate, most provinces will soon need lots more clean electricity in the race to net-zero to replace the fossil fuels we burn.
How soon will they need it?
According to the most recent report from the International Panel on Climate Change (IPCC), avoiding a full-blown climate crisis will require humanity to cut emissions by 45 per cent over the next decade.
Using electricity to clean up other sectors
Finally, let's look at how electricity can help clean up two of Canada’s other high-emission sectors — transportation and buildings.
Cleaning up transportation
Transportation is now the second biggest climate polluting sector in Canada (after the oil and gas industry). So, it’s a top priority to reduce the amount of gasoline we use.
Canadian provincial electricity carbon intensity in 2017, plus gasoline equivalent
Switching to electric vehicles (EVs) can reduce transportation emissions by a little, or a lot. It depends on how clean the electricity supply is.
To make it easy to compare gasoline to each province's electricity I've added a new grey-striped zone at the top of the carbon-intensity chart.
This new zone shows that burning gasoline in cars and trucks has a carbon-intensity equivalent to more than 1,000 gCO2e/kWh. (If you are interested in the details of this and other data points, see the geeky endnotes.)
The good news is that every province's electricity is now much cleaner than gasoline as a transportation fuel.
In fact, most Canadians have electricity that is at least 95 per cent less climate polluting than gasoline. Electrifying vehicles in these provinces virtually eliminates those transportation emissions.
Even in Alberta, which has the dirtiest electricity, it is 20 per cent cleaner than gasoline. That's a help, for sure. But it also means that Albertans must electrify many more vehicles to achieve the same emissions reductions as regions with cleaner electricity.
In addition to reducing climate pollution, switching transportation to electricity brings other big benefits:
It reduces air pollution in cities — a major health hazard.
It cuts the energy required for transportation by 75 per cent — because electric motors are so much more efficient.
It reduces fuel costs up to 80 per cent — saving tens of thousands of dollars.
And for gasoline-importing provinces, using local electricity keeps billions of fuel dollars inside their provincial economy.
As an extra bonus, it makes it hard for companies to manipulate the price or for outsiders to "turn off the taps.”
Cleaning up buildings
Canada's third biggest source of climate pollution is the buildings sector.
Burning natural gas for heating is the primary cause. So, reducing the amount of fossil gas burned in buildings is another top climate requirement.
Canadian provincial electricity carbon intensity in 2017, plus gasoline and nat gas heating equivalent
Heating with electricity is a common alternative. However, it's not always less climate polluting. It depends on how clean the electricity is.
To compare these two heating sources, look at the lower grey-striped zone I've added to the chart.
It shows that heating with natural gas has a carbon-intensity of 200 to 300 gCO2 per kWh of heat delivered. High-efficiency gas furnaces are at the lower end of this range.
As you can see, for most Canadians, electric heat is now the much cleaner choice — nearly eliminating emissions from buildings. But in Alberta and Saskatchewan, electricity is still too dirty to replace natural gas heat.
The climate benefits of electric heat can be improved further by using the newer high-efficiency air-source heat pump technologies like mini-splits. These can heat using one half to one third of the electricity of standard electric baseboard heaters. That means it is possible to use electricity that is a bit dirtier than natural gas and still deliver cleaner heating. As a bonus, heat pumps can free up a lot of existing electricity supply when used to replace existing electric baseboards.
Electrify everything
You’ve probably heard people say that to fight climate breakdown, we need to “electrify everything.” Of course, the electricity itself needs to be clean and what we’ve seen is that Canada is making important progress on that front. The electricity industry, and the politicians that prodded them, all deserve kudos for slashing emissions at more than twice the rate of any other sector.
We still need to finish the cleanup job, but we also need to turn our sights to the even bigger task ahead: requiring that everything fossil fuelled — every building, every factory, every vehicle — switches to clean Canadian power.
Related News