ERCOT Issues RFP to Procure Capacity to Alleviate Winter Concerns
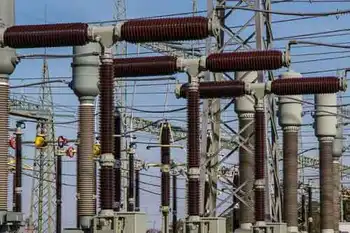

powerlines

Protective Relay Training - Basic

Our customized live online or in‑person group training can be delivered to your staff at your location.

  • Live Online
  • 12 hours Instructor-led
  • Group Training Available
Regular Price:
$699
Coupon Price:
$599
Reserve Your Seat Today

ERCOT Winter Capacity RFP seeks up to 3,000 MW through generation and demand response to bolster Texas grid reliability during peak load, leveraging Reliability Must-Run, incentive factors, and EEA risk mitigation for the 2023-24 season.


Key Points

An ERCOT initiative to procure 3,000 MW of generation and demand response to reduce EEA risk and improve reliability.

✅ Targets 3,000 MW from generation and demand response

✅ Uses RMR-style contracts with flexible incentive factors

✅ Aims to lower EEA probability below 10% this winter


The Electric Reliability Council of Texas (ERCOT) issued a request for proposals to stakeholders to procure up to 3,000 MW of generation or demand response capacity to meet load and reserve requirements during the winter 2023-24 peak load season (Dec. 1, 2023, through Feb. 29, 2024), amid ongoing Texas power grid challenges across the region.

ERCOT cited “several factors, including significant peak load growth since last winter, recent and proposed retirements of dispatchable Generation Resources, and recent extreme winter weather events, including Winter Storm Elliott in December 2022, Winter Storm Uri in February 2021, and the 2018 and 2011 winter storms, each of which resulted in abnormally high demand during winter weather.” It now seeks additional capacity under its “authority to prevent an anticipated Emergency Condition,” reflecting nationwide blackout risks identified by grid experts.

In its notice regarding the RFP, ERCOT identified a number of mothballed and recently decommissioned generation resources that may be eligible to offer capacity under the RFP. It further stated that offers must comport with the format of its “Reliability Must-Run” agreement but could include a proposed “Incentive Factor” that reflects the revenues the unit owners determine would be necessary to bring the unit back to operation. It added that the Incentive Factor is not necessarily limited to 10%. Providers of eligible demand response can submit offers based on similar principles that are not necessarily constrained by cost. The notice identifies potential acceptable sources of demand response, describes certain parameters for the kinds of demand response that are permitted to respond to the RFP, and outlines the time periods during which ERCOT must be able to deploy the demand response resources to improve electricity reliability across the system.

To meet the Dec. 1, 2023, service start date, ERCOT developed an aggressive timeline to solicit and evaluate proposals through the RFP. Responses to the RFP are due Nov. 6, 2023. ERCOT’s schedule provides that it will notify market participants that obtain awards on Nov. 23, 2023. Expect contracts to be executed by Nov. 30, 2023.

Unlike Regional Transmission Organizations in the Northeastern United States, ERCOT does not have a capacity market. Instead, ERCOT relies on a high price cap of $5,000 per MWh for its energy market (decreased from the $9,000 per MWh cap in effect during Winter Storm Uri) and an Operating Reserve Demand Curve adder that pays additional funds to generators supplying power and ancillary services, an area recently scrutinized for improper payments when supply conditions are tight. In the wake of Winter Storm Uri, some calls were made to have ERCOT adopt a capacity market for reliability reasons, and a number of legal battles continue to play out in the wake of Winter Storm Uri. (See recent McGuireWoods legal alert “Winter Storm Uri Power Dispute Reaches the Supreme Court of Texas.”) Though a capacity market was not adopted, the Texas Legislature approved a $7.2 billion loan program, widely described as an electricity market bailout for generators, to build up to 10,000 MW of dispatchable generation. The legislature also approved a version of the Public Utility Commission of Texas’ proposal to establish a “Performance Credit Mechanism,” but with a cost cap of $1 billion.

The loss of life and economic impacts of Winter Storm Uri in 2021, along with the energy crunches and calls for conservation this past summer, are driving changes to ERCOT’s “energy-only” market, including electricity market reforms under consideration. Texas policymakers are providing multiple financial incentives to promote investment in dispatchable on-demand generation, and voters will consider funding to modernize generation measures this year to make the Texas grid more reliable and able to deal with power demand from a growing economy and increased demand for electricity driven by weather. In the meantime, ERCOT’s plan to procure 3,000 MW through this RFP process is a stopgap measure intended to bolster reliability for the upcoming winter season and lower the probability of load shed in the event of severe winter weather.

Related News

UK low-carbon electricity generation stalls in 2019

UK low-carbon electricity 2019 saw stalled growth as renewables rose slightly, wind expanded, nuclear output fell, coal hit record lows, and net-zero targets demand faster deployment to cut CO2 intensity below 100gCO2/kWh.


Key Points

Low-carbon sources supplied 54% of UK power in 2019, up just 1TWh; wind grew, nuclear fell, and coal dropped to 2%.

✅ Wind up 8TWh; nuclear down 9TWh amid outages

✅ Fossil fuels 43% of generation; coal at 2%

✅ Net-zero needs 15TWh per year added to 2030


The amount of electricity generated by low-carbon sources in the UK stalled in 2019, Carbon Brief analysis shows.

Low-carbon electricity output from wind, solar, nuclear, hydro and biomass rose by just 1 terawatt hour (TWh, less than 1%) in 2019. It represents the smallest annual increase in a decade, where annual growth averaged 9TWh. This growth will need to double in the 2020s to meet UK climate targets while replacing old nuclear plants as they retire.

Some 54% of UK electricity generation in 2019 came from low-carbon sources, including 37% from renewables and 20% from wind alone, underscoring wind's leading role in the power mix during key periods. A record-low 43% was from fossil fuels, with 41% from gas and just 2% from coal, also a record low. In 2010, fossil fuels generated 75% of the total.

Carbon Brief’s analysis of UK electricity generation in 2019 is based on figures from BM Reports and the Department for Business, Energy and Industrial Strategy (BEIS). See the methodology at the end for more on how the analysis was conducted.

The numbers differ from those published earlier in January by National Grid, which were for electricity supplied in Great Britain only (England, Wales and Scotland, but excluding Northern Ireland), including via imports from other countries.

Low-carbon low
In 2019, the UK became the first major economy to target net-zero greenhouse gas emissions by 2050, increasing the ambition of its legally binding Climate Change Act.

To date, the country has cut its emissions by around two-fifths since 1990, with almost all of its recent progress coming from the electricity sector.

Emissions from electricity generation have fallen rapidly in the decade since 2010 as coal power has been almost phased out and even gas output has declined. Fossil fuels have been displaced by falling demand and by renewables, such as wind, solar and biomass.

But Carbon Brief’s annual analysis of UK electricity generation shows progress stalled in 2019, with the output from low-carbon sources barely increasing compared to a year earlier.

The chart below shows low-carbon generation in each year since 2010 (grey bars) and the estimated level in 2019 (red). The pale grey bars show the estimated future output of existing low-carbon sources after old nuclear plants retire and the pale red bars show the amount of new generation needed to keep electricity sector emissions to less than 100 grammes of CO2 per kilowatt hour (gCO2/kWh), the UK’s nominal target for the sector.

 Annual electricity generation in the UK by fuel, terawatt hours, 2010-2019. Top panel: fuel by fuel. Bottom panel: cumulative total generation from all sources. Source: BEIS energy trends, BM Reports and Carbon Brief analysis. Chart by Carbon Brief using Highcharts.
As the chart shows, the UK will require significantly more low-carbon electricity over the next decade as part of meeting its legally binding climate goals.

The nominal 100gCO2/kWh target for 2030 was set in the context of the UK’s less ambitious goal of cutting emissions to 80% below 1990 levels by 2050. Now that the country is aiming to cut emissions to net-zero by 2050, that 100gCO2/kWh indicator is likely to be the bare minimum.

Even so, it would require a rapid step up in the pace of low-carbon expansion, compared to the increases seen over the past decade. On average, low-carbon generation has risen by 9TWh each year in the decade since 2010 – including a rise of just 1TWh in 2019.

Given scheduled nuclear retirements and rising demand expected by the Committee on Climate Change (CCC) – with some electrification of transport and heating – low-carbon generation would need to increase by 15TWh each year until 2030, just to meet the benchmark of 100gCO2/kWh.

For context, the 3.2 gigawatt (GW) Hinkley C new nuclear plant being built in Somerset will generate around 25TWh once completed around 2026. The world’s largest offshore windfarm, the 1.2GW Hornsea One scheme off the Yorkshire coast, will generate around 5TWh each year.

The new Conservative government is targeting 40GW of offshore wind by 2030, up from today’s figure of around 8GW. If policies are put in place to meet this goal, then it could keep power sector emissions below 100gCO2/kWh, depending on the actual performance of the windfarms built.

However, new onshore wind and solar, further new nuclear or other low-carbon generation, such as gas with carbon capture and storage (CCS), is likely to be needed if demand is higher than expected, or if the 100gCO2/kWh benchmark is too weak in the context of net-zero by 2050.

The CCC says it is “likely” to “reflect the need for more rapid deployment” of low-carbon towards net-zero emissions in its advice on the sixth UK carbon budget for 2033-2037, due in September.

Trading places
Looking more closely at UK electricity generation in 2019, Carbon Brief’s analysis shows why there was so little growth for low-carbon sources compared to the previous year.

There was another increase for wind power in 2019 (up 8TWh, 14%), with record wind generation as several large new windfarms were completed including the 1.2GW Hornsea One project in October and the 0.6GW Beatrice offshore windfarm in Q2 of 2019. But this was offset by a decline for nuclear (down 9TWh, 14%), due to ongoing outages for reactors at Hunterston in Scotland and Dungeness in Kent.

(Analysis of data held by trade organisation RenewableUK suggests some 0.6GW of onshore wind capacity also started operating in 2019, including the 0.2GW Dorenell scheme in Moray, Scotland.)

As a result of these movements, the UK’s windfarms overtook nuclear for the first time ever in 2019, becoming the country’s second-largest source of electricity generation, and earlier, wind and solar together surpassed nuclear in the UK as momentum built. This is shown in the figure below, with wind (green line, top panel) trading places with nuclear (purple) and gas (dark blue) down around 25% since 2010 but remaining the single-largest source.

 Annual electricity generation in the UK by fuel, terawatt hours, 2010-2019. Top panel: fuel by fuel. Bottom panel: cumulative total generation from all sources. Source: BEIS energy trends, BM Reports and Carbon Brief analysis. Chart by Carbon Brief using Highcharts.
The UK’s currently suspended nuclear plants are due to return to service in January and March, according to operator EDF, the French state-backed utility firm. However, as noted above, most of the UK’s nuclear fleet is set to retire during the 2020s, with only Sizewell B in Suffolk due to still be operating by 2030. Hunterston is scheduled to retire by 2023 and Dungeness by 2028.

Set against these losses, the UK has a pipeline of offshore windfarms, secured via “contracts for difference” with the government, at a series of auctions. The most recent auction, in September 2019, saw prices below £40 per megawatt hour – similar to current wholesale electricity prices.

However, the capacity contracted so far is not sufficient to meet the government’s target of 40GW by 2030, meaning further auctions – or some other policy mechanism – will be required.

Coal zero
As well as the switch between wind and nuclear, 2019 also saw coal fall below solar for the first time across a full year, echoing the 2016 moment when wind outgenerated coal across the UK, after it suffered another 60% reduction in electricity output. Just six coal plants remain in the UK, with Aberthaw B in Wales and Fiddlers Ferry in Cheshire closing in March.

Coal accounted for just 2% of UK generation in 2019, a record-low coal share since centralised electricity supplies started to operate in 1882. The fuel met 40% of UK needs as recently as 2012, but has plummeted thanks to falling demand, rising renewables, cheaper gas and higher CO2 prices.

The reduction in average coal generation hides the fact that the fuel is now often not required at all to meet the UK’s electricity needs. The chart below shows the number of days each year when coal output was zero in 2019 (red line) and the two previous years (blue).

 Cumulative number of days when UK electricity generation from renewable sources has been higher than that from fossil fuels. Source: BEIS energy trends, BM Reports and Carbon Brief analysis. Chart by Carbon Brief using Highcharts.
The 83 days in 2019 with zero coal generation amount to nearly a quarter of the year and include the record-breaking 18-day stretch without the fuel.

Great Britain has been running for a record TWO WEEKS without using coal to generate electricity – the first time this has happened since 1882.

The country’s grid has been coal-free for 45% of hours in 2019 so far.https://www.carbonbrief.org/countdown-to-2025-tracking-the-uk-coal-phase-out …

Coal generation was set for significant reductions around the world in 2019 – including a 20% reduction for the EU as a whole – according to analysis published by Carbon Brief in November.

Notably, overall UK electricity generation fell by another 9TWh in 2019 (3%), bringing the total decline to 58TWh since 2010. This is equivalent to more than twice the output from the Hinkley C scheme being built in Somerset. As Carbon Brief explained last year, falling demand has had a similar impact on electricity-sector CO2 emissions as the increase in output from renewables.

This is illustrated by the fact that the 9TWh reduction in overall generation translated into a 9TWh (6%) cut in fossil-fuel generation during 2019, with coal falling by 10TWh and gas rising marginally.

Increasingly renewable
As fossil-fuel output and overall generation have declined, the UK’s renewable sources of electricity have continued to increase. Their output has risen nearly five-fold in the past decade and their share of the UK total has increased from 7% in 2010 to 37% in 2019.

As a result, the UK’s increasingly renewable grid is seeing more minutes, hours and days during which the likes of wind, solar and biomass collectively outpace all fossil fuels put together, and on some days wind is the main source as well.

The chart below shows the number of days during each year when renewables generated more electricity than fossil fuels in 2019 (red line) and each of the previous four years (blue lines). In total, nearly two-fifths of days in 2019 crossed this threshold.

 Cumulative number of days when the UK has not generated any electricity from coal. Source: BEIS energy trends, BM Reports and Carbon Brief analysis. Chart by Carbon Brief using Highcharts.
There were also four months in 2019 when renewables generated more of the UK’s electricity than fossil fuels: March, August, September and December. The first ever such month came in September 2018 and more are certain to follow.

National Grid, which manages Great Britain’s high-voltage electricity transmission network, is aiming to be able to run the system without fossil fuels by 2025, at least for short periods. At present, it sometimes has to ask windfarm operators to switch off and gas plants to start running in order to keep the electricity grid stable.

Note that biomass accounted for 11% of UK electricity generation in 2019, nearly a third of the total from all renewables. Some two-thirds of the biomass output is from “plant biomass”, primarily wood pellets burnt at Lynemouth in Northumberland and the Drax plant in Yorkshire. The remainder was from an array of smaller sites based on landfill gas, sewage gas or anaerobic digestion.

The CCC says the UK should “move away” from large-scale biomass power plants, once existing subsidy contracts for Drax and Lynemouth expire in 2027.

Using biomass to generate electricity is not zero-carbon and in some circumstances could lead to higher emissions than from fossil fuels. Moreover, there are more valuable uses for the world’s limited supply of biomass feedstock, the CCC says, including carbon sequestration and hard-to-abate sectors with few alternatives.

Methodology
The figures in the article are from Carbon Brief analysis of data from BEIS Energy Trends chapter 5 and chapter 6, as well as from BM Reports. The figures from BM Reports are for electricity supplied to the grid in Great Britain only and are adjusted to include Northern Ireland.

In Carbon Brief’s analysis, the BM Reports numbers are also adjusted to account for electricity used by power plants on site and for generation by plants not connected to the high-voltage national grid. This includes many onshore windfarms, as well as industrial gas combined heat and power plants and those burning landfill gas, waste or sewage gas.

By design, the Carbon Brief analysis is intended to align as closely as possible to the official government figures on electricity generated in the UK, reported in BEIS Energy Trends table 5.1.

Briefly, the raw data for each fuel is in most cases adjusted with a multiplier, derived from the ratio between the reported BEIS numbers and unadjusted figures for previous quarters.

Carbon Brief’s method of analysis has been verified against published BEIS figures using “hindcasting”. This shows the estimates for total electricity generation from fossil fuels or renewables to have been within ±3% of the BEIS number in each quarter since Q4 2017. (Data before then is not sufficient to carry out the Carbon Brief analysis.)

For example, in the second quarter of 2019, a Carbon Brief hindcast estimates gas generation at 33.1TWh, whereas the published BEIS figure was 34.0TWh. Similarly, it produces an estimate of 27.4TWh for renewables, against a BEIS figure of 27.1TWh.

National Grid recently shared its own analysis for electricity in Great Britain during 2019 via its energy dashboard, which differs from Carbon Brief’s figures.


Related News

View more

Hydro One delivery rates go up

Hydro One Rate Hike reflects Ontario Energy Board approval for higher delivery charges, impacting seasonal customers more than residential classes, funding infrastructure upgrades like wood pole and transformer replacements across Ontario's medium-density service areas.


Key Points

The Hydro One rate hike is an OEB-approved delivery charge increase to fund upgrades, with impacts on seasonal users.

✅ OEB-approved delivery rate increases retroactive to 2018

✅ Seasonal customers see larger monthly bill impacts than residential

✅ Funds pole, transformer replacements and tree trimming work


Hydro One seasonal customers will face bigger increases in their bills than the utility's residential customers as a result of an Ontario Energy Board approval of a rate hike, a topic drawing attention from a utilities watchdog in other provinces as well.

Hydro One received permission to increase its delivery charge, as large projects like the Meaford hydro generation proposal are considered across Ontario, retroactive to last year.

It says it needs the money to maintain and upgrade its infrastructure, including efforts to adapt to climate change, much of which was installed in the 1950s.

The utility is notifying customers that new statements reflect higher delivery rates which were not charged in 2018 and the first half of this year, due to delay in receiving the OEB's permission, similar to delays that can follow an energy board recommendation in other jurisdictions.

The amount that customers' bills will increase by depends not only on how much electricity they use, but also on which rate class they belong to, as well as policy decisions affecting remote connections such as the First Nations electricity line in northern Ontario.

For seasonal customers such as summer cottage owners, the impact on a typical user's bill will be 2.9 per cent more per month for 2018, and 1.7 per cent per month for 2019.

There will be further increases of 1.0 per cent, 1.4 per cent and 1.1 per cent per month in 2020, 2021 and 2022 respectively. 

Typical residential customers will experience smaller increases or rate freezes over the same period.

In the residential medium density class, the rate changes are a 2.0 per cent increase for last year, a decrease of 0.5 per cent this year, and an increase of 0.5 per cent in 2021. There will be no increases in 2020 and 2022.


Seasonal Rate Class — Estimated bill impact per month

2018 - 2.9 %

2019 - 1.7%

2020 - 1.0%

2021 - 1.4%

2022 - 1.1%


Residential Medium Density Rate Class — Estimated bill impact per month

2018 - 2.0%

2019 - -0.5% decrease

2020 - 0.0%

2021 - 0.5%

2022 - 0.0%

A Hydro One spokesperson told tbnewswatch.com that over the next three years, the utility's upgrading plan includes reliability investments such as replacing more than 24,000 wood poles across the province as well as numerous transformers.

In the Thunder Bay area, the spokesperson said, some of the revenue generated by the higher delivery rates will cover the cost of replacing more than 180 poles and trimming hazardous trees around 3,200 kilometres of overhead power lines while sharing electrical safety tips with customers.


Related News

View more

California Blackouts reveal lapses in power supply

California Electricity Reliability covers grid resilience amid heat waves, rolling blackouts, renewable energy integration, resource adequacy, battery storage, natural gas peakers, ISO oversight, and peak demand management to keep homes, businesses, and industry powered.


Key Points

Dependable California power delivery despite heat waves, peak demand, and challenges integrating renewables into grid.

✅ Rolling blackouts revealed gaps in resource adequacy.

✅ Early evening solar drop requires fast ramping and storage.

✅ Agencies pledge planning reforms and flexible backup supply.


One hallmark of an advanced society is a reliable supply of electrical energy for residential, commercial and industrial consumers. Uncertainty that California electricity will be there when we need it it undermines social cohesion and economic progress, as demonstrated by the travails of poor nations with erratic energy supplies.

California got a small dose of that syndrome in mid-August when a record heat wave struck the state and utilities were ordered to impose rolling blackouts to protect the grid from melting down under heavy air conditioning demands.

Gov. Gavin Newsom quickly demanded that the three overseers of electrical service to most of the state - the Public Utilities Commission, the Energy Commission and the California Independent Service Operator – explain what went wrong.

"These blackouts, which occurred without prior warning or enough time for preparation, are unacceptable and unbefitting of the nation's largest and most innovative state," Newsom wrote. "This cannot stand. California residents and businesses deserve better from their government."

Initially, there was some fingerpointing among the three entities. The blackouts had been ordered by the California Independent System Operator, which manages the grid and its president, Steve Berberich, said he had warned the Public Utilities Commission about the potential supply shortfall facing the state.

"We have indicated in filing after filing after filing that the resource adequacy program was broken and needed to be fixed," he said. "The situation we are in could have been avoided."

However, as political heat increased, the three agencies hung together and produced a joint report that admitted to lapses of supply planning and grid management and promised steps to avoid a repeat next summer.

"The existing resource planning processes are not designed to fully address an extreme heat storm like the one experienced in mid August," their report said. "In transitioning to a reliable, clean and affordable resource mix, resource planning targets have not kept pace to lead to sufficient resources that can be relied upon to meet demand in the early evening hours. This makes balancing demand and supply more challenging."

Although California's grid had experienced greater heat-related demands in previous years, most notably 2006, managers then could draw standby power from natural gas-fired plants and import juice from other Western states when necessary.

Since then, the state has shut down a number of gas-fired plants and become more reliant on renewable but less reliable sources such as windmills and solar panels.

August's air conditioning demand peaked just as output from solar panels was declining with the setting of the sun and grid managers couldn't tap enough electrons from other sources to close the gap.

While the shift to renewables didn't, unto itself, cause the blackouts, they proved the need for a bigger cushion of backup generation or power storage in batteries or some other technology. The Public Utilities Commission, as Beberich suggested, has been somewhat lax in ordering development of backup supply.

In the aftermath of the blackouts, the state Water Resources Control Board, no doubt with direction from Newsom's office, postponed planned shutdowns of more coastal plants, which would have reduced supply flexibility even more.

Shifting to 100% renewable electricity, the state's eventual goal, while maintaining reliability will not get any easier. The state's last nuclear plant, Diablo Canyon, is ticketed for closure and demand will increase as California eliminates gasoline- and diesel-powered vehicles in favor of "zero emission vehicles" as part of its climate policies push and phases out natural gas in homes and businesses.

Politicians such as Newsom and legislators in last week's blackout hearing may endorse a carbon-free future in theory, but they know that they'll pay the price as electricity prices climb if nothing happens when Californians flip the switch.


Related News

View more

Sycamore Energy taking Manitoba Hydro to court, alleging it 'badly mismanaged' Solar Energy Program

Sycamore Energy Manitoba Hydro Lawsuit centers on alleged mismanagement of the solar rebate incentive program, project delays, inspection backlogs, and alleged customer interference, impacting renewable energy installations, contractors, and clean power investment across Manitoba.


Key Points

Claim alleging mismanagement of Manitoba's solar rebate, delays, and inducing customers to switch installers.

✅ Lawsuit alleges mismanaged solar rebate incentive program

✅ Delays in inspections left hundreds of projects incomplete

✅ Claims Hydro urged customers to switch installers for rebates


Sycamore Energy filed a statement of claim Monday in Manitoba Court of Queens Bench against Manitoba Hydro saying it badly mismanaged its Solar Energy Program, a dispute that comes as Canada's solar progress faces criticism nationwide.

The claim also noted the crown corporation caused significant financial and reputational damage to Sycamore Energy, echoing disputes like Ontario wind cancellation costs seen elsewhere.

The statement of claim says Manitoba Hydro was telling customers to find other companies to complete solar panel installations, even as Nova Scotia's solar charge debate has unfolded.

'I'm still waiting': dozens of Manitoba solar system installations in the queue under expired incentive program
This all comes after a pilot project was launched in the province in April 2016, which would allow people to apply for a rebate under the incentive program, while Saskatchewan adjusted solar credits in parallel, and the project would cover about 25 per cent of the installation costs.

The project ended in April 2018, but hundreds of approved projects had yet to be finished.

According to Manitoba Hydro, in November there were 252 approved projects awaiting completion by more than one contractor, and Sycamore Energy said it had about 100 of those projects, a dynamic seen as New England's solar growth strains grid upgrades in other regions.

At the time Sycamore Energy COO, Alex Stuart, blamed Manitoba Hydro for the delays, stating it took too long to get inspections after solar systems were installed.

Scott Powell, Manitoba Hydro’s director of corporate communications, said in November he disagreed with Sycamore Energy’s comments, even as Ontario moves to reintroduce renewables elsewhere.

In a news release, the company said it sold more installations under Manitoba Hydro’s Solar Energy Program compared to other companies and it was instrumental in helping set up standards for the program.

“Manitoba Hydro mismanaged the solar rebate program from the beginning. In the end, they targeted our company unfairly and unlawfully by inducing our customers to break their contracts with us. Manitoba Hydro told our customers they could get an extension to their rebate but only if they switched to different installers,” said Justin Phillips, CEO of Sycamore Energy in a news release.

“We would much rather be installing clean, effective solar power projects for our customers right now. The last thing we want to do is to be suing Manitoba Hydro, but we feel we have no choice. Their actions have cost us millions in lost business. They’ve also cost the province jobs, millions in private investment and a positive way forward to help combat climate change.”

Manitoba Hydro now has 20 days to respond to the action, and a recent Cornwall wind-farm ruling underscores the stakes.

When asked for a response from CTV News, a spokesperson for the Crown corporation said it hadn’t yet been made aware of the suit.

“If a statement of claim is filed and served, we’ll file a statement of defence in due course. As this matter is now apparently before the courts, we have no further comment,” the spokesperson said.

None of these allegations have been proven in court.


Related News

View more

Solar-powered pot: Edmonton-area producer unveils largest rooftop solar array

Freedom Cannabis solar array powers an Acheson cannabis facility with 4,574 rooftop panels, a 1,830-kilowatt system by Enmax, cutting greenhouse gas emissions, lowering energy costs, and advancing renewable energy, sustainability, and operational efficiency in Edmonton.


Key Points

A 1,830-kW rooftop solar system with 4,574 panels, cutting GHG emissions and energy costs at the Acheson facility.

✅ 1,830-kW array offsets 1,000+ tonnes GHG annually

✅ Supplies ~8% of annual power; saves $200k-$300k per year

✅ 4,574 rooftop panels installed by Enmax in Acheson


Electricity consumption is one of the biggest barriers to going green in the cannabis industry, where the energy demands of cannabis cultivation often complicate sustainability, but an Edmonton-area pot producer has come up with a sunny solution.

Freedom Cannabis unveiled the largest rooftop solar system used by a cannabis facility in Canada at its 126,000-square foot Acheson location, 20 kilometres west of Edmonton, as solar power in Alberta continues to surge, on Tuesday.

The "state-of-the-art" 1,830-kilowatt solar array—made up of 4,574 panels—was supplied by Enmax and will offset more than 1,000 tonnes of greenhouse gas emissions each year, reflecting how new Alberta solar facilities are undercutting natural gas on price, the company said.

The state-of-the-art solar array—made up of 4,574 panels—was supplied by Enmax and will offset more than 1,000 tonnes of greenhouse gas emissions at Freedom Cannabis every year. Nov. 12, 2019. (Freedom Cannabis)

That will supply roughly eight per cent of the building's annual power consumption and reduce costs by $200,000 to $300,000 annually.

"This strategy will supplement our operating costs for power by up to eight to 10 per cent, so it is something that in time will save us costs on power requirements," said Troy Dezwart, co-founder of Freedom Cannabis.

Dezwart said sustainability was an important issue to the company from its outset, aligning with an Alberta renewable energy surge that is expected to power thousands of jobs.

"We're fortunate enough to be able to have these types of options and pursue them," said Dezwart.

The entire system cost Freedom Cannabis $2.6 million to build, but nearly a million of that came from a provincial rebate program that has since been cancelled by the UCP government, even as a federal green electricity deal with an Edmonton company signals ongoing support.

The company cited a 2017 report that found cannabis growers in the U.S. used enough electricity to power 1.7-million homes, and said cannabis-related power consumption is expected to increase by 1,250 per cent in Ontario over the next five years, even though Canadian solar demand has been lagging overall.

“It’s more important than ever for businesses to manage their energy footprint, and solar is an important part of that solution,” Enmax director Jason Atkinson, said. “This solar installation will help reduce operating costs and offset a significant portion of GHG emissions for decades to come.”

Freedom says it has other initiatives underway to reduce its footprint, in a region planning the Edmonton airport solar farm among other projects, including water remediation and offering 100 per cent recyclable cannabis packaging tins.

The company's first crops are expected to go to market in December.


Related News

View more

Energy dashboard: how is electricity generated in Great Britain?

Great Britain electricity generation spans renewables and baseload: wind, solar, nuclear, gas, and biomass, supported by National Grid interconnectors, embedded energy estimates, and BMRS data for dynamic imports and exports across Europe.


Key Points

A diverse, weather-driven mix of renewables, gas, nuclear, and imports coordinated by National Grid.

✅ Baseload from nuclear and biomass; intermittent wind and solar

✅ Interconnectors trade zero carbon imports via subsea cables

✅ Data from BMRS and ESO covers embedded energy estimates


Great Britain has one of the most diverse ranges of electricity generation in Europe, with everything from windfarms off the coast of Scotland to a nuclear power station in Suffolk tasked with keeping the lights on. The increasing reliance on renewable energy sources, as part of the country’s green ambitions, also means there can be rapid shifts in the main source of electricity generation. On windy days, most electricity generation comes from record wind generation across onshore and offshore windfarms. When conditions are cold and still, gas-fired power stations known as peaking plants are called into action.

The electricity system in Great Britain relies on a combination of “baseload” power – from stable generators such as nuclear and biomass plants – and “intermittent” sources, such as wind and solar farms that need the right weather conditions to feed energy into the grid. National Grid also imports energy from overseas, through subsea cables known as interconnectors that link to France, Belgium, Norway and the Netherlands. They allow companies to trade excess power, such as renewable energy created by the sun, wind and water, between different countries. By 2030 it is hoped that 90% of the energy imported by interconnectors will be from zero carbon energy sources, though low-carbon electricity generation stalled in 2019 for the UK.

The technology behind Great Britain’s power generation has evolved significantly over the last century, and at times wind has been the main source of electricity. The first integrated national grid in the world was formed in 1935 linking seven regions of the UK. In the aftermath of industrialisation, coal provided the vast majority of power, before oil began to play an increasingly important part in the 1950s. In 1956, the world’s first commercial nuclear reactor, Calder Hall 1 at Windscale (later Sellafield), was opened by Queen Elizabeth II. Coal use fell significantly in the 1990s while the use of combined cycle gas turbines grew, and in 2016 wind generated more electricity than coal for the first time. Now a combination of gas, wind, nuclear and biomass provide the bulk of Great Britain’s energy, with smaller sources such as solar and hydroelectric power also used. From October 2024, coal will no longer be used to generate electricity, following coal-free power records set in recent years.

Energy generation data is fetched from the Balancing Mechanism Reporting Service public feed, provided by Elexon – which runs the wholesale energy market – and is updated every five minutes, covering periods when wind led the power mix as well.

Elexon’s data does not include embedded energy, which is unmetered and therefore invisible to Great Britain’s National Grid. Embedded energy comprises all solar energy and wind energy generated from non-metered turbines. To account for these figures we use embedded energy estimates from the National Grid electricity system operator, which are published every 30 minutes.

Import figures refer to the net flow of electricity from the interconnectors with Europe and with Northern Ireland. A positive value represents import into the GB transmission system, while a negative value represents an export.

Hydro figures combine renewable run-of-the-river hydropower and pumped storage.

Biomass figures include Elexon’s “other” category, which comprises coal-to-biomass conversions and biomass combined heat and power plants.


Related News

View more

Sign Up for Electricity Forum’s Newsletter

Stay informed with our FREE Newsletter — get the latest news, breakthrough technologies, and expert insights, delivered straight to your inbox.

Electricity Today T&D Magazine Subscribe for FREE

Stay informed with the latest T&D policies and technologies.
  • Timely insights from industry experts
  • Practical solutions T&D engineers
  • Free access to every issue

Live Online & In-person Group Training

Advantages To Instructor-Led Training – Instructor-Led Course, Customized Training, Multiple Locations, Economical, CEU Credits, Course Discounts.

Request For Quotation

Whether you would prefer Live Online or In-Person instruction, our electrical training courses can be tailored to meet your company's specific requirements and delivered to your employees in one location or at various locations.