Tampa Electric invests in peaking power units

By Business Wire


NFPA 70e Training

Our customized live online or in‑person group training can be delivered to your staff at your location.

  • Live Online
  • 6 hours Instructor-led
  • Group Training Available
Regular Price:
$199
Coupon Price:
$149
Reserve Your Seat Today
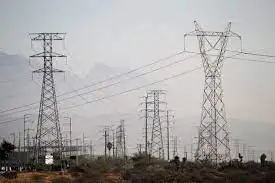
Tampa Electric announced that the company will install five new 60-megawatt (MW) peaking units to serve its growing service territory. The new peaking units will provide power during periods of peak customer demand in a reliable and environmentally friendly manner.

Four of the units will be single-fuel natural gas and will be located on the site of the existing Bayside Power Station in Tampa. One dual-fuel (natural gas and fuel oil) unit will be located at the Big Bend Power Station in Apollo Beach. The simple-cycle turbines are expected to be in commercial operation by the fourth quarter of 2009 and will provide power to approximately 65,000 homes on a winter peak day.

“The $237 million total project investment includes these new peaking units that will provide Tampa Electric with the flexibility to meet the growing needs of our customers in a safe, reliable and cost-effective manner, while continuing to meet our environmental responsibilities,” said Chuck Black, president.

The new peaking units will be equipped with black start capability. Black start capability will allow power from the peaking units to be used to start the other larger generating units at each of the stations, should power from the system not be readily available.

The Bayside Power Station, part of a more than $1.2 billion 10-year environmental program, is an 1,800-MW natural gas-fired power station that was built when the company retired its coal-fired Gannon Power Station.

The Big Bend Power Station is currently installing state-of-the-art selective catalytic reduction (SCR) equipment to further reduce the plantÂ’s emission levels, also part of the $1.2 billion environmental program. When the $330 million SCR project is completed in 2010, the approximately 1,700-MW Big Bend Station will be one of the cleanest pulverized coal power plants in the country.

Tampa Electric recently completed its Chicago Climate Exchange Phase I greenhouse gas reduction commitment. With an actual system-wide reduction of 20 percent, the company far surpassed the CCX Phase I requirement of 4 percent below the average of the years 1998-2001. The Chicago Climate Exchange (CCX), launched in 2003, is the worldÂ’s first and North AmericaÂ’s only active voluntary, legally binding integrated trading system to reduce emissions of all six major greenhouse gases (GHGs), with offset projects worldwide.

Emissions reductions across Tampa Electric's generating fleet have been the cornerstone of the $1.2 billion environmental commitment the company made in 1999. Compared to 1998 levels, Tampa Electric reduced overall sulfur dioxide emissions by 93 percent and nitrogen oxide emissions by 60 percent (90 percent by 2010). By the same comparison, the company also reduced overall mercury and particulate matter emissions by more than 70 percent. These reductions, in addition to the fact that the company cut carbon dioxide emissions by 23 percent since 1998, have helped establish Tampa Electric as an industry leader in emissions reductions.

To complement and reduce the need for conventional generation, Tampa Electric continues to focus on partnering with customers to increase their energy efficiency. In October 2007 the company received permission from the Florida Public Service Commission to expand its existing portfolio of energy efficiency programs by adding 13 new programs and modifying nine existing programs. Almost 400,000 customers have participated in Tampa ElectricÂ’s conservation programs to date.

From 1979 to 2007, the companyÂ’s conservation programs have offset the need to generate enough electricity to serve more than 550,000 average-size homes over a 12-month period.

Tampa Electric is also in the final stages of evaluating responses to its request for proposals for 150 megawatts of energy from renewable sources.

Related News

Biggest in Canada: Bruce Power doubles PPE donation

Bruce Power PPE Donation supports Canada COVID-19 response, supplying 1.2 million masks, gloves, and gowns to Ontario hospitals, long-term care, and first responders, plus face shields, hand sanitizer, and funding for testing and food banks.


Key Points

Bruce Power PPE Donation is a broad COVID-19 aid delivering PPE, supplies, and funding across Ontario.

✅ 1.2 million masks, gloves, gowns to Ontario care providers

✅ 3-D printed face shields and 50,000 bottles of sanitizer

✅ Funding testing research and supporting regional food banks


The world’s largest nuclear plant, which recently marked an operating record during sustained operations, just made Canada’s largest donation of personal protective equipment (PPE).

Bruce Power is doubling its initial donation of 600,000 masks, gloves and gowns for front-line health workers, to 1.2 million pieces of PPE.

The company, which operates the Bruce Nuclear station near Kincardine, Ont., where a major reactor refurbishment is underway, plans to have the equipment in the hands of hospitals, long-term care homes and first responders by the end of April.

It’s not the only thing Bruce Power is doing to help out Ontario during the COVID-19 pandemic:

 Bruce Power has donated $300,000 to 37 food banks in Midwestern Ontario, highlighting the broader economic benefits of Canadian nuclear projects for communities.

  •  They’re also working with NPX in Kincardine to make face shields with 3-D printers, leveraging local manufacturing contracts to accelerate production.
  •  They’re teaming up with the Power Worker’s Union to fund testing research in Toronto.
  •  They’re working with Three Sheets Brewing and Junction 56 Distillery to distribute 50,000 bottles of hand sanitizer to those that need it.

And that’s all on top of what they’ve been doing for years, producing Cobalt-60, a medical isotope to sterilize medical equipment, and, after a recent output upgrade at the site, producing about 30 per cent of Ontario’s electricity as the province advances the Pickering B refurbishment to bolster grid reliability.

Bruce Power has over 4,000 employees working out of their nuclear plant, on the shores of Lake Huron, as it explores the proposed Bruce C project for potential future capacity.


Related News

View more

Learn how fees and usage impacts your electricity bill in new online CER tool

CER Interactive Electricity Bill Tool compares provincial electricity prices, fees, taxes, and usage. Explore household appliance costs, hydroelectric generation, and consumption trends across Canada with interactive calculators and a province-by-province breakdown.


Key Points

An online CER report with calculators comparing electricity prices, fees, and usage to explain household energy costs.

✅ Province-by-province bill, price, and consumption comparison

✅ Calculator for appliance and electronics energy costs

✅ Explains fees, taxes, regulation, and generation sources


Canadians have a new way to assess their electricity bill in a new, interactive online report released by the Canada Energy Regulator (CER).

The report titled What is in a residential electricity bill? features a province-to-province comparison of electricity bills, generation and consumption. It also explains electricity prices across the country, including how Calgary electricity prices have changed, allowing people to understand why costs vary depending on location, fees, regulation and taxes.  

Learn how fees and usage impacts your electricity bill in new online CER tool
Interactive tools allow people to calculate the cost of household appliances and electronic use for each province and territory, and to understand how Ontario rate increases may affect monthly bills. For example, an individual can use the tools to find out that leaving a TV on for 24-hours in Quebec costs $5.25 per month, while that same TV on for a whole day would cost $12.29 per month in Saskatchewan, $20.49 per month in the Northwest Territories, and $15.30 per month in Nova Scotia.

How Canadians use energy varies as much as how provinces and territories produce it, especially in regions like Nunavut where unique conditions influence costs. Millions of Canadians rely on electricity to power their household appliances, charge their electronics, and heat their homes. Provinces with abundant hydro-electric resources like Quebec, B.C., Manitoba, and Newfoundland and Labrador use electricity for home heating and tend to consume the most electricity.

By gathering data from various sources, this report is the first Canadian publication that features interactive tools to allow for a province-by-province comparison of electricity bills while highlighting different elements within an electricity bill, a helpful context as Canada faces a critical supply crunch in the years ahead.

The CER monitors energy markets and assesses Canadian energy requirements and trends, including clean electricity regulations developments that shape pricing. This report is part of a portfolio of publications on energy supply, demand and infrastructure that the CER publishes regularly as part of its ongoing market monitoring.

"No matter where you go in the country, Canadians want to know how much they pay for power and why, especially amid price spikes in Alberta this year," says lead author Colette Craig. "This innovative, interactive report really explains electricity bills to help everyone understand electricity pricing and consumption across Canada."

Quick Facts

  • Quebec ranks first in electricity consumption per capita at 21.0 MW.h, followed by Saskatchewan at 20.0 MW.h, Newfoundland and Labrador at 19.3 MW.h.
  • About 95% of Quebec's electricity is produced from hydroelectricity.
  • Provinces that use electricity for home heating tend to consume the most electricity.
  • Canada's largest consuming sector for electricity was industrial at 238 TW.h. The residential and commercial sectors consumed 168 TW.h and 126 TW.h, respectively.
  • In 2018, Canada produced 647.7 terawatt hours (TW.h) of electricity. More than half of the electricity in Canada (61%) is generated from hydro sources. The remainder is produced from a variety of sources, such as fossil fuels (natural gas and petroleum), nuclear, wind, coal, biomass, solar.
  • Canada is a net exporter of electricity. In 2019, net exports to the U.S. electricity market totaled 47.0 TW.h.
  • The total value of Canada's electricity exports was $2.5 billion Canadian dollars and the value of imports was $0.6 billion Canadian dollars, resulting in 2019 net exports of $1.9 billion.
  • All regions in Canada are reflected in this report but it does not include data that reflects the COVID-19 lockdown and its effects on residential electricity bills.


Related News

View more

COVID-19 closures: It's as if Ottawa has fallen off the electricity grid

Ontario Electricity Demand Drop During COVID-19 reflects a 1,000-2,000 MW decline as IESO balances the grid, shifts peak demand later, throttles generators and baseload nuclear, and manages exports amid changing load curves.


Key Points

An about 10% reduction in Ontario's load, shifting peaks and requiring IESO grid balancing measures.

✅ Demand down 1,000-2,000 MW; roughly 10% below normal.

✅ Peak shifts later in morning as home use rises.

✅ IESO throttles generators; baseload nuclear stays online.


It’s as if the COVID-19 epidemic had tripped a circuit breaker, shutting off all power to a city the size of Ottawa.

Virus-induced restrictions that have shut down large swaths of normal commercial life across Canada has led to a noticeable drop in demand for power in Ontario and reflect a global demand dip according to reports, insiders said on Friday.

Terry Young, vice-president with the Independent Electricity System Operator, said planning was underway for further declines in usage and for whether Ontario will embrace more clean power in the long term, given the delicate balance that needs to be maintained between supply and demand.

“We’re now seeing demand that is running about 1,000 to 2,000 megawatts less than we would normally see,” Young said. “You’re essentially seeing a city the size of Ottawa drop off demand during the day.”

At the high end, a 2,000 megawatt reduction would be close to the equivalent peak demand of Ottawa and London, Ont., combined.

The decline, in the order of 10 per cent from the 17,000 to 18,000 megawatts of usage that might normally be expected and similar to the UK’s 10% drop reported during lockdowns, began last week, Young said. The downward trend became more noticeable as governments and health authorities ordered non-essential businesses to close and people to stay home. However, residential and hospital usage has climbed.

Experts say frequent hand-washing and staying away from others is the most effective way to curb the spread of the highly contagious coronavirus, which poses a special risk to older people and those with underlying health conditions. As a result, factories and other big users have reduced production or closed entirely.

Because electricity cannot be stored, generators need to throttle back their output as domestic demand shrinks and exports to places such as the United States, including New York City, which is also being hit hard by the coronavirus, fall.

“We’re watching this carefully,” Young said. “We’re able to manage this drop, but it’s something we obviously have to keep watching…and making sure we’re not over-generating electricity.”

Turning off generation, especially for nuclear plants, is an intensive process, as are restarts and would likely happen only if the downward demand trend intensifies significantly, amid concerns over Ontario’s electricity getting dirtier if baseload is displaced. However, one of North America’s largest generators, Bruce Power near Kincardine, Ont., said it had a large degree of flexibility to scale down or up.

“We have the ability to provide one-third of our output as a dynamic response, which is unique to our facility,” said James Scongack, an executive vice-president with Bruce Power. “We developed this coming out of the 2008 downturn and it’s been a critical system asset for the last decade.”

“We don’t see there being a scenario where our baseload will not be needed,” he said, even as some warn Ontario may be short of electricity in the coming years.

The province’s publicly owned Ontario Power Generation said it was also in conversations with the system operator, which provides direction to generators, and is often cited in the Ontario election discussion.

One clear shift in normal work-day usage with so many people staying at home has been the change in demand patterns. Typically, Young said, there’s a peak from about 7 a.m. to 8 a.m. as people wake and get ready to go to work or school. The peak is now occurring later in the morning, Young said.


Related News

View more

Manitoba Hydro scales back rate increase next year

Manitoba Hydro 3.5 Percent Rate Increase proposes a smaller electricity rate hike under Public Utilities Board oversight to bolster financial reserves, address debt and Bipole III costs, amid shifting export sales and water flow conditions.


Key Points

It is Manitoba Hydro's proposed 3.5% electricity rate hike for 2019-20 to shore up finances under PUB oversight.

✅ PUB review sought without lengthy hearing

✅ Revenue boost forecast at 59 million dollars

✅ Natural gas rates flat; class shifts adjust bills


Manitoba Hydro is scaling back its rate hike request for next year, instead of the annual 7.9 per cent hikes the Crown corporation previously said it would need until 2023-24 to address debt. 

Hydro is asking the Public Utilities Board for a 3.5 per cent rate increase next year, which would take effect on April 1.

In last week's application, Hydro said its new board is reviewing the corporation's financial picture. Once that is complete, the utility expects to submit a new multi-year rate plan in late 2019 that addresses the organization's long-term future.

"It's too speculative at this point to discuss any possible future rate increases," spokesperson Bruce Owen said in an email.

The proposed increase next year is similar to other jurisdictions and nearly in line with the Public Utilities Board's decision to allow an average 3.6 per cent jump in electricity rates in 2018-19, which began this summer.

"The requested 3.5 per cent rate increase … generates a modest level of net income under average water flow conditions that will assist in gradually building the revenue base and reduce the risk of the corporation incurring a loss" in 2019-20, the rate application said.

If approved, consumers would face their second rate increase from Hydro in under a year.

Crown Services Minister Colleen Mayer said she's sympathetic to customers bracing for another rate increase amid NL rate hike concerns that far exceeds the rate of inflation.

"I hear that, very clearly," she said. "The NDP left us with an insurmountable problem — we're trying to fix that."

Hydro goes to court over special rate class for First Nations residents in Manitoba

National Energy Board OK's Manitoba-Minnesota Transmission Project

Next year's rate increase is projected to bring in $59 million of revenue, boosting the Crown corporation's financial reserves by $31 million.

Without it, the utility would deal with a net loss, it said.

This time, Hydro officials are asking PUB to forgo a rate hearing, suggesting neither itself nor the board has the resources for a lengthy six- to nine-month process to review an application where not much has changed financially and would generate a "minimum level of net income," Hydro said in a letter to the board.

The short-term rate relief, the letter recommends, should be "awarded in a timely and cost-effective manner, recognizing that the corporation's long-term financial forecasts will be finalized and available for review" in late 2019.

Hydro's net income next year will be lower than projected, the rate application said, due to a reduction in export sales and increases in depreciation and financing costs from Bipole III.

"Even though they had a total implosion of their previous board, on this very issue, they haven't learned lessons and they continue to be cheerleaders for these rapid rate increases," Kinew said, referring to the exodus of every board member but one earlier this year.

Manitoba Hydro's burgeoning debt surpasses $19 billion

On natural gas, Manitoba Hydro is asking PUB for no rate increase for the next two years.

There will, however, be some changes in rates in different customer classes, Owen said, resulting in modest rate reductions for mainly residential customers and increases for customers who use a lot of natural gas.

The corporation also wants to stop collecting fees to support the furnace replacement program. The initiative will continue with existing fees.


Related News

View more

Covid-19: Secrets of lockdown lifestyle laid bare in electricity data

Lockdown Electricity Demand Trends reveal later mornings, weaker afternoons, and delayed peaks as WFH, streaming, and video conferencing reshape energy demand curves, grid forecasting, and residential electricity usage across Europe, New York, Tokyo, and Singapore.


Key Points

Shifts in power use during lockdowns: later ramps, weaker afternoons, and higher, delayed evening peaks.

✅ Morning ramp starts later; midday demand dips

✅ Evening peak shifts 1-2 hours; higher late-night usage

✅ WFH and streaming raise residential load; industrial demand falls


Life in lockdown means getting up late, staying up till midnight and slacking off in the afternoons.

That’s what power market data in Europe show in the places where restrictions on activity have led to a widespread shift in daily routines of hundreds of millions of people.

It’s a similar story wherever lockdowns bite. In New York City electricity use has fallen as much as 18% from normal times at 8am. Tokyo and three nearby prefectures had a 5% drop in power use during weekdays after Japan declared a state of emergency on April 7, according to Tesla Asia Pacific, an energy forecaster.

Italy’s experience shows the trend most clearly since the curbs started there on March 5, before any other European country. Data from the grid operator Terna SpA gives a taste of what other places are also now starting to report, with global daily demand dips observed in many markets as well.


1. People are sleeping later

With no commute to the office people can sleep longer. Normally, electricity demand began to pick up between 6 a.m. and 8 a.m. Now in Germany, it’s clear coffee machines don’t go on until between 8 a.m. and 9 a.m., said Simon Rathjen, founder of the trading company MFT Energy A/S.

Germany, France and Italy -- which between them make up almost two thirds of the euro-zone economy -- all have furlough measures that allow workers to receive a salary while temporarily suspended from their jobs. The U.K. also has a support package. Many of these workers will be getting up later.

"Now I have quite a relaxed start to the morning,” said David Freeman, an analyst in financial services from London. "I don’t get up until about half an hour before I need to start work.”

2. Less productive afternoons

There is a deeper dip in electricity use in the afternoons. Previously, power use rose between 2pm and 5pm. Now it dips as people head out for a walk or some air, according to UK demand data from National Grid Plc

It’s "as though we are living through a month of Sundays”, said Iain Staffell, senior lecturer in sustainable energy at Imperial College London.

3. Evenings in

From 6pm electricity use begins to rise steeply as people finish work and start chores. Restrictions like work and home schooling that prevent much daytime TV watching lifts in the early evening. This following chart for Germany shows the evening peak for power use coming during later hours.

The evening is when electricity use is highest, with most people confined to their homes. Netflix Inc reported a record 15.8 million paid subscribers – almost double the figure forecast by Wall Street analysts. Video-streaming services like Netflix and YouTube have found a captive audience. The new Disney+ service surpassed 50 million subscribers in just five months, a faster pace than predicted.

Internet traffic is skyrocketing, with a surge in bandwidth-intensive applications like streaming services and Zoom. This may mean that monthly broadband consumption of as much as 600 gigabytes, about 35% higher than before, according to Bloomberg Intelligence.

In Singapore, electricity use has dropped off significantly since the country’s "circuit-breaker” efforts to keep people at home began April 7. Electricity use has fallen and stayed low during the day. But late at night is a different story, as power demand fell sharply immediately after the lockdown began, it has steadily crept back in the past two weeks, perhaps a sign that Tiger King and The Last Dance have been finding late-night fans in the city state.

In Ottawa, COVID-19 closures made it seem as if the city had fallen off the electricity grid, according to local reports.

4. Staying up late

We’re going to bed later too. Demand doesn’t start to drop off until 10pm to 12am, at least an hour later than before.

"My children are definitely going to bed later,” said Liz Stevens, a teaching assistant from London. "Our whole routine is out the window.”

It’s challenging for those that need to predict behaviour – power grids and electricity traders. Forecasting is based on historical data, and there isn’t anything to go into the models gauging use now.

The closest we can get is looking at big events like football World Championships when people are all sitting down at the same time, according to Rathjen at MFT.

"Forecasting demand right now is very tricky,” said Chris Kimmett, director of power grids at Reactive Technologies Ltd. "A global pandemic is uncharted territory."

What normal looks like when the crisis passes is also an open question. Different countries are set to unravel their measures in their own ways, and global power demand has already surged above pre-pandemic levels in some analyses, with Germany and Austria loosening restrictions first and Italy remaining under tight control. Some changes may be permanent, with both workers and employers becoming more comfortable with working from home.

5. Different sectors consume more

In China, which is further along recovering from the pandemic than Europe or the US, the sharp contraction in overall power output masks a shift in daily routines.

Eating habits have changed. Restaurants are expanding delivery and even offering grocery services as the preference for dining at home persists. Household electricity consumption in China probably increased from activities such as cooking and heating, according to IHS Markit, which said that residential demand rose by 2.4% in the first two months as people stayed in.

The increase in technology use also drove China’s power demand from the telecom and web-service sectors to rise by 27%, the consultancy said.

Overall, China power demand in the first quarter of the year fell 6.5% from the same period in 2019 to 1.57 trillion kilowatt-hours, China’s National Energy Administration said last week. Industry uses about 70% of the country’s electricity, while the commercial sector and households account for 14% each. – Bloomberg


Related News

View more

Why the Texas Power Grid Is Facing Another Crisis

Texas Power Grid Reliability faces record peak demand as ERCOT balances renewable energy, wind and solar variability, gas-fired generation, demand response, and transmission limits to prevent blackouts during heat waves and extreme weather.


Key Points

Texas Power Grid Reliability is ERCOT's capacity to meet peak demand with diverse resources while limiting outages.

✅ Record heat drives peak demand across ERCOT.

✅ Variable wind/solar need firm, flexible capacity.

✅ Demand response and reserves reduce blackout risk.


The electric power grid in Texas, which collapsed dramatically during the 2021 winter storm across the state, is being tested again as the state suffers unusually hot summer weather. Demand for electricity has reached new records at a time of rapid change in the mix of power sources as wind and solar ramp up. That’s feeding a debate about the dependability of the state’s power. 

1. Why is the Texas grid under threat again? 

Already the biggest power user in the nation, electricity use in the second most-populous state surged to record levels during heat waves this summer. The jump in demand comes as the state becomes more dependent on intermittent renewable power sources, raising concerns among some critics that more reliance on wind and solar will leave the grid more vulnerable to disruption. Green sources will produce almost 40% of the power in Texas this year, US Energy Information Administration data show. While that trails California’s 52%, Texas is a bigger market. It’s already No. 1 in wind, making it the largest clean energy market in the US. 

2. How is Texas unique? 

The spirit of defiance of the Lone Star State extends to its power grid as well. The Electric Reliability Council of Texas, or Ercot as the grid operator is known, serves about 90% of the state’s electricity needs and has very few high-voltage transmission lines connecting to nearby grids. It’s a deliberate move to avoid federal oversight of the power market. That means Texas has to be mainly self-reliant and cannot depend on neighbors during extreme conditions. That vulnerability is a dramatic twist for a state that’s also the energy capital of the US, thanks to vast oil and natural gas producing fields. Favorable regulations are also driving a wind and solar boom in Texas. 

3. Why the worry? 

The summer of 2023 will mark the first time all of the state’s needs cannot be met by traditional power plants, like nuclear, coal and gas. A sign of potential trouble came on June 20 when state officials urged residents to conserve power because of low supplies from wind farms and unexpected closures of fossil-fuel generators amid supply-chain constraints that limited availability. As of late July, the grid was holding up, thanks to the help of renewable sources. Solar generation has been coming in close to expected summer capacity, or exceeding it on most days. This has helped offset the hours in the middle of the day when wind speeds died down in West Texas. 

4. Why didn’t the grid’s problems get fixed? 

There is no easy fix. The Texas system allows the price of electricity to swing to match supply and demand. That means high prices — and high profits — drive the development of new power plants. At times spot power prices have been as low as $20-$50 a megawatt-hour versus more than $4,000 during periods of stress. The limitation of this pricing structure was laid bare by the 2021 winter blackouts. Since then, state lawmakers have passed market reforms that require weatherization of critical infrastructure and changed rules to put more money in the pockets of the owners of power generation.  

5. What’s the big challenge? 

There’s a real clash going on over what the grid of the future should look like in Texas and across the country, especially as severe heat raises blackout risks nationally. The challenge is to make sure nuclear and fossil fuel plants that are needed right now don’t retire too early and still allow newer, cleaner technologies to flourish. Some conservative Republicans have blamed renewable energy for destabilizing the grid and have pushed for more fossil-fuel powered generators. Lawmakers passed a controversial $10 billion program providing low-interest loans and grants to build new gas-fired plants using taxpayer money, but Texans ultimately have to vote on the subsidy. 


6. Why do improvements take so long? 

Figuring out how to keep the lights on without overburdening consumers is becoming a greater challenge amid more extreme weather fueled by climate change. As such, changing the rules is often a hotly contested process pitting utilities, generators, manufacturers, electricity retailers and other groups against one another. The process became more politicized after the storm in 2021 with Republican Gov. Greg Abbott and lawmakers ordering Ercot to make changes. Building more transmission lines and connecting to other states can help, but such projects are typically tied up for years in red tape.

7. What can be done? 

The price cap for electricity was cut from $9,000/MWh to $5,000 to help avoid the punitive costs seen in the 2021 storm, though prices are allowed to spike more easily. Ercot is also contracting for more reserves to be online to help avoid supply shortfalls and improve reliability for customers, which added $1.7 billion in consumer costs alone last year. Another rule helps some gas generators pay for their fuel costs, while a more recent reform put in price floors when reserves fall to certain levels. Many power experts say that the easiest solution is to pay people to reduce their energy consumption during times of grid stress through so-called demand response programs. Factories, Bitcoin miners and other large users are already compensated to conserve during tight grid conditions.


Related News

View more

Sign Up for Electricity Forum’s Newsletter

Stay informed with our FREE Newsletter — get the latest news, breakthrough technologies, and expert insights, delivered straight to your inbox.

Electricity Today T&D Magazine Subscribe for FREE

Stay informed with the latest T&D policies and technologies.
  • Timely insights from industry experts
  • Practical solutions T&D engineers
  • Free access to every issue

Live Online & In-person Group Training

Advantages To Instructor-Led Training – Instructor-Led Course, Customized Training, Multiple Locations, Economical, CEU Credits, Course Discounts.

Request For Quotation

Whether you would prefer Live Online or In-Person instruction, our electrical training courses can be tailored to meet your company's specific requirements and delivered to your employees in one location or at various locations.