COVID-19 Impact on US Renewable Energy disrupts solar and wind projects, dries up tax equity financing, strains supply chains, delays construction, and slows jobs growth amid limited federal stimulus and uncertain investor appetite.
Key Points
COVID-19 has slowed US clean energy growth by curbing tax equity, disrupting supply chains, and delaying projects.
✅ Tax equity dries up as investor profits fall
✅ Supply chain and construction face pandemic delays
✅ Policy aid and credit extensions sought by industry
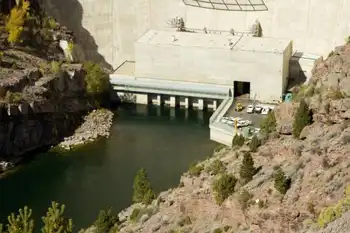
Swinerton Renewable Energy had everything it needed to build a promising new solar farm in Texas. It lined up more than 2,000 acres for the $109 million project estimated to generate 400 jobs while under construction. By its completion date, the solar farm was expected to produce 200 megawatts of energy — enough to power about 25,000 homes — and generate big tax breaks for its investors as part of a government program to incentivize clean energy.
But the coronavirus pandemic put everything on hold. The solar farm’s backers aren’t sure they will make enough money from other investments during the pandemic-fueled downturn for those tax breaks to be worth it. So the project has been delayed at least six months.
“This is not a shortage of materials. It is not a pricing issue,” said George Hershman, president of Swinerton Renewable Energy. “Everything was pointing to successful projects.”
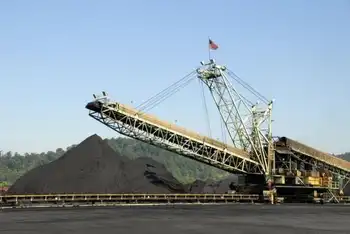
The coronavirus crisis is not only battering the oil and gas industry. It’s drying up capital and disrupting supply chains for businesses trying to move the country toward cleaner sources of energy.
While President Trump has promised lifelines for airlines and oil companies struggling with a drastic decrease in demand as Americans remain under stay-at-home orders, there is little focus in Washington on economic relief for this sector, despite a power coalition's call for action to address the pandemic — unlike during the Great Recession a decade ago, when Congress and the Obama administration earmarked an unprecedented sum for renewable energy and more efficient automobiles in a stimulus bill.
“We don’t want to lose our great oil companies,” Trump said during an April 1 news briefing. He so far has not made a similar promise to help wind and solar firms, and none of the four economic rescue and stimulus packages that Congress has passed to respond to the coronavirus crisis set aside any money for renewable energy specifically.
Sign up for our Coronavirus Updates newsletter to track the outbreak. All stories linked in the newsletter are free to access.
The impact of the crisis is already clear: About 106,000 clean-energy workers have already filed for unemployment in March alone, according to an analysis of Bureau of Labor Statistics data by Environmental Entrepreneurs, an advocacy group.
The layoffs are a blow to a sector that has prided itself on official projections that solar installers and wind turbine technicians would be the two fastest growing occupations over the next decade.
The job losses include not just wind and solar construction workers, but also those assembling electric cars and installing energy-efficient appliances, lighting, heating and air conditioning.
“These aren’t left-wing coastal hippies,” said Bob Keefe, executive director of Environmental Entrepreneurs. “These are construction workers who get up every day and lace up their boots and pull on their gloves and go to work putting insulation in our attics.”
Despite the economic turmoil, climate experts say the coronavirus pandemic could be an opportunity to make drastic shifts in the energy landscape, with green investments potentially driving a robust recovery. They say governments around the world should help fund renewable energy and use the turmoil in energy markets to remake the industry and slash carbon dioxide emissions, which will tumble 8 percent this year, according to the International Energy Agency.
The agency said that while global energy demand fell 3.8 percent in the first quarter, renewables were the only source to post an increase in demand, rising 1.5 percent thanks to new renewable power plants, low operating costs and priority on some electricity grids.
But many investors, who rely on a broad mix of investments, are spooked. “Everything is quiet because people want to see where we land with the current crisis, and people are holding on to cash,” said Daniel Klier, the global head of sustainable finance at HSBC bank. “As soon as people have a bit of confidence that the market is recovering, they can get projects going.”
Social distancing and the country’s stay-at-home orders are also having a deep effect on daily operations. The areas hardest hit are installing solar panels on rooftops and adding energy-efficiency measures inside homes — work that often requires face-to-face interactions. Sungevity, once one of the nation’s leading solar-installation companies, laid off 377 workers, most of its workforce, in late March, according to filings with California’s Employment Development Department. The company, which had emerged from a 2017 bankruptcy, cited economic conditions.
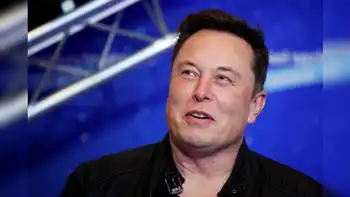
The push to promote a more fuel-efficient automobile fleet has also veered off track. The electric car maker Tesla was forced to shut down its factory in Fremont, Calif., just as it was turning up production on its new crossover vehicle, the Model Y.
Lockdown orders across the country led Tesla’s outspoken chief executive, Elon Musk, to launch into an expletive-laden rant during an earnings call last week in which Tesla posted a lukewarm profit of $16 million.
“To say that they cannot leave their house and they will be arrested if they do,” Musk said, “this is fascist.”
Sungevity and Tesla represent only a sliver of the economic pain in this sector across the country. The Solar Energy Industries Association had anticipated a growth in solar jobs, from 250,000 to 300,000, over the course of the year, said the group’s president, Abigail Ross Hopper. Now, she said, half the workforce is at risk.
“Shelter in place puts limitations on how people can work,” she said. “Literally, people don’t want other people inside their houses to fix electrical boxes. And there are no door-to-door sales.”
Bigger projects are also grappling with the pandemic economy, though not as severely. Hopper said the industry was geared up to increase the number of new solar farms, in part to take advantage of federal tax credits. “We were on track to do almost 20 gigawatts, which would have been the highest year yet,” Hopper said. That would have been enough to power about 3.7 million homes. Now she expects new projects will come closer to last year’s 13.27 gigawatts’ worth of new construction, after a report on utility-scale solar delays warned of widespread slowdowns, enough to run approximately 2.5 million homes.
Wind energy companies, too, are bracing for lost progress unless the federal government steps in. The American Wind Energy Association said projects that would add 25 gigawatts of wind power to the U.S. grid are at risk of being scaled back or canceled outright over the next two years because of the pandemic. Altogether, that work represents about 35,000 jobs.
“2019 was a good year for the wind industry,” said Tom Kiernan, the association’s chief executive. “We were expecting 2020 to be an even stronger year.”
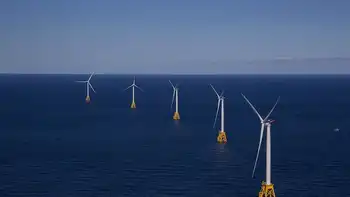
One project put on the back burner: an enormous 9 gigawatt offshore wind venture led by the New York State Energy Research and Development Authority set to be completed by 2035.
With New York City besieged by coronavirus cases, the authority said it would comply with an executive order from Gov. Andrew M. Cuomo (D), “pausing” all on-site work on clean-energy projects until at least May 15. Michigan, New Jersey and Pennsylvania also delayed wind turbine projects by deeming construction on them nonessential.
The Danish offshore wind firm Orsted said that plans for offshore U.S. wind installations would move “at a slower pace than originally expected due to a combination of the Bureau of Ocean Energy Management’s prolonged analysis of the cumulative impacts from the build-out of US offshore wind projects, and now also COVID-19 effects.” The company told investors it expects delays on projects off the coasts of New York, New Jersey and Rhode Island totaling almost 3 gigawatts.
The supply chains have also taken a hit during the pandemic: Even if contractors can get the money to erect wind turbines or lay solar arrays, that doesn’t mean they will have the parts. At least two factories that make wind turbine parts — one in North Dakota and another in Iowa — were forced to pause production because of coronavirus outbreaks. Factory shutdowns in China have constrained solar supplies, too.
The key reason for delaying most big solar and wind projects is the use of tax credits known as “tax equity.” These allow investors, such as banks, to use the credits to directly offset their overall tax burdens. But if an investor doesn’t have enough profit to offset the credits, the tax equity could become worthless.
“If your profitability is going down, you don’t have the same appetite,” Hopper said.
Solar and wind industry leaders are pressing Congress and the Trump administration to extend the eligibility period for tax credits that are due to expire, with senators urging support for clean energy in relief packages, and to make the tax credits refundable, meaning the government would issue a check to investors who do not have enough profit to justify their investments.
Currently, big wind turbines get a 1.5 cents per kilowatt hour tax credit if construction begins before the end of this year. Tax credits for residential renewable energy — solar panels and small wind — phase out by the end of 2021, and debate over a potential solar ITC extension continues to shape expectations in the wind market.
The lack of attention to renewables in Congress’s relief efforts so far is in stark contrast to 2009, when the United States spent $112 billion to boost “green” energy, according to the World Resources Institute. The government’s package then provided a mixture of grants and loans for a variety of renewable energy ventures — including a $465 million loan Tesla used to get its Fremont factory off the ground.
This year, a handful of clean-energy firms, including a Connecticut-based manufacturer of fuel cells and an Ohio-based maker of energy-efficient lighting systems, took money from a federal small-business lending program, before funds ran dry in the middle of last month. Broadwind Energy, a maker of steel wind energy towers based outside Chicago, received $9.5 million in small-business loans, one of the biggest totals in the program.
So far, the Trump administration has shown far more eagerness to help American petroleum producers that the president said were “ravaged” by a sharp drop in energy demand. Last month, Trump met with oil executives at the White House, and Energy Secretary Dan Brouillette has floated the idea of bridge loans for struggling oil firms.
During negotiations for the last relief package, congressional Democrats tried to strike a deal to refill the nation’s Strategic Petroleum Reserve in exchange for extending the clean-energy incentives, but Senate Majority Leader Mitch McConnell (R-Ky.) rebuffed those calls.
“Democrats won’t let us fund hospitals or save small businesses unless they get to dust off the Green New Deal,” McConnell said in March.
Already, Democrats are signaling they will make a push again in the next round of stimulus spending.
“Relief and recovery legislation will shape our society for years to come,” said Rep. A. Donald McEachin (D-Va.), vice chair of the House Sustainable Energy and Environment Coalition, a caucus that supports renewable energy resources. “We must use these bills to build in a climate-smart way.”
But it remains unclear how much appetite the GOP will have for a deal. “I just don’t know how to handicap that at this point,” said Grant Carlisle, an analyst at the Natural Resources Defense Council, a major environmental group.
Kiernan, the head of the American Wind Energy Association, said his group has “gotten a very good reception with the administration and with the Hill” when it comes to coronavirus relief, but he declined to go into specifics.
In other parts of the world, governments have been providing support for renewables. The European Union has its own Green New Deal, and China is expected to support wind and solar to get the economy moving more quickly.
Some energy analysts note that big oil companies don’t have to wait for government stimulus. The price of oil is so low that they would be better off investing in wind and solar, they say.
“For all these oil companies, the returns on these renewable projects are better than what they can do in the oil and gas industry,” said Sarah Ladislaw, director of the energy program at the Center for Strategic and International Studies. “Now is a good time to do that and tell their investors.”
This fits in with their broader goals, analysts contend. After all, Royal Dutch Shell recently matched BP’s earlier promise to aim to be net-zero for carbon emissions by 2050.
Shell’s chief executive Ben van Beurden has said the company would try to protect its low-carbon Integrated Gas and New Energies division from the largest spending cuts as it sought to weather the pandemic. “We must maintain focus on the long term,” he said in a video message. “Society expects nothing less.”
Related News