U.S. Power Sector Outlook 2022 previews clean energy targets, grid reliability and resilience upgrades, transmission expansion, renewable integration, EV charging networks, and decarbonization policies shaping utilities, markets, and climate strategies amid extreme weather risks.
Key Points
An outlook on clean energy goals, grid resilience, transmission, and EV infrastructure shaping U.S. decarbonization.
✅ States set 100% clean power targets; equity plans deepen.
✅ Grid reforms, transmission builds, and RTO debates intensify.
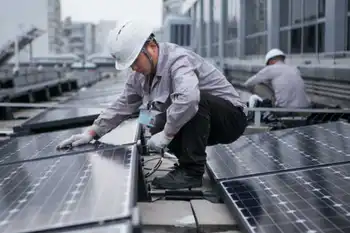
✅ EV plants, batteries, and charging corridors accelerate.
As sweeping climate legislation stalled in Congress this year, states and utilities were busy aiming to reshape the future of electricity.
States expanded clean energy goals and developed blueprints on how to reach them. Electric vehicles got a boost from new battery charging and factory plans.
The U.S. power sector also is sorting through billions of dollars of damage that will be paid for by customers over time. States coped with everything from blackouts during a winter storm to heat waves, hurricanes, wildfires and tornadoes. The barrage has added urgency to a push for increased grid reliability and resilience, especially as the power generation mix evolves, EV grid challenges grow as electricity is used to power cars and the climate changes.
“The magnitude of our inability to serve with these sort of discontinuous jumps in heat or cold or threats like wildfires and flooding has made it really clear that we can’t take the grid for granted anymore — and that we need to do something,” said Alison Silverstein, a Texas-based energy consultant.
Many of the announcements in 2021 could see further developments next year as legislatures, utilities and regulators flesh out details on everything from renewable projects to ways to make the grid more resilient.
On the policy front, the patchwork of state renewable energy and carbon reduction goals stands out considering Congress’ failure so far to advance a key piece of President Biden’s agenda — the "Build Back Better Act," which proposed about $550 billion for climate action. Criticism from fellow Democrats has rained on Sen. Joe Manchin (D-W.Va.) since he announced his opposition this month to that legislation (E&E Daily, Dec. 21).
The Biden administration has taken some steps to advance its priorities as it looks to decarbonize the U.S. power sector by 2035. That includes promoting electric vehicles, which are part of a goal to make the United States have net-zero emissions economywide no later than 2050. The administration has called for a national network of 500,000 EV charging stations as the American EV boom raises power-supply questions, and mandated the government begin buying only EVs by 2035.
Still, the fate of federal legislation and spending is uncertain. States and utility plans are considered a critical factor in whether Biden’s targets come to fruition. Silverstein also stressed the importance of regional cooperation as policymakers examine the grid and challenges ahead.
“Our comfort as individuals and as households and as an economy depends on the grid staying up,” Silverstein said, “and that’s no longer a given.”
Here are three areas of the electricity sector that saw changes in 2021, and could see significant developments next year:
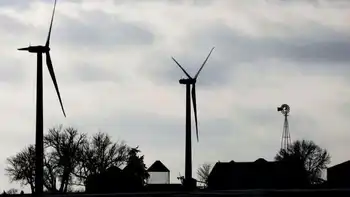
1. Clean energy
The list of states with new or revamped clean energy goals expanded again in 2021, with Oregon and Illinois joining the ranks requiring 100 percent zero-carbon electricity in 2040 and 2050, respectively.
Washington state passed a cap-and-trade bill. Massachusetts and Rhode Island adopted 2050 net-zero goals.
North Carolina adopted a law requiring a 70 percent cut in carbon emissions by 2030 from 2005 levels and establishing a midcentury net-zero goal.
Nebraska didn’t adopt a statewide policy, but its three public power districts voted separately to approve clean energy goals, actions that will collectively have the same effect. Even the governor of fossil-fuel-heavy North Dakota, during an oil conference speech, declared a goal of making the state carbon-neutral by the end of the decade.
These and other states join hundreds of local governments, big energy users and utilities, which were also busy establishing and reworking renewable energy and climate goals this year in response to public and investor pressure.
However, many of the details on how states will reach those targets are still to be determined, including factors such as how much natural gas will remain online and how many renewable projects will connect to the grid.
Decisions on clean energy that could be made in 2022 include a key one in Arizona, which has seen support rise and fall over the years for a proposal to lead to 100 percent clean power for regulated electric utilities. The Arizona Corporation Commission could discuss the matter in January, though final approval of the plan is not a sure thing. Eyes also are on California, where a much bigger grid for EVs will be needed, as it ponders a recent proposal on rooftop solar that has supporters of renewables worried about added costs that could hamper the industry.
In the wake of the major energy bill North Carolina passed in 2021, observers are waiting for Duke Energy Corp.’s filing of its carbon-reduction plan with state utility regulators. That plan will help determine the future electricity mix in the state.
Warren Leon, executive director of the Clean Energy States Alliance (CESA), said that without federal action, state goals are “going to be more difficult to achieve.”
State and federal policies are complementary, not substitutes, he said. And Washington can provide a tailwind and help states achieve their goals more quickly and easily.
“Progress is going to be most rapid if both the states and the federal government are moving in the same direction, but either of them operating independently of the others can still make a difference,” he said.
While emissions reductions and renewable energy goals were centerpieces of the state energy and climate policies adopted this year, there were some other common threads that could continue in 2022.
One that’s gone largely unnoticed is that an increasing number of states went beyond just setting targets for clean energy and have developed plans, or road maps, for how to meet their goals, Leon said.
Like the New Year resolutions that millions of Americans are planning — pledges to eat healthier or exercise more — it’s far easier to set ambitious goals than to achieve them.
According to CESA, California, Colorado, Nevada, Maine, Rhode Island, Massachusetts and Washington state all established plans for how to achieve their clean energy goals. Prior to late 2020, only two states — New York and New Jersey — had done so.
Another trend in state energy and climate policies: Equity and energy justice provisions factored heavily in new laws in places such as Maine, Illinois and Oregon.
Equity isn’t a new concern for states, Leon said. But state plans have become more detailed in terms of their response to ways the energy transition may affect vulnerable populations.
“They’re putting much more concrete actions in place,” he said. “And they are really figuring out how they go about electricity system planning to make sure there are new voices at the table, that the processes are different, and there are things that are going to be measured to determine whether they’re actually making progress toward equity.”
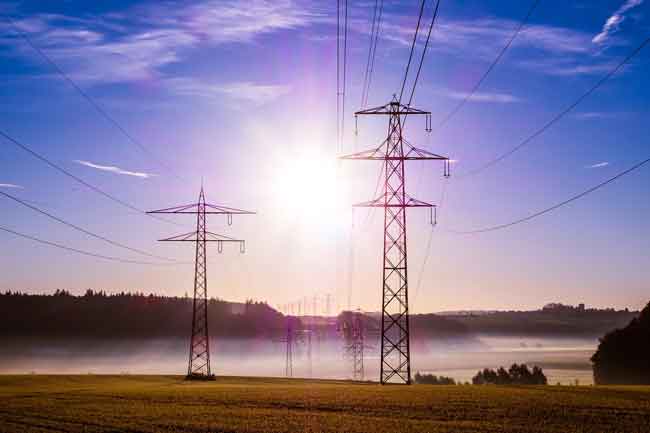
2. Grid
Climate change and natural disasters have been a growing worry for grid planners, and 2021 was a year the issue affected many Americans directly.
Texas’ main power grid suffered massive outages during a deadly February winter storm, and it wasn’t far from an uncontrolled blackout that could have required weeks or months of recovery.
Consumers elsewhere in the country watched as millions of Texans lost grid power and heat amid a bitter cold snap. Other parts of the central United States saw more limited power outages in February.
“I think people care about the grid a lot more this year than they did last year,” Silverstein said, adding, “All of a sudden people are realizing that electricity’s not as easy as they’ve assumed it was and … that we need to invest more.”
Many of the challenges are not specific to one state, she added.
“It seems to me that the state regulators need to put a lot — and utilities need to put a lot — more commitment into working together to solve broad regional problems in cooperative regional ways,” Silverstein said.
In 2022, multiple decisions could affect the grid, including state oversight of spending on upgrades and market proposals that could sway the amount of clean energy brought online.
A focal point will be Texas, where state regulators are examining further changes to the Electric Reliability Council of Texas’ market design. That could have major implications for how renewables develop in the state. Leaders in other parts of the country will likely keep tabs on adjustments in Texas as they ponder their own changes.
Texas has already embarked on reforms to help improve the power sector and its coordination with the natural gas system, which is critical to keeping plants running. But its primary power grid, operated by ERCOT, remains largely isolated and hasn’t been able to rule out power shortages this winter if there are extreme conditions (Energywire, Nov. 22).
Transmission also remains a key issue outside of the Lone Star State, both for resilience and to connect new wind and solar farms. In many areas of the country, the job of planning these new regional lines and figuring out how to allocate billions of dollars in costs falls to regional grid operators (Energywire, Dec. 13).
In the central U.S., the issue led to tension between states in the Midwest and the Gulf South (Energywire, Oct. 15).
In the Northeast, a Maine environmental commissioner last month suspended a permit for a major transmission project that could send hydropower to the region from Canada (Greenwire, Nov. 24). The project’s developers are now battling the state in court to force construction of the line — a process that could be resolved in 2022 — after Mainers signaled opposition in a November vote.
Advocates of a regional transmission organization for Western states, meanwhile, hope to keep building momentum even as critics question the cost savings promoted by supporters of organized markets. Among those in existing markets, states such as Louisiana are expected to monitor the costs and benefits of being associated with the Midcontinent Independent System Operator.
In other states, more details are expected to emerge in 2022 about plans announced this year.
In California, where policymakers are also exploring EVs for grid stability alongside wildfire prevention, Pacific Gas & Electric Co. announced a plan over the summer to spend billions of dollars to underground some 10,000 miles of power lines to help prevent wildfires, for example (Greenwire, July 22).
Several Southeastern utilities, including Dominion Energy Inc., Duke Energy, Southern Co. and the Tennessee Valley Authority, won FERC approval to create a new grid plan — the Southeast Energy Exchange Market, or SEEM — that they say will boost renewable energy.
SEEM is an electricity trading platform that will facilitate trading close to the times when the power is used. The new market is slated to include two time zones, which would allow excess renewables such as solar and wind to be funneled to other parts of the country to be used during peak demand times.
SEEM is significant because the Southeast does not have an organized market structure like other parts of the country, although some utilities such as Dominion and Duke do have some operations in the region managed by PJM Interconnection LLC, the largest U.S. regional grid operator.
SEEM is not a regional transmission organization (RTO) or energy imbalance market. Critics argue that because it doesn’t include a traditional independent monitor, SEEM lacks safeguards against actions that could manipulate energy prices.
Others have said the electric companies that formed SEEM did so to stave off pressure to develop an RTO. Some of the regulated electric companies involved in the new market have denied that claim.
3. Electric vehicles
With electric vehicles, the Midwest and Southeast gained momentum in 2021 as hubs for electrifying the transportation sector, as EVs hit an inflection point in mainstream adoption, and the Biden administration simultaneously worked to boost infrastructure to help get more EVs on the road.
From battery makers to EV startups to major auto manufacturers, companies along the entire EV supply chain spectrum moved to or expanded in those two regions, solidifying their footprint in the fast-growing sector.
A wave of industry announcements capped off in December with California-based Rivian Automotive Inc. declaring it would build a $5 billion electric truck, SUV and van factory in Georgia. Toyota Motor Corp. picked North Carolina for its first U.S.-based battery plant. General Motors Co. and a partner plan to build a $2.5 billion battery plant in GM’s home state of Michigan. And Proterra Inc. has unveiled plans to build a new battery factory in South Carolina.
Advocates hope the EV shift by automakers in the Midwest and Southeast will widen the options for customers. Automakers and startups also have been targeting states with zero-emission vehicle targets to launch new and more models because there’s an inherent demand for them.
“The states that have adopted those standards are getting more vehicles,” said Anne Blair, senior EV policy manager for the Electrification Coalition.
EV advocates say they hope those policies could help bring products like Ford’s electrified signature truck line on the road and into rural areas. Ford also is partnering with Korean partner SK Innovation Co. Ltd. to build two massive battery plants in Kentucky.
Regardless of the fanfare about new vehicles, more jobs and must-needed economic growth, barriers to EV adoption remain. Many states have tacked on annual fees, which some elected officials argue are needed to replace revenues secured from a gasoline tax.
Other states do not allow automakers to sell directly to consumers, preventing companies like Lordstown Motors Corp. and Rivian to effectively do business there.
“It’s about consumer choice and consumers having the capacity to buy the vehicles that they want and that are coming out, in new and innovative ways,” Blair told E&E News. Blair said direct sales also will help boost EV sales at traditional dealerships.
In 2022, advocates will be closely watching progress with the National Electric Highway Coalition, amid tensions over charging control among utilities and networks, which was formed by more than 50 U.S. power companies to build a coast-to-coast fast-charging network for EVs along major U.S. travel corridors by the end of 2023 (Energywire, Dec. 7).
A number of states also will be holding legislative sessions, and they could include new efforts to promote EVs — or change benefits that currently go to owners of alternative vehicles.
EV advocates will be pushing for lawmakers to remove barriers that they argue are preventing customers from buying alternative vehicles.
Conversations already have begun in Georgia to let startup EV makers sell their cars and trucks directly to consumers. In Florida, lawmakers will try again to start a framework that will create a network of charging stations as charging networks jostle for position under federal electrification efforts, as well as add annual fees to alternative vehicles to ease concerns over lost gasoline tax revenue.
Related News