Wind farms hit opposition: Foes target clearing of forests

By Knight Ridder Tribune


Electrical Testing & Commissioning of Power Systems

Our customized live online or in‑person group training can be delivered to your staff at your location.

  • Live Online
  • 12 hours Instructor-led
  • Group Training Available
Regular Price:
$599
Coupon Price:
$499
Reserve Your Seat Today
Business and political leaders in Western Maryland's Garrett County are lining up against a proposal to allow the clearing of up to 400 mountaintop acres of state forest for the construction of 40-story wind turbines.

With a pair of public hearings scheduled this week, Garrett's Chamber of Commerce, Board of Realtors, Democratic Central Committee and Republican state delegate and senator have come out against the proposal to use two state forests in the county for wind farms. So has the mayor of the town of Oakland.

"I've taken time to talk to a lot of people, and a vast majority are against this," said state Sen. George C. Edwards, a Republican who heads the delegation from Garrett and Allegany counties. He sent a letter to Gov. Martin O'Malley asking him not to a low state land to be used for wind farms.

"Even people who support windmills don't support them on state land," Edwards said.

Charlie Ross, president of the Garrett County Chamber of Commerce, agreed. "There is an aesthetics issue. And people who come to Garrett County to live or visit want to see that aesthetics preserved," he said. "Since tourism is our biggest industry going right now, we don't want to do anything to harm that industry."

But David F. McAnally, chairman of Pennsylvania-based U.S. Wind Force, said he believes people will support his company's proposal to build a total of 100 turbines on two state forest tracts once they hear all the facts.

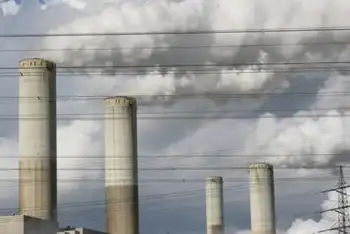
McAnally said it's worth using a fraction of 1 percent of the public land in Western Maryland to increase the supply of clean electricity to the state, which faces a power shortage in future years. "We will reach a time when we will not be able to tell our kids or grandkids that they can turn on the light when they flick the switch," McAnally said. "Wind power is a part of that solution."

U.S. Wind Force is running ads in Western Maryland newspapers that say "Support Wind - for a Cleaner Energy Future." The company notes that Maryland has long allowed lumber companies to cut trees in state forests for timber.

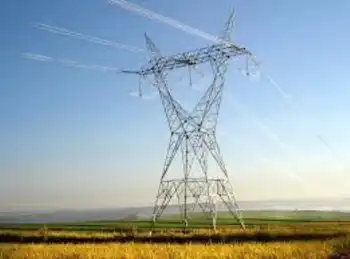
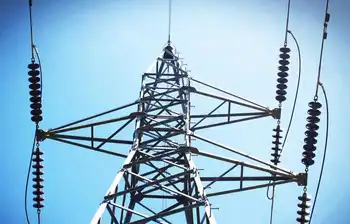
Some power line towers are allowed in state forests.

Author and climate change activist Mike Tidwell, who supports wind energy as a way to fight global warming, said he thinks Maryland should ban logging in state forests if it's going to prohibit wind farms. He said logging is more environmentally harmful than wind turbines.

"I appeal to the governor to make a fair and balanced decision that does not favor one industry that has obvious harmful impacts versus a new industry that brings clear benefits to the state, while being admittedly imperfect," Tidwell said. About 25,000 wind turbines across the country generate about 1 percent of America's electricity, with more than 3,000 built in the past year.

Boosted by federal subsidies, scores of turbines are being built in the Midwest, Texas, California, Pennsylvani and West Virginia. But none has been built in Maryland.

Maryland has given full or preliminary approval to three companies to create wind farms on private land in the western part of the state, but the projects have been slowed by a lack of agreements with power distribution companies and other problems. U.S. Wind Force is looking at the Savage River and Potomac state forests. The American Wind Energy Association says it does not know of any wind turbines built in state or federal forests anywhere in the United States.

U.S. Wind Force officials rode in a state helicopter with O'Malley this fall to look at Western Maryland, McAnally said. They showed the governor the 400 acres they're interested in along Backbone Mountain and Meadow Mountain. Casper R. Taylor Jr., the former speaker of the House of Delegates from Western Maryland, has been lobbying state officials on the company's behalf.

The terms of the leases would have to be negotiated, but they could include payments to the state of roughly $1 million a year for 20 years, according to state and company officials. But before the O'Malley administration considers the company's proposal, the Maryland Department of Natural Resources must set a general policy on whether to allow wind turbines on state land, said Deputy Secretary Eric Schwaab.

"We are focused on the public policy question of whether it's appropriate to use state forests to satisfy our goal of increasing the production of sustainable energy," Schwaab said.

Electricity transmission towers in state forests can be 100 feet tall, about a quarter the height of the proposed turbines. Part of the Savage River forest is used by natural gas companies for the underground storage of methane, a use inherited when the state received the land from the federal government in the 1950s, Schwaab said. Over the past two decades, the state has turned down all requests for natural gas wells in state forests.

Each acre in Savage River State Forest is logged about once every 120 years, Schwaab said. Last year, trees were cut from about 245 of the forest's 55,000 acres.

"It's not clear-cut," he said. "We do harvest timber on a sustainable basis."

U.S. Wind Force officials have said that they'd have to clear up to 400 acres of state forest for their turbines. The Natural Resources Department had received more than 300 e-mails from the public about the proposal, and about 80 percent of the messages opposed the idea, according to the agency.

"NO! We should not be industrializing our state forests!" read one typical comment, from a woman identified on the agency's Web site only as Barbara D. Garrett County has received more than 100 e-mail messages, phone calls and letters about the proposal, about 95 percent of them against the idea, county officials said.

The Garrett County Chamber of Commerce, Board of Realtors and County Democratic Central Committee all voted unanimously this month against allowing the wind farms on state land. The Board of Realtors sent a letter to the governor reading: "There should be no wind power turbines placed on Maryland's public lands, especially those lands in our treasured state parks, forests and wildlife areas."

Among those supporting the proposal is state Del. Robert A. McKee, a Republican from Washington County, more than an hour's drive to the east. He wrote the governor praising the project as something that would "help the region meet expected future power demands with a safe, clean, renewable, reliable, domestic source of power."

But in Garrett County, where the turbines would stand, "the consensus seems to be overwhelmingly opposed to it," said county Commissioner Ernest J. Gregg, a Republican.

"The public seems to think it will disturb their views and disturb the recreational se of public lands."

Related News

U.S. Electricity and natural gas prices explained

Energy Pricing Factors span electricity generation, transmission, and distribution costs, plus natural gas supply-demand, renewables, seasonal peaks, and wholesale pricing effects across residential, commercial, and industrial customers, usage patterns, weather, and grid constraints.


Key Points

They are the costs and market forces driving electricity and natural gas prices, from generation to delivery and demand.

✅ Generation, transmission, distribution shape electricity rates

✅ Gas prices hinge on supply, storage, imports/exports

✅ Demand shifts: weather, economy, and fuel alternatives


There are a lot of factors that affect energy prices globally. What’s included in the price to heat homes and supply them with electricity may be a lot more than some people may think.

Electricity
Generating electricity is the largest component of its price, according to the U.S. Energy Information Administration (EIA). Generation accounts for 56% of the price of electricity, while distribution and transmission account for 31% and 13% respectively.

Homeowners and businesses pay more for electricity than industrial companies, and U.S. electricity prices have recently surged, highlighting broader inflationary pressures. This is because industrial companies can take electricity at higher voltages, reducing transmission costs for energy companies.

“Industrial consumers use more electricity and can receive it at higher voltages, so supplying electricity to these customers is more efficient and less expensive. The price of electricity to industrial customers is generally close to the wholesale price of electricity,” EIA explains.

NYSEG said based on the average use of 600 kilowatt-hours per month, its customers spent the most money on delivery and transition charges in 2020, 57% or about $42, and residential electricity bills increased 5% in 2022 after inflation, according to national data. They also spent on average 35% (~$26) on supply charges and 8% (~$6) on surcharges.

Electricity prices are usually higher in the summer. Why? Because energy companies use sources of electricity that cost more money. It used to be that renewable sources, like solar and wind, were the most expensive sources of energy but increased technological advances have changed this, according to the International Energy Agency’s 2021 World Energy Outlook.

“In most markets, solar PV or wind now represents the cheapest available source of new electricity generation. Clean energy technology is becoming a major new area for investment and employment – and a dynamic arena for international collaboration and competition,” the report said.

Natural gas
The price of natural gas is driven by supply and demand. If there is more supply, prices are generally lower. If there is not as much supply, prices are generally higher the EIA explains. On the other side of the equation, more demand can also increase the price and less demand can decrease the price.

High natural gas prices mean people turn their home thermostats down a few degrees to save money, so the EIA said reduced demand can encourage companies to produce more natural gas, which would in turn help lower the cost. Lower prices will sometimes cause companies to reduce their production, therefore causing the price to rise.

The three major supply factors that affect prices: the amount of natural gas produced, how much is stored, and the volume of gas imported and exported. The three major demand factors that affect price are: changes in winter/summer weather, economic growth, and the broader energy crisis dynamics, as well as how much other fuels are available and their price, said EIA.

To think the price of natural gas is higher when the economy is thriving may sound counterintuitive but that’s exactly what happens. The EIA said this is because of increases in demand.


Related News

View more

Which of the cleaner states imports dirty electricity?

Hourly Electricity Emissions Tracking maps grid balancing areas, embodied emissions, and imports/exports, revealing carbon intensity shifts across PJM, ERCOT, and California ISO, and clarifying renewable energy versus coal impacts on health and climate.


Key Points

An hourly method tracing generation, flows, and embodied emissions to quantify carbon intensity across US balancing areas.

✅ Hourly traces of imports/exports and generation mix

✅ Consumption-based carbon intensity by balancing area

✅ Policy insights for renewables, coal, health costs


In the United States, electricity generation accounts for nearly 30% of our carbon emissions. Some states have responded to that by setting aggressive renewable energy standards; others are hoping to see coal propped up even as its economics get worse. Complicating matters further is the fact that many regional grids are integrated, and as America goes electric the stakes grow, meaning power generated in one location may be exported and used in a different state entirely.

Tracking these electricity exports is critical for understanding how to lower our national carbon emissions. In addition, power from a dirty source like coal has health and environment impacts where it's produced, and the costs of these aren't always paid by the parties using the electricity. Unfortunately, getting reliable figures on how electricity is produced and where it's used is challenging, even for consumers trying to find where their electricity comes from in the first place, leaving some of the best estimates with a time resolution of only a month.

Now, three Stanford researchers—Jacques A. de Chalendar, John Taggart, and Sally M. Benson—have greatly improved on that standard, and they have managed to track power generation and use on an hourly basis. The researchers found that, of the 66 grid balancing areas within the United States, only three have carbon emissions equivalent to our national average, and they have found that imports and exports of electricity have both seasonal and daily changes. de Chalendar et al. discovered that the net results can be substantial, with imported electricity increasing California's emissions/power by 20%.

Hour by hour
To figure out the US energy trading landscape, the researchers obtained 2016 data for grid features called balancing areas. The continental US has 66 of these, providing much better spatial resolution on the data than the larger grid subdivisions. This doesn't cover everything—several balancing areas in Canada and Mexico are tied in to the US grid—and some of these balancing areas are much larger than others. The PJM grid, serving Pennsylvania, New Jersey, and Maryland, for example, is more than twice as large as Texas' ERCOT, in a state that produces and consumes the most electricity in the US.

Despite these limitations, it's possible to get hourly figures on how much electricity was generated, what was used to produce it, and whether it was used locally or exported to another balancing area. Information on the generating sources allowed the researchers to attach an emissions figure to each unit of electricity produced. Coal, for example, produces double the emissions of natural gas, which in turn produces more than an order of magnitude more carbon dioxide than the manufacturing of solar, wind, or hydro facilities. These figures were turned into what the authors call "embodied emissions" that can be traced to where they're eventually used.

Similar figures were also generated for sulfur dioxide and nitrogen oxides. Released by the burning of fossil fuels, these can both influence the global climate and produce local health problems.

Huge variation
The results were striking. "The consumption-based carbon intensity of electricity varies by almost an order of magnitude across the different regions in the US electricity system," the authors conclude. The low is the Bonneville Power grid region, which is largely supplied by hydropower; it has typical emissions below 100kg of carbon dioxide per megawatt-hour. The highest emissions come in the Ohio Valley Electric region, where emissions clear 900kg/MW-hr. Only three regional grids match the overall grid emissions intensity, although that includes the very large PJM (where capacity auction payouts recently fell), ERCOT, and Southern Co balancing areas.

Most of the low-emissions power that's exported comes from the Pacific Northwest's abundant hydropower, while the Rocky Mountains area exports electricity with the highest associated emissions. That leads to some striking asymmetries. Local generation in the hydro-rich Idaho Power Company has embodied emissions of only 71kg/MW-hr, while its imports, coming primarily from Rocky Mountain states, have a carbon content of 625kg/MW-hr.

The reliance on hydropower also makes the asymmetry seasonal. Local generation is highest in the spring as snow melts, but imports become a larger source outside this time of year. As solar and wind can also have pronounced seasonal shifts, similar changes will likely be seen as these become larger contributors to many of these regional grids. Similar things occur daily, as both demand and solar production (and, to a lesser extent, wind) have distinct daily profiles.

The Golden State
California's CISO provides another instructive case. Imports represent less than 30% of its total electric use in 2016, yet California electricity imports provided 40% of its embodied emissions. Some of these, however, come internally from California, provided by the Los Angeles Department of Water and Power. The state itself, however, has only had limited tracking of imported emissions, lumping many of its sources as "other," and has been exporting its energy policies to Western states in ways that shape regional markets.

Overall, the 2016 inventory provides a narrow picture of the US grid, as plenty of trends are rapidly changing our country's emissions profile, including the rise of renewables and the widespread adoption of efficiency measures and other utility trends in 2017 that continue to evolve. The method developed here can, however, allow for annual updates, providing us with a much better picture of trends. That could be quite valuable to track things like how the rapid rise in solar power is altering the daily production of clean power.

More significantly, it provides a basis for more informed policymaking. States that wish to promote low-emissions power can use the information here to either alter the source of their imports or to encourage the sites where they're produced to adopt more renewable power. And those states that are exporting electricity produced primarily through fossil fuels could ensure that the locations where the power is used pay a price that includes the health costs of its production.


Related News

View more

E.ON to Commission 2500 Digital Transformer Stations

E.ON Digital Transformer Stations modernize distribution grids with smart grid monitoring, voltage control, and remote switching, enabling bidirectional power flow, renewables integration, and rapid fault isolation from centralized grid control centres.


Key Points

Remotely monitored grid nodes enhancing smart grid stability and speedier fault response.

✅ Real-time voltage and current data along feeders and laterals

✅ Remote switching cuts outage duration and truck rolls

✅ Supports renewables and bidirectional power flows


E.ON plans to commission 2500 digital transformer stations in the service areas of its four German distribution grid operators - Avacon, Bayernwerk, E.DIS and Hansewerk - by the end of 2019. Starting this year, E.ON will solely install digital transformer stations in Germany, aligning with 2019 grid edge trends seen across the sector. This way, the digital grid is quite naturally being integrated into E.ON's distribution grids.

With these transformer stations as the centrepiece of the smart grid, it is possible to monitor and control using synchrophasors in the power grid from the grid control centre. This helps to maintain a more balanced utilisation of the grid and, with increasing complexity, ensures continued security of supply.

Until now, the current and voltage parameters required for safe grid operation could usually only be determined at the beginning of a power line, where there is usually a grid substation in place. Controlling current flow and voltage in the downstream system was physically impossible.

In the future, grids will have to function in both directions: they will bring electricity to the customer while at the same time collecting and transmitting more and more green electricity via HVDC technology where appropriate. This requires physical data to be made available along the entire route. To ensure security of supply, voltage fluctuations must be kept within narrowly defined limits and the current flow must not exceed the specified value, while reducing line losses with superconducting cables remains an important consideration. To manage this challenge, it is necessary to install digital technology.

The possibility of remotely controlling grids also reduces downtimes in the event of faults and supports a smarter electricity infrastructure approach. With the new technology, our grid operators can quickly and easily access the stations of the affected line. The grid control centres can thus limit and eliminate faults on individual line sections within a very short space of time.


Related News

View more

Former B.C. Hydro CEO earns half a million without working a single day

B.C. Hydro Salary Continuance Payout spotlights executive compensation, severance, and governance at a Crown corporation after a firing, citing financial disclosure reports, Site C dam ties, and a leadership change under a new government.


Key Points

Severance-style pay for B.C. Hydro's fired CEO, via salary continuance and disclosed in public filings.

✅ $541,615 total compensation without working days

✅ Salary continuance after NDP firing; financial disclosures

✅ Later named Canada Post interim CEO amid strike


Former B.C. Hydro president and chief executive officer Jessica McDonald received a total of $541,615 in compensation during the 2017-2018 fiscal year, a figure that sits amid wider debates over executive pay at utilities such as Hydro One CEO pay at the provincial utility, without having worked a single day for the Crown corporation.

She earned this money under a compensation package after the in-coming New Democratic government of John Horgan fired her, a move comparable to Ontario's decision when the Hydro One CEO and board exit amid share declines. The previous B.C. Liberal government named her president and CEO of B.C. Hydro in 2014, and McDonald was a strong supporter of the controversial Site C dam project now going ahead following a review.

The current New Democratic government placed her on what financial disclosure documents call “salary continuance” effective July 21, 2017 — the day the government announced her departure — at a utility scrutinized in a misled regulator report that raised oversight concerns.

According to financial disclosure statements, McDonald remained on “salary continuance” until Sept. 21 of this year, and the utility has also been assessed in a deferred operating costs report released by the auditor general. During this period, she earned $272,659, a figure that includes benefits, pension and other compensation.

McDonald — who used to be the deputy minister to former premier Gordon Campbell — is now working for Canada Post, which appointed her as interim president and chief executive officer in March, while developments at Manitoba Hydro highlight broader political pressures on Crown utilities.

She started in her new role on April 2, 2018, and now finds herself in the middle of managing a postal carrier strike.


Related News

View more

Why Is Central Asia Suffering From Severe Electricity Shortages?

Central Asia power shortages strain grids across Kazakhstan, Uzbekistan, Kyrgyzstan, Tajikistan, and Turkmenistan, driven by drought-hit hydropower, aging coal and gas plants, rising demand, cryptomining loads, and winter peak consumption risks.


Key Points

Regionwide blackouts from drought, aging plants and grids, rising demand, and winter peaks stressing Central Asia.

✅ Drought slashes hydropower in Kyrgyzstan, Tajikistan, Uzbekistan

✅ Aging coal and gas TPPs and weak grids cause frequent outages

✅ Cryptomining loads and winter heating spike demand and stress supply


Central Asians from western Kazakhstan to southern Tajikistan are suffering from power and energy shortages that have caused hardship and emergency situations affecting the lives of millions of people.

On October 14, several units at three power plants in northeastern Kazakhstan were shut down in an emergency that resulted in a loss of more than 1,000 megawatts (MW) of electricity.

It serves as an example of the kind of power failures that plague the region 30 years after the Central Asian countries gained independence and despite hundreds of millions of dollars being invested in energy infrastructure and power grids, and echo risks seen in other advanced markets such as Japan's near-blackouts during recent cold snaps.

Some of the reasons for these problems are clear, but with all the money these countries have allocated to their energy sectors and financial help they have received from international financial institutions, it is curious the situation is already so desperate with winter officially still weeks away.


The Current Problems
Three power plants were affected in the October 14 shutdowns of units: Ekibastuz-1, Ekibastuz-2, and the Aksu power plant.

Ekibastuz-1 is the largest power plant in Kazakhstan, capable of generating some 4,000 MW, roughly 13 percent of Kazakhstan’s total power output.

The Kazakhstan Electricity Grid Operating Company (KEGOC) explained the problems resulted partially from malfunctions and repair work, but also from overuse of the system that the government would later say was due to cryptominers, a large number of whom have moved to Kazakhstan recently from China after Beijing banned the mining needed by Bitcoin and other cryptocurrencies, amid its own China's power cuts across several provinces in 2021.

But between November 8 and 9, rolling blackouts were reported in the East Kazakhstan, North Kazakhstan, and Kyzylorda provinces, as well as the area around Almaty, Kazakhstan’s biggest city, and Shymkent, its third largest city.

People in Uzbekistan say they, too, are facing blackouts that the Energy Ministry described as “short-term outages,” even as authorities have looked to export electricity to Afghanistan to support regional demand, though it has been clear for several weeks that the country will have problems with natural gas supplies this winter.


Power lines in Uzbekistan
Kyrgyz President Sadyr Japarov continues to say there won't be any power rationing in Kyrgyzstan this winter, but at the end of September the National Energy Holding Company ordered “restrictions on the lighting of secondary streets, advertisements, and facades of shops, cafes, and other nonresidential customers.”

Many parts of Tajikistan are already experiencing intermittent supplies of electricity.

Even in Turkmenistan, a country with the fourth-largest reserves of natural gas in the world, there were reports of problems with electricity and heating in the capital, Ashgabat.


What Is Going On?
The causes of some of these problems are easy to see.

The population of the region has grown significantly, with the population of Central Asia when the Soviet Union collapsed in late 1991 being some 50 million and today about 75 million.

Kyrgyzstan and Tajikistan are mountainous countries that have long been touted for their hydropower potential and some 90 percent of Kyrgyzstan’s domestically produced electricity and 98 percent of Tajikistan’s come from hydropower.

But a severe drought that struck Central Asia this year has resulted in less hydropower and, in general, less energy for the region, similar to constraints seen in Europe's reduced hydro and nuclear output this year.

Tajik authorities have not reported how low the water in the country’s key reservoirs is, but Kyrgyzstan has reported the water level in the reservoir at its Toktogul hydropower plant (HPP) is 11.8 billion cubic meters (bcm), the lowest level in years and far less than the 14.7 bcm of water it had in November 2020.

The Toktogul HPP, with an installed capacity of 1,200 MW, provides some 40 percent of the country's domestically produced electricity, but operating the HPP this winter to generate desperately needed energy brings the risk of leaving water levels at the reservoir critically low next spring and summer when the water is also needed for agricultural purposes.

This year’s drought is something Kyrgyzstan and Tajikistan will have to take into consideration as they plan how to provide power for their growing populations in the future. Hydropower is a desirable option but may be less reliable with the onset of climate change, prompting interest in alternatives such as Ukraine's wind power to diversify generation.

Uzbekistan is also feeling the effects of this year’s drought, and, like the South Caucasus where Georgia's electricity imports have increased, supply shortfalls are testing grids.

According to the International Energy Agency, HPPs account for some 12 percent of Uzbekistan’s generating capacity.

Uzbekistan’s Energy Ministry attributed low water levels at HPPs that have caused a 23 percent decrease in hydropower generation this year.


A reservoir in Kyrgyzstan
Kazakhstan and Uzbekistan are the most populous Central Asian countries, and both depend on thermal power plants (TPP) for generating most of their electricity.

Most of the TPPs in Kazakhstan are coal-fired, while most of the TPPs in Uzbekistan are gas-fired.

Kazakhstan has 68 power plants, 80 percent of which are coal-fired TPPs, and most are in the northern part of the country where the largest deposits of coal are located. Kazakhstan has the world's 10th largest reserves of coal.

About 88 percent of Uzbekistan’s electricity comes from TTPs, most of which use natural gas.

Uzbekistan’s proven reserves are some 800 billion cubic meters, but gas production in Uzbekistan has been decreasing.

In December 2020, Uzbek President Shavkat Mirziyoev ordered a halt to the country’s gas exports and instructed that gas to be redirected for domestic use. Mirziyoev has already given similar instructions for this coming winter.


How Did It Come To This?
The biggest problem with the energy infrastructure in Central Asia is that it is generally very old. Nearly all of its power plants date back to the Soviet era -- and some well back into the Soviet period.

The use of power plants and transmission lines that some describe as “obsolete” and a few call “decrepit” has unfortunately been a necessity in Central Asia, even as regional players pursue new interconnections like Iran's plan to transmit electricity to Europe as a power hub.

Reporting on Kazakhstan in September 2016, the Asian Development Bank (ADB) said, “70 percent of the power generation infrastructure is in need of rehabilitation.”

The Ekibastuz-1 TPP is relatively new by the power-plant standards of Central Asia. The first unit of the eight units of the TPP was commissioned in 1980.

The first unit at the AKSU TPP was commissioned in 1968, and the first unit of the gas- and fuel-fired TPP in southern Kazakhstan’s Zhambyl Province was commissioned in 1967.


Related News

View more

Electricity use actually increased during 2018 Earth Hour, BC Hydro

Earth Hour BC highlights BC Hydro data on electricity use, energy savings, and participation in the Lower Mainland and Vancouver Island amid climate change and hydroelectric power dynamics.


Key Points

BC observance tracking BC Hydro electricity use and conservation during Earth Hour, amid hydroelectric power dominance.

✅ BC Hydro reports rising electricity use during Earth Hour 2018

✅ Savings fell from 2% in 2008 to near zero province-wide

✅ Hydroelectric grid yields low GHG emissions in BC


For the first time since it began tracking electricity use in the province during Earth Hour, BC Hydro said customers used more power during the 60-minute period when lights are expected to dim, mirroring all-time high electricity demand seen recently.

The World Wildlife Fund launched Earth Hour in Sydney, Australia in 2007. Residents and businesses there turned off lights and non-essential power as a symbol to mark the importance of combating climate change.

The event was adopted in B.C. the next year and, as part of that, BC Hydro began tracking the megawatt hours saved.

#google#

In 2008, residents and businesses achieved a two per cent savings in electricity use. But since then, BC Hydro says the savings have plummeted.

The event was adopted in B.C. the next year and, as part of that, BC Hydro began tracking the megawatt hours saved.

In 2008, residents and businesses achieved a two per cent savings in electricity use. But since then, BC Hydro says the savings have plummeted, as record-breaking demand in 2021 and beyond changed consumption patterns.


Lights on

For Earth Hour this year, which took place 8:30-9:30 p.m. on March 24, BC Hydro says electricity use in the Lower Mainland increased by 0.5 per cent, even as it activated a winter payment plan to help customers manage bills. On Vancouver Island it increased 0.6 per cent.

In the province's southern Interior and northern Interior, power use remained the same during the event.

On Friday, the utility released a report called: "lights out". Why Earth Hour is dimming in BC. which explores the decline of energy savings related to Earth Hour in the province.

The WWF says the way in which hydro companies track electricity savings during Earth Hour is not an accurate measure of participation, and tracking of emerging loads like crypto mining electricity use remains opaque, and noted that more countries than ever are turning off lights for the event.

For 2018, the WWF shifted the focus of Earth Hour to the loss of wildlife across the globe.

BC Hydro says in its report that the symbolism of Earth Hour is still important to British Columbians, but almost all power generation in B.C. is hydroelectric, though recent drought conditions have required operational adjustments, and only accounts for one per cent of greenhouse gas emissions.


Related News

View more

Sign Up for Electricity Forum’s Newsletter

Stay informed with our FREE Newsletter — get the latest news, breakthrough technologies, and expert insights, delivered straight to your inbox.

Electricity Today T&D Magazine Subscribe for FREE

Stay informed with the latest T&D policies and technologies.
  • Timely insights from industry experts
  • Practical solutions T&D engineers
  • Free access to every issue

Live Online & In-person Group Training

Advantages To Instructor-Led Training – Instructor-Led Course, Customized Training, Multiple Locations, Economical, CEU Credits, Course Discounts.

Request For Quotation

Whether you would prefer Live Online or In-Person instruction, our electrical training courses can be tailored to meet your company's specific requirements and delivered to your employees in one location or at various locations.