COVID-19 Impact on US Electric Grid: utilities, ERCOT, PJM, and MISO brace for load shifts as remote work rises, industrial demand falls, and nuclear plants enforce pandemic planning to maintain reliability and resilience.
Key Points
Pandemic-driven changes in electricity demand and operations as utilities shift to remote work and reduced industrial use.
✅ Utilities enact remote work and suspend disconnections
✅ Grid operators model load shifts and maintain reliability
✅ Nuclear plants sustain operations with pandemic protocols
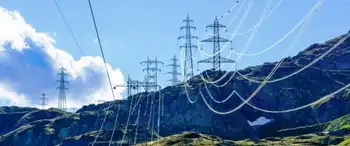
Operators of the nation's electric grid and energy companies are bracing for the spread of a virus that is undercutting power demand in countries across Asia and Europe as daily activities grind to a halt.
Owners of U.S. utilities and nuclear plants are canceling events, halting travel, pushing remote work and testing ill workers to slow the spread of the novel coronavirus.
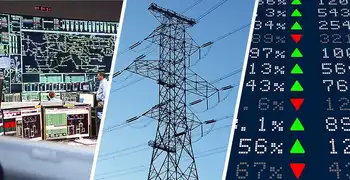
So far, grid operators in the United States say no substantial effect on the electricity demand has emerged, but that could change, even though some reports indicate the U.S. grid is safe for now amid COVID-19. Texas' main grid operator, the Electric Reliability Council of Texas (ERCOT), expressed uncertainty when asked whether it will see changes in demand patterns for power due to the virus.
"It's too early to tell," Leslie Sopko, a spokeswoman for ERCOT, said in an email.
The virus has already taken a toll on power demand overseas. The chairman of Japan's federation of electric utilities and president of Chubu Electric Power Co., Satoru Katsuno, told reporters Friday the country's power demand has weakened as industrial activity slows due to the outbreak, according to Reuters.
The news outlet similarly reported China's industrial power demand this year may decline as the virus curtailed factory output and prevented some employees from returning to work. And, according to Bloomberg, power use in Italy slumped 7.4% last week after the government there shut down schools and told workers to remain home, while Ontario electricity demand also declined as people stayed home.
U.S. utility executives said the sector is well prepared and has faced the threat of spreading infections before. More than a decade ago, global virus scares like SARS pushed companies to hammer out extensive disaster planning, and those have stuck.
"A lot of the foundational work on contingency planning is actually rooted in pandemic planning because of those experiences in the mid-2000s," Scott Aaronson, the Edison Electric Institute's vice president of security and preparedness, told E&E News. "There is a good body of work and a lot of planning and exercises that have gone into being able to operate through these challenges."
Keeping the nation's electric grid running is a top priority at the Department of Energy, said Chris Fall, the agency's point person for COVID-19, which the new coronavirus causes. "Our responsibility is to make sure the electrical grid is resilient and working," said Fall, who directs the department's Office of Science.
He told an agency podcast, called "Direct Current," that the department is working with the private sector and other elements of the energy system. "Obviously we are connected with other agencies like Homeland Security or [the Federal Energy Regulatory Commission] on things like the electrical grid and making sure we have power, and if those people get sick or impacted, we have backups for all of that," he said.
According to a bulletin EEI released on the issue, 40% of a company's employees could be out sick, be quarantined or stay home to care for sick family members. And pandemics may prevent "traditional mutual assistance programs that help companies restore service after natural disasters and weather events," EEI said, such as restoring power in Florida after major storms.
The utility sector is also juggling the needs of its customers. Many major utilities across the nation have vowed to suspend shut-offs and keep power, heat and water on for all customers — a particular concern for people who may be out of work and cannot afford to pay their bills. Companies are also suspending disconnections for nonpayment, some under direction from officials and regulators in states like Ohio and Connecticut, while in Canada Hydro One's peak rate policy has drawn attention among self-isolating customers.
Like other businesses preparing for pandemics, utilities focus on keeping the workforce healthy and operations running. But EEI's Aaronson noted that a key difference with keeping critical infrastructure humming is the possible requirement for the sheltering in place of essential employees who are unable to do their jobs from home, as some operators contemplate locking down key staff at work sites to ensure continuity.
Grid operators are also well-equipped to handle shifts in power demand, and he acknowledged the sector could see changes as more offices and businesses move to remote working. He compared it to the load demand shifts between weekdays and weekends.
"So on the weekends, you're going to have a lot of people at home," Aaronson said. "During the week, it's people in offices. But generally speaking, the ability to have that resiliency and redundancy, the ability to shift resources and the way the grid balances, that is not going to change."
Electricity demand from high-intensity industries like manufacturing or theme parks like Disneyland could also wane, he added, even as electricity inequality in California influences who is most affected.
"It's not just a load shift to the residential, but it's also the load drop in some cases," Aaronson said. "Some of the commercial and industrial customers are going to be working a little bit less than they are presently."
Nuclear plants
Work is continuing at the Plant Vogtle nuclear construction project after Georgia Power Co. announced that one of the site workers is being tested for the coronavirus. The utility does not have the results of that test, a Georgia Power spokesman said late yesterday afternoon. The person works primarily in an office setting and is not on the construction site where two nuclear reactors are being built.
A second worker was tested Saturday, and those results were negative, spokesman John Kraft told E&E News.
Vogtle boasts a high worker count of 9,000 across the entire construction site, which includes office buildings. This is mostly craft laborers, but there are also administrators, executives and Nuclear Regulatory Commission safety inspectors.
A number of contractors and vendors are also on site given the complexity of the project.
Employees who were near the office worker being tested have been sent home until the company receives results. If the test is positive, then those workers will stay home for 14 days, Georgia Power said.
"The company is taking every action to prepare for impacts of the COVID-19 pandemic," Kraft said in a statement. This includes using advice from medical professionals and the Atlanta-based Centers for Disease Control and Prevention.
Georgia Power, owned by Atlanta-based Southern Co., informed regulators at the NRC that a worker was being tested. The federal commission itself has pandemic plans in place to ensure continued oversight, including robust work-from-home capabilities and "social distancing" practices to limit close contact among employees at headquarters.
NRC spokesman Scott Burnell said in an email that telework is not unusual for the agency, and about 75% of its workforce is already equipped to work remotely. The commission tested its telework readiness Friday. Some positions require workers to stay on-site to ensure safe reactor operations, Burnell added.
The nuclear industry has maintained pandemic preparedness plans and procedures since 2006, which have been shared with federal agencies, according to Mary Love, a spokeswoman for the Nuclear Energy Institute. "NEI members are participating in weekly calls to facilitate communications, coordination and best practices," she said.
According to NEI statistics, each plant averages 500 to 1,000 workers. While not every position is essential to operations, some areas like the control room cannot be conducted remotely.
"We know that nuclear power plant operations and the availability of electric service will be tremendously important in minimizing the impact of the situation on the general public," Love added. "We are confident, based on extensive planning, that the industry will continue to operate nuclear plants safely as this event unfolds."
Grid operators
Hundreds of workers responsible for overseeing critical operations of the U.S. electric grid are being encouraged to work from home, their offices are being sanitized, and in-person meetings are being moved online.
PJM Interconnection, the nation's largest grid operator covering some 65 million people across Mid-Atlantic and Midwest states, said Friday a forecast on load changes was not yet available.
PJM has moved all stakeholder meetings online. Employee travel has been suspended, as have external visits to its headquarters in Valley Forge, Pa.
Employees "are equipped to work remotely, if necessary, to maintain business continuity," and PJM "is prepared and able to run and support all market applications from its campus or remotely, as needed," the operator said.
"PJM recognizes that these measures have significant impacts to our staff, members and stakeholders," PJM said on its coronavirus response webpage. "We are dedicated to striking a balance between those impacts and our number one priority — the reliability of the grid."
Still pending at the operator is a decision about its annual meeting in Chicago at the beginning of May. That decision will be made by April 3, PJM said.
The Midcontinent Independent System Operator (MISO), which runs the bulk power grid across 15 states and the Canadian province of Manitoba, is also holding meetings via conference call or online and restricting all business travel.
MISO has encouraged "nonessential" employees to work remotely, leaving only those who actively monitor and manage the operation of the grid working on-site.
The grid operator employs nearly 1,000 people, including 780 at its headquarters in Carmel, Ind.
A board meeting set for the last week of March in New Orleans hasn't yet been canceled, with a final decision on whether to move forward with the meeting expected today.
MISO said it hasn't encountered other changes in normal operations and has not seen significant shifts in electricity demand.
In Texas, ERCOT has about 750 employees, mostly at its campus in the city of Taylor. ERCOT's Sopko said the grid operator is encouraging employees who are not required to be on-site to work from home. The policy is voluntary at this time, but that could change quickly, she said Friday.
ERCOT is also taking extra steps to keep workers safe, including alternating use of facilities, encouraging social distancing and imposing control room measures as part of its pandemic planning, she added.
Energy companies
In the Midwest, utilities including DTE Energy Co., Commonwealth Edison, Consumers Energy and Ameren Corp. said they're following CDC guidance and working with state and local officials to help slow the spread of the virus. That means asking employees who can do their jobs at home to do so, restricting visitors to company offices, canceling large assemblies and nonessential business travel, and holding meetings by phone or online.
Chicago-based ComEd, which serves 4 million customers, is imposing a moratorium on service disconnections and waiving new late payment charges through at least May 1, in addition to working with customers who are facing financial hardships on a case-by-case basis to establish payment arrangements and identify energy assistance options, spokesman Paul Elsberg said.
Many of the Southeast's major energy companies are also curbing travel and encouraging telework, among other steps, in response to the coronavirus.
For Southern Co., this includes its Georgia Power unit; Southern Power; and employees of Southern Company Gas, who are in Illinois, Tennessee and Virginia. Southern has not extended the policies to its Alabama and Mississippi electric companies, spokesman Schuyler Baehman said.
Charlotte, N.C.-based Duke Energy Corp. has suspended all business travel unless workers are traveling by car. The energy giant also is encouraging its employees to rethink their own vacations if upcoming trips take them out of the country.
"Circumstances are changing rapidly around the world," the company said in a statement.
For workers who must come to the office, or work at power plants or on the lines, utilities are doubling down on disinfectant in those areas.
"We're also reminding our employees that we provide a very critical service; we need you well, we need you able," said Le-Ha Anderson, a spokeswoman for Richmond, Va.-based Dominion Energy Inc.
Dominion started asking employees a few weeks ago to take mobile devices home and make sure they have what they need to work remotely. Anyone who has traveled to one of the CDC-identified hot spots is asked to stay home for 14 days with no questions asked, Anderson said.
The federally owned Tennessee Valley Authority has reviewed and updated its plans on how it will operate during a pandemic but has not yet reached the point to have employees telework if they are able to do so.
"We come at this at a very phased approach," TVA spokesman Jim Hopson said. "We can't just shut the doors."
State utility commissions, too, have begun taking steps. In response to a state of emergency declared by Ohio Gov. Mike DeWine (R), the Public Utilities Commission of Ohio on Thursday directed utilities to act where possible to avoid suspending service to customers.
Will Seuffert, executive secretary of the Minnesota Public Utilities Commission, said in an email that the regulator has canceled all public hearings and agenda meetings for the next two weeks and has been supporting telework "throughout the agency" in response to the virus.
Related News