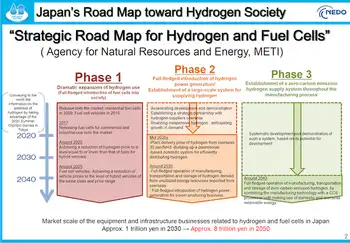
Auditors: TVA faces financial challenges

By Associated Press


CSA Z462 Arc Flash Training - Electrical Safety Essentials

Our customized live online or in‑person group training can be delivered to your staff at your location.

  • Live Online
  • 6 hours Instructor-led
  • Group Training Available
Regular Price:
$249
Coupon Price:
$199
Reserve Your Seat Today
The potentially $1 billion cleanup of a massive coal ash spill in Tennessee is just one of several "significant financial challenges" facing the Tennessee Valley Authority, internal auditors reported.

TVA's independent inspector general's office credited the self-supporting and largely self-regulating federal utility with maintaining adequate revenue, mostly from electric rates, of more than $10 billion annually despite a down economy.

But the auditors say TVA will need to do more in coming years to maintain financial health. That includes controlling costs and making sound capital investments — not just to fix the Kingston Fossil Plant ash spill but in the billions of dollars TVA expects to spend for pollution controls and new sources of electricity.

Considering the energy crisis facing the nation and congressional actions to limit greenhouse gases, "the financial soundness of TVA is perhaps more important now than at any other time in history," the report said.

TVA is the nation's largest public utility, serving nearly 9 million consumers through 158 distributors in Tennessee and parts of Alabama, Mississippi, Kentucky, Georgia, North Carolina and Virginia.

While agreeing that "financial performance is a prime factor in determining sustainable success," TVA Chief Financial Officer Kim Greene noted, "TVA is a healthier company today than it was in the past."

TVA has spent more than $100 million on the cleanup of the December 22 Kingston spill so far and estimates the final cost, excluding fines and litigation, at $675 million to $975 million.

But it's not the only financial hit TVA has taken. A federal court decision in North Carolina could force TVA to accelerate plans to add pollution controls to coal plants in Tennessee and Alabama.

Also, Wall Street's collapse cost TVA's retirement system nearly $1.5 billion and the fund to decommission TVA nuclear plants lost $240 million. TVA is being asked to restore $300 million to the retirement fund and may be asked to make payments to the nuclear fund, too.

This comes as TVA advances a plan to spend $2 billion annually through 2011 and nearly $3 billion in 2012 on pollution controls and upgrades to its aging fleet of power stations and transmission network.

"TVA is in the throes of making strategic decisions that will affect generations of valley residents," the inspector general's report said. "Historically, TVA has a spotty record in evaluating market conditions and investing in the right generation mix."

In 1966, TVA embraced a bold plan to build 17 nuclear reactors at eight sites. By the 1980s, only two plants were finished and most of the others were scrapped because electricity demand couldn't justify them.

Since then, TVA has returned to these unfinished sites for new generation — completing the Watts Bar Unit 1 reactor in Tennessee in 1996 and working to finish Watts Bar 2 by 2013. TVA also is weighing whether to build one to four reactors at Bellefonte in Alabama.

But those overly ambitious nuclear plans of the 1960s and 1970s left the agency with a $25 billion debt. Although TVA has trimmed the debt by $5 billion since 1996 — and thereby cut debt service payments from 25 cents of every dollar earned in 2000 to 13 cents in 2008 — that still gives TVA only a $5 billion cushion before hitting its congressional debt ceiling.

"We believe that power demand will continue to grow over the long term in the Tennessee Valley and TVA must prepare for that now by continuing to add new sources of clean energy and investing in the power systems to keep it reliable," Greene said.

She added that TVA should not be judged by the past. "Performance going forward should be measured by how management deals with evolving conditions to achieve the best possible outcomes for TVA's ratepayers," Greene said.

Related News

Ontario introduces new 'ultra-low' overnight hydro pricing

Ontario Ultra-Low Overnight Electricity Rates cut costs for shift workers and EV charging, with time-of-use pricing, off-peak savings, on-peak premiums, kilowatt-hour details, and Ontario Energy Board guidance for homes and businesses across participating utilities.


Key Points

Ontario's ultra-low overnight plan: 2.4c/kWh 11pm-7am for EVs, shift workers; higher daytime on-peak pricing.

✅ 2.4c/kWh 11pm-7am; 24c/kWh on-peak 4pm-9pm

✅ Best for EV charging, shift work, night usage

✅ Available provincewide by Nov 1 via local utilities


The Ontario government is introducing a new ultra-low overnight price plan that can benefit shift workers and individuals who charge electric vehicles while they sleep.

Speaking at a news conference on Tuesday, Energy Minister Todd Smith said the new plan could save customers up to $90 a year.

“Consumer preferences are still changing and our government realized there was more we could do, especially as the province continues to have an excess supply of clean electricity at night when province-wide electricity demand is lower,” Smith said, noting a trend underscored by Ottawa's demand decline during the pandemic.

The new rate, which will be available as an opt-in option as of May 1, will be 2.4 cents per kilowatt-hour from 11 p.m. to 7 a.m. Officials say this is 67 per cent lower than the current off-peak rate, which saw a off-peak relief extension during the pandemic.

However, customers should be aware that this plan will mean a higher on-peak rate, as unlike earlier calls to cut peak rates, Hydro One peak charges remained unchanged for self-isolating customers.

The new plan will be offered by Toronto Hydro, London Hydro, Centre Wellington Hydro, Hearst Power, Renfrew Hydro, Wasaga Distribution, and Sioux Lookout Hydro by May. Officials have said this will be expanded to all local distribution companies by Nov. 1.

With the new addition of the “ultra low” pricing, there are now three different electricity plans that Ontarians can choose from. Here is what you have to know about the new hydro options:

TIME OF USE:
Most residential customers, businesses and farms are eligible for these rates, similar to BC Hydro time-of-use proposals in another province, which are divided into off-peak, mid-peak and on-peak hours.

This is what customers will pay as of May 1 according to the Ontario Energy Board, following earlier COVID-19 electricity relief measures that temporarily adjusted rates:

 Off-peak (Weekdays between 7 p.m. and 7 a.m. and on weekends/holidays): 7.4 cents per kilowatt-hour
 Mid-Peak (Weekdays between 7 a.m. and 11 a.m., and between 5 p.m. and 7 p.m.): 10.2 cents per kilowatt-hour
 On-Peak ( Weekdays 11 a.m. to 5 p.m.): 15.1 cents per kilowatt-hour

TIERED RATES
This plan allows customers to get a standard rate depending on how much electricity is used. There are various thresholds per tier, and once a household exceeds that threshold, a higher price applies. Officials say this option may be beneficial for retirees who are home often during the day or those who use less electricity overall.

The tiers change depending on the season. This is what customers will pay as of May 1:

 Residential households that use 600 kilowatts of electricity per month and non-residential businesses that use 750 kilowatts per month: 8.7 cents per kilowatt-hour.
 Residences and businesses that use more than that will pay a flat rate of 10.3 cents per kilowatt-hour


ULTRA-LOW OVERNIGHT RATES
Customers can opt-in to this plan if they use most of their electricity overnight.

This is what customers will pay as of May 1:

  •  Between 11 p.m. and 7 a.m.: 2.4 cents per kilowatt-hour
  •  Weekends and holidays between 7 a.m. and 11 p.m.: 7.4 cents per kilowatt-hour
  •  Mid-Peak (Weekdays between 7 a.m. and 4 p.m., and between 9 p.m. and 11 p.m.): 10.2 cents per kilowatt-hour
  •  On-Peak (weekdays between 4 p.m. and 9 p.m.): 24 cents per kilowatt-hour

More information on these plans can be found on the Ontario Energy Board website, alongside stable pricing for industrial and commercial updates from the province.


Related News

View more

Egypt, Eni ink MoU on hydrogen production projects

Egypt-ENI Hydrogen MoU outlines joint feasibility studies for green and blue hydrogen using renewable energy, carbon capture, and CO2 storage, targeting domestic demand, exports, and net-zero goals within Egypt's energy transition.


Key Points

A pact to study green and blue hydrogen in Egypt, leveraging renewables, CO2 storage, and export/demand pathways.

✅ Feasibility study for green and blue hydrogen projects

✅ Uses renewables, SMR, carbon capture, and CO2 storage

✅ Targets local demand, exports, and net-zero alignment


The Egyptian Electricity Holding Company (EEHC) and the Egyptian Natural Gas Holding Company (EGAS) signed a memorandum of understanding (MoU) with the Italian energy giant Eni to assess the technical and commercial feasibility of green and blue hydrogen production projects in Egypt, which many see as central to power companies' future strategies worldwide today.

Under the MoU, a study will be conducted to assess joint projects for the production of green hydrogen using electricity generated from renewable energy and supported by regional electricity interconnections where relevant, and blue hydrogen using the storage of CO2 in depleted natural gas fields, according to a statement by the Ministry of Petroleum on Thursday.

The study will also estimate the potential local market consumption of hydrogen and export opportunities, taking cues from Ontario's hydrogen economy proposal to align electricity rates for growth.

This agreement is part of Eni's objective to achieve zero net emissions by 2050 and Egypt's strategy towards diversifying the energy mix and developing hydrogen projects in collaboration with major international companies, taking note of Italy's green hydrogen initiatives in Sicily as a comparable effort.

It signed the deal with Egyptian Natural Gas Holding (EGAS) and Egyptian Electricity Holding Co. (EEHC).

The companies will carry out a joint study on producing renewable energy powered green hydrogen, informed by electrolyzer investments in similar projects, where applicable. They will also work on blue hydrogen. This involves reforming natural gas and capturing the resulting CO2, in this instance in depleted natural gas fields.

The study will also consider domestic hydrogen use and export options, including funding models like the Hydrogen Innovation Fund now in Ontario.

Eni said the MoU was in line with its plans to eliminate net emissions and emissions cancel emission intensity by 2050. The company noted the agreement was in line with Egypt’s plan for the energy transition, in which it pursues hydrogen plans with major international companies, alongside broader clean-tech collaboration such as Tesla cooperation discussions in Dubai, to accelerate progress.


Related News

View more

Here are 3 ways to find out where your electricity comes from

US energy mix shows how the electric grid blends renewables, fossil fuels, nuclear, and hydro, varying by ISO/RTO markets, utilities, and state policies, affecting carbon emissions, pricing, reliability, and access.


Key Points

The US energy mix is the grid's source breakdown by region: fossil fuels, renewables, nuclear, and hydro.

✅ Check ISO or RTO dashboards for real-time generation by fuel source.

✅ Utilities may offer green power plans or RECs at modest premiums.

✅ Energy mix shifts with policy, pricing, and grid reliability needs.


There are few resources more important than energy. Sure, you may die if you don't eat for days. But your phone will die if you go too long without charging it. Energy feeds tech, the internet, city infrastructure, refrigerators, lights, and has evolved throughout U.S. history in profound ways. You get the idea. Yet unlike our other common needs, such as food, energy sources aren't exactly front of mind for most people. 

"I think a lot of people don't put a lot of bandwidth into thinking about this part of their lives," said Richard McMahon, the SVP of energy supply and finance at Edison Electric Institute, a trade group that represents investor-owned electric companies in the US. 

It makes sense. For most Americans, electricity is always there, and in many locations, there's not much of a choice involved, even as electricity demand is flat across the U.S. today. You sign up with a utility when you move into a new residence and pay your bills when they're due. 

But there's an important reality that indifference eschews: In 2018, a third of the energy-related carbon-dioxide emissions in the US came from the electric power sector, according to the US Energy Information Administration (EIA). 

A good chunk of that is from the residential sector, which consistently uses more energy than commercial customers, per EIA data.

Just as many people exercise choice when they eat, you typically also have a choice when it comes to your energy supply. That's not to say your current offering isn't what you want, or that switching will be easy or affordable, but "if you're a customer and want power with a certain attribute," McMahon said, "you can pretty much get it wherever you are." 

But first, you need to know the energy mix you have right now. As it turns out, it's not so straightforward. At all.

This brief guide may help. 

For some utility providers, you can find out if it publishes the energy mix online. Dominion Energy, which serves Idaho, North Carolina, Ohio, South Carolina, Utah, Virginia, West Virginia, and Wyoming, provides this information in a colored graphic. 

"Once you figure out who your utility is you can figure out what mix of resources they use," said Heidi Ratz, an electricity markets researcher at the World Resources Institute.

But not all utilities publish this information.

It has to do with their role in the grid and reflects utility industry trends in structure and markets. Some utility companies are vertically integrated; they generate power through nuclear plants or wind farms and distribute those electrons directly to their customers. Other utilities just distribute the power that different companies produce. 

Consider Consolidated Edison, or Con Ed, which distributes energy to parts of New York City. While reporting this story, Business Insider could not find information about the utility's energy mix online. When reached for comment, a spokesperson said, "we're indifferent to where it comes from."

That's because, in New York, distribution utilities like Con Ed often buy energy through a wholesale marketplace.

Take a look at this map. If you live in one of the colored regions, your electricity is sold on a wholesale market regulated by an organization called a regional transmission organization (RTO) or independent system operator (ISO). Distribution utilities like Con Ed often buy their energy through these markets, based on availability and cost, while raising questions about future utility revenue models as prices shift. 

Still, it's pretty easy to figure out where your energy comes from. Just look up the ISO or RTO website (such as NYISO or CAISO). Usually, these organizations will provide energy supply information in near-real time. 

That's exactly what Con Edison (which buys energy on the NYISO marketplace) suggested. As of Friday morning, roughly 40% of the energy on the market place was natural gas or other fossil fuels, 34% was nuclear, and about 22% was hydro. 

If you live in another region governed by an ISO or RTO, such as in most of California, you can do the same thing. Like NYISO, CAISO has a dashboard that shows (again, as of Friday morning) about 36% of the energy on the market comes from natural gas and more than 20% comes from renewables. 

In the map linked above, you'll notice that some of the ISOs and RTOs like MISO encompass enormous regions. That means that even if you figure out where the energy in your market comes from, it's not going to be geographically specific. But there are a couple of ways to drill down even further. 

The Environmental Protection Agency has a straightforward tool called Power Profiler. You can enter your zip code to see the fuel mix in your area. But it's not perfect. The data are from 2016 and, in some regions of the country like the upper Midwest, they aren't much more localized, and some import dirty electricity due to regional trading. 

The World Resources Institute also has a tool that allows you to see the electricity mix by state, based on 2017 data from EIA. These numbers represent power generation, not the electricity actually flowing into your sockets, but they offer a rough idea of what energy resources are operating in your state. 

One option is to check with your utility to see if it has a "green power" offering. Over 600 utilities across the country have one, according to the Climate Reality Project, though they often come at a slightly higher cost. It's typically on the scale of just a few more cents per kilowatt-hour. 

There are also independent, consumer-facing companies like Arcadia and Green Mountain Energy that allow you to source renewable energy, by virtually connecting you to community solar projects or purchasing Renewable Energy Certificates, or RECs, on your behalf, as America goes electric and more options emerge. 

"RECs measure an investment in a clean energy resource," Ratz said, in an email. "The goal of putting that resource on the grid is to push out the need for dirtier resources."

The good news: Even if you do nothing, your energy mix will get cleaner. Coal production has fallen to lows not seen since the 1980s, amid disruptions in coal and nuclear sectors that affect reliability and costs, while renewable electricity generation has doubled since 2008. So whether you like it or not, you'll be roped into the clean energy boom one way or another. 


Related News

View more

Ontario Energy Board Sets New Electricity Rate Plan Prices and Support Program Thresholds

OESP Eligibility 2024 updates Ontario electricity affordability: TOU, Tiered, Ultra-Low-Overnight price plans, online bill calculator, higher income thresholds, monthly credits for low-income households, and a winter disconnection ban for residential customers.


Key Points

Raises income thresholds and credits to help low-income Ontarians cut electricity costs and choose suitable price plans.

✅ TOU, Tiered, and ULO price plans with online bill calculator

✅ Income eligibility thresholds raised up to 35% on March 1, 2024

✅ Winter disconnection ban for residences: Nov 15, 2023 to Apr 30, 2024


Residential, small business and farm customers can choose their price plan, either Time-Of-Use (TOU), Tiered or the ultra-low overnight rates price plan available to many customers. The OEB has an online bill calculator to help customers who are considering a switch in price plans and monitoring changes for electricity consumers this year. 

The Government of Ontario announced on Friday, October 19, 2023, that it is raising the income eligibility thresholds that enable Ontarians to qualify for the Ontario Electricity Support Program (OESP) by up to 35 percent. OESP is part of Ontario’s energy affordability framework and other support for electric bills meant to reduce the cost of electricity for low-income households by applying a monthly credit directly on to electricity bills.. The higher income eligibility thresholds will begin on March 1, 2024.

The amount of OESP bill credit is determined by the number of people living in a home and the household’s combined income, and can help offset typical bill increases many customers experience. The current income thresholds cap income eligibility at $28,000 for one-person households and $52,000 for five-person households, and temporary measures like the off-peak price freeze have also influenced bills in recent periods.

The new income eligibility thresholds, which will be in effect beginning March 1, 2024, will allow many more families to access the program as rates are about to change across Ontario.

In addition, under the OEB’s winter disconnection ban, which follows the Nov. 1 rate increase, electricity distributors cannot disconnect residential customers for non-payment from November 15, 2023, to April 30, 2024.


Related News

View more

Which of the cleaner states imports dirty electricity?

Hourly Electricity Emissions Tracking maps grid balancing areas, embodied emissions, and imports/exports, revealing carbon intensity shifts across PJM, ERCOT, and California ISO, and clarifying renewable energy versus coal impacts on health and climate.


Key Points

An hourly method tracing generation, flows, and embodied emissions to quantify carbon intensity across US balancing areas.

✅ Hourly traces of imports/exports and generation mix

✅ Consumption-based carbon intensity by balancing area

✅ Policy insights for renewables, coal, health costs


In the United States, electricity generation accounts for nearly 30% of our carbon emissions. Some states have responded to that by setting aggressive renewable energy standards; others are hoping to see coal propped up even as its economics get worse. Complicating matters further is the fact that many regional grids are integrated, and as America goes electric the stakes grow, meaning power generated in one location may be exported and used in a different state entirely.

Tracking these electricity exports is critical for understanding how to lower our national carbon emissions. In addition, power from a dirty source like coal has health and environment impacts where it's produced, and the costs of these aren't always paid by the parties using the electricity. Unfortunately, getting reliable figures on how electricity is produced and where it's used is challenging, even for consumers trying to find where their electricity comes from in the first place, leaving some of the best estimates with a time resolution of only a month.

Now, three Stanford researchers—Jacques A. de Chalendar, John Taggart, and Sally M. Benson—have greatly improved on that standard, and they have managed to track power generation and use on an hourly basis. The researchers found that, of the 66 grid balancing areas within the United States, only three have carbon emissions equivalent to our national average, and they have found that imports and exports of electricity have both seasonal and daily changes. de Chalendar et al. discovered that the net results can be substantial, with imported electricity increasing California's emissions/power by 20%.

Hour by hour
To figure out the US energy trading landscape, the researchers obtained 2016 data for grid features called balancing areas. The continental US has 66 of these, providing much better spatial resolution on the data than the larger grid subdivisions. This doesn't cover everything—several balancing areas in Canada and Mexico are tied in to the US grid—and some of these balancing areas are much larger than others. The PJM grid, serving Pennsylvania, New Jersey, and Maryland, for example, is more than twice as large as Texas' ERCOT, in a state that produces and consumes the most electricity in the US.

Despite these limitations, it's possible to get hourly figures on how much electricity was generated, what was used to produce it, and whether it was used locally or exported to another balancing area. Information on the generating sources allowed the researchers to attach an emissions figure to each unit of electricity produced. Coal, for example, produces double the emissions of natural gas, which in turn produces more than an order of magnitude more carbon dioxide than the manufacturing of solar, wind, or hydro facilities. These figures were turned into what the authors call "embodied emissions" that can be traced to where they're eventually used.

Similar figures were also generated for sulfur dioxide and nitrogen oxides. Released by the burning of fossil fuels, these can both influence the global climate and produce local health problems.

Huge variation
The results were striking. "The consumption-based carbon intensity of electricity varies by almost an order of magnitude across the different regions in the US electricity system," the authors conclude. The low is the Bonneville Power grid region, which is largely supplied by hydropower; it has typical emissions below 100kg of carbon dioxide per megawatt-hour. The highest emissions come in the Ohio Valley Electric region, where emissions clear 900kg/MW-hr. Only three regional grids match the overall grid emissions intensity, although that includes the very large PJM (where capacity auction payouts recently fell), ERCOT, and Southern Co balancing areas.

Most of the low-emissions power that's exported comes from the Pacific Northwest's abundant hydropower, while the Rocky Mountains area exports electricity with the highest associated emissions. That leads to some striking asymmetries. Local generation in the hydro-rich Idaho Power Company has embodied emissions of only 71kg/MW-hr, while its imports, coming primarily from Rocky Mountain states, have a carbon content of 625kg/MW-hr.

The reliance on hydropower also makes the asymmetry seasonal. Local generation is highest in the spring as snow melts, but imports become a larger source outside this time of year. As solar and wind can also have pronounced seasonal shifts, similar changes will likely be seen as these become larger contributors to many of these regional grids. Similar things occur daily, as both demand and solar production (and, to a lesser extent, wind) have distinct daily profiles.

The Golden State
California's CISO provides another instructive case. Imports represent less than 30% of its total electric use in 2016, yet California electricity imports provided 40% of its embodied emissions. Some of these, however, come internally from California, provided by the Los Angeles Department of Water and Power. The state itself, however, has only had limited tracking of imported emissions, lumping many of its sources as "other," and has been exporting its energy policies to Western states in ways that shape regional markets.

Overall, the 2016 inventory provides a narrow picture of the US grid, as plenty of trends are rapidly changing our country's emissions profile, including the rise of renewables and the widespread adoption of efficiency measures and other utility trends in 2017 that continue to evolve. The method developed here can, however, allow for annual updates, providing us with a much better picture of trends. That could be quite valuable to track things like how the rapid rise in solar power is altering the daily production of clean power.

More significantly, it provides a basis for more informed policymaking. States that wish to promote low-emissions power can use the information here to either alter the source of their imports or to encourage the sites where they're produced to adopt more renewable power. And those states that are exporting electricity produced primarily through fossil fuels could ensure that the locations where the power is used pay a price that includes the health costs of its production.


Related News

View more

Taiwan's economic minister resigns over widespread power outage

Taiwan Power Blackout disrupts Taipei and commercial hubs after a Taoyuan natural gas plant error, triggering nationwide outage, grid failure, elevator rescues, power rationing, and the economic minister's resignation, as CPC Corporation restores supply.


Key Points

A nationwide Taiwan outage from human error at a Taoyuan gas plant, triggering rationing and a minister's resignation.

✅ Human error disrupted natural gas supply at Taoyuan plant

✅ 6.68 million users affected; grid failure across cities

✅ Minister Lee resigned; President Tsai ordered a review


Taiwan's economic minister resigned after power was knocked out in many parts of Taiwan, with regional parallels such as China power cuts highlighting grid vulnerabilities, including capital Taipei's business and high-end shopping district, due to an apparent "human error" at a key power plant.

Economic Affairs minister Lee Chih-kung tendered his resignation verbally to Premier Lin Chuan, United Daily News reported, citing a Cabinet spokesman. Lin accepted the resignation, the spokesman said according to the daily.

As many as 6.68 million households and commercial units saw their power supply cut or disrupted on Tuesday after "human error" disrupted natural gas supply at a power plant in northern Taiwan's Taoyuan, the semi-official Central News Agency reported, citing the government-controlled oil company CPC Corporation as saying.

The company added that power at the plant, Taiwan's biggest natural gas power plant, resumed two minutes later.

In New Taipei City, there were at least 27,000 reported cases of people being stuck in lifts. Photos in social media also showed huge crowds stranded in lift lobby in Taipei's iconic 101-storey Taipei 101 building.

Power rationing was implemented beginning 6pm, and, as seen in the National Grid short supply warning in other markets, such steps aim to stabilize supply, Central News Agency said. Power supply was gradually being restored beginning at about 9:40pm. news reports said.

President Tsai Ing-wen apologised for the blackout, noting parallels with Japan's near-blackouts that underscored grid resilience, and said that she has ordered all relevant departments to produce clear report in the shortest time possible.

"Electricity is not just a problem about people's livelihoods but also a national security issue. A comprehensive review must be carried out to find out how the electric power system can be so easily paralysed by human error," said Ms Tsai in a Facebook post.

Taiwan has been at risk of a power shortage after a recent typhoon knocked down a power transmission tower in Hualien county along the eastern coast of Taiwan, rather than a demand-driven slowdown like the China power demand drop during pandemic factory shutdowns. This reduced the electricity supply by 1.3million kilowatts, or about 4 per cent of the operating reserve.

That was followed by the breakdown of a power generator at Taiwan's largest power plant, which further reduced the operating reserve by 1.5 per cent.

The situation is worsened by the ongoing heatwave that has hit Taiwan, with temperatures soaring to 38 degrees Celsius over the past week.

As a result, the government had imposed the rationing of electricity, and, highlighting how regional strains such as China's power woes can ripple into global markets, switched off all air-conditioning in many of its Taipei offices, a move that drew some public backlash.


Related News

View more

Sign Up for Electricity Forum’s Newsletter

Stay informed with our FREE Newsletter — get the latest news, breakthrough technologies, and expert insights, delivered straight to your inbox.

Electricity Today T&D Magazine Subscribe for FREE

Stay informed with the latest T&D policies and technologies.
  • Timely insights from industry experts
  • Practical solutions T&D engineers
  • Free access to every issue

Live Online & In-person Group Training

Advantages To Instructor-Led Training – Instructor-Led Course, Customized Training, Multiple Locations, Economical, CEU Credits, Course Discounts.

Request For Quotation

Whether you would prefer Live Online or In-Person instruction, our electrical training courses can be tailored to meet your company's specific requirements and delivered to your employees in one location or at various locations.