New York Green New Deal accelerates clean energy and climate action, targeting carbon neutrality with renewable energy, offshore wind, solar, energy storage, and green jobs while advancing environmental justice and economy-wide decarbonization.
Key Points
New York's plan for 100% clean power by 2040 and 70% renewables by 2030, with a just transition and green jobs.
✅ 100% carbon-free electricity by 2040; 70% renewables by 2030
✅ 9,000 MW offshore wind and 3,000 MW energy storage targets
✅ Just transition focuses on jobs, equity, and affordability
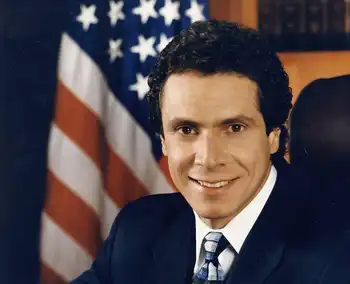
New York Governor Andrew M. Cuomo announced the Green New Deal, a nation-leading clean energy and jobs agenda that will aggressively put New York State on a path to net-zero electricity and economy-wide carbon neutrality, is included in the 2019 Executive Budget. The landmark plan provides for a just transition to clean energy that spurs growth of the green economy and prioritizes the needs of low- to moderate-income New Yorkers.
"Climate change is a reality, and the consequences of delay are a matter of life and death. We know what we must do. Now we have to have the vision, the courage, and the competence to get it done," Governor Cuomo said. "While the federal government shamefully ignores the reality of climate change and fails to take meaningful action, we are launching the first-in-the-nation Green New Deal to seize the potential of the clean energy economy, set nation's most ambitious goal for carbon-free power, and ultimately eliminate our entire carbon footprint."
During Governor Cuomo's first two terms, New York banned fracking of natural gas, committed to phasing out coal power by 2020, mandated 50 percent renewable power by 2030, and established the U.S. Climate Alliance to uphold the Paris Agreement, reflecting the view that decarbonization is irreversible under a clean energy economy. Under the Reforming the Energy Vision agenda, New York has held the largest renewable energy procurements in U.S. history, solar has increased nearly 1,500 percent, and offshore wind is poised to transform the State's electricity supply to be cleaner and more sustainable. Through Governor Cuomo's Green New Deal, New York will take the bold next steps to secure a clean energy future that protects the environment for generations to come while growing the clean energy economy.
100 Percent Clean Power by 2040 Coupled with New Nation-leading Renewable Energy Mandates
The Green New Deal will statutorily mandate New York's power be 100 percent carbon-free by 2040, the most aggressive goal in the United States and five years ahead of a target recently adopted by California state policymakers. The cornerstone of this new mandate is a significant increase of New York's successful Clean Energy Standard mandate from 50 percent to 70 percent renewable electricity by 2030. This globally unprecedented ramp-up of renewable energy will include:
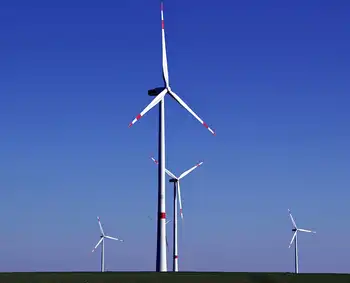
- Quadrupling New York's offshore wind target to 9,000 megawatts by 2035, up from 2,400 megawatts by 2030
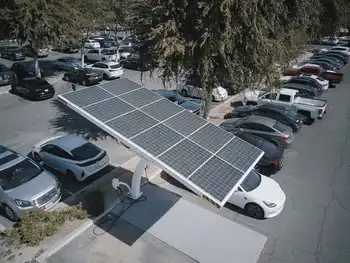
- Doubling distributed solar deployment to 6,000 megawatts by 2025, up from 3,000 megawatts by 2023
- More than doubling new large-scale land-based wind and solar resources through the Clean Energy Standard
- Maximizing the contributions and potential of New York's existing renewable resources
- Deploying 3,000 megawatts of energy storage by 2030, up from 1,500 megawatts by 2025
- Develop an Implementation Plan to Make New York Carbon Neutral
The Green New Deal will create the State's first statutory Climate Action Council, comprised of the heads of relevant State agencies and other workforce, environmental justice, and clean energy experts to develop a comprehensive plan to make New York carbon neutral by significantly and cost-effectively reducing emissions from all major sources, including electricity, transportation, buildings, industry, commercial activity, and agriculture. The Climate Action Council will consider a range of possible options, including the feasibility of working with the U.S. Climate Alliance to create a new multistate emissions reduction program that covers all sectors of the economy, including transportation and industry, and exploring ways to leverage the successful Regional Greenhouse Gas Initiative to drive transformational investment in the clean energy economy and support a just transition.
At the national level, a historic climate deal is reshaping incentives and standards for clean energy deployment across the country.
The Green New Deal will also include an ambitious strategy to move New York's statewide building stock to carbon neutrality. The agenda includes:
Advancing legislative changes to strengthen building energy codes and establish appliance efficiency standards
Directing State agencies to ensure that their facilities uphold the strongest energy efficiency and sustainability standards
Developing a Net Zero Roadmap to chart a course to statewide carbon neutrality in buildings
A Multibillion Dollar Green New Deal Investment in the Clean Tech Economy that will Reduce Greenhouse Gas Emissions
Demonstrating New York's immediate commitment to implementing the nation's most ambitious clean energy agenda and creating high-quality clean energy jobs, Governor Cuomo is announcing $1.5 billion in competitive awards to support 20 large-scale solar, wind and energy storage projects across upstate New York. These investments will add over 1,650 megawatts of capacity and generate over 3,800,000 megawatt-hours of renewable energy annually - enough to power nearly 550,000 homes and create over 2,600 short and long-term jobs. Combined with the renewable energy projects previously announced under the Clean Energy Standard, New York has now awarded more than $2.9 billion to 46 projects statewide, enough to power over one million households.
The Green New Deal also includes new investments to jumpstart New York's offshore wind energy industry and support the State's world-leading target of 9,000 megawatts by 2035. New York will invest up to $200 million in port infrastructure to match private sector investment in regional development of offshore wind. This multi-location investment represents the nation's largest infrastructure commitment to offshore wind and solidifies New York's position as the hub of the burgeoning U.S. offshore wind industry.
These new investments build upon a $250 million commitment to electric vehicle infrastructure by the New York Power Authority's EVolve program, $3.5 billion in private investment in distributed solar driven by NYSERDA's NY-Sun program, and NY Green Bank transactions mobilizing nearly $1.75 billion in private capital for clean energy projects.
A Just Transition to a Clean Energy Economy
Deliver Climate Justice for Underserved Communities: The Green New Deal will help historically underserved communities prepare for a clean energy future and adapt to climate change by:
Giving communities a seat at the table by codifying the Environmental Justice and Just Transition Working Group into law and incorporating it into the planning process for the Green New Deal's implementation.
Directing the State's low-income energy task force to identify reforms to achieve greater impact of the public energy funds expended each year in order to increase the effect of funds and initiatives that target energy affordability to underserved communities.
Directing each of the State's ten Regional Economic Development Councils to develop an environmental justice strategy for their region.
Finance a Property Tax Compensation Fund to Help Communities Transition to the Clean Energy Economy: Governor Cuomo is introducing legislation to finance the State's $70 million Property Tax Compensation Fund to continue helping communities directly affected by the transition away from dirty and obsolete energy industries and toward the new clean energy economy. Specifically, this funding will protect communities impacted by the retirement of conventional power generation facilities.
Protect Labor Rights: To ensure creation of high-quality clean energy jobs, large-scale renewable energy projects supported by the Green New Deal will require prevailing wage, and the State's offshore wind projects will be supported by a requirement for a Project Labor Agreement.
Develop the Clean Tech Workforce: To prepare New York's workforce for the transition, New York State will take new steps to support workforce development, including establishing a New York State Advisory Council on Offshore Wind Economic and Workforce Development, as well as investing in an offshore wind training center that will provide New Yorkers with the skills and safety training required to construct this clean energy technology in New York.
Richard Kauffman, Chairman of Energy and Finance for New York, said, "Governor Cuomo's Green New Deal will advance New York State further into the clean energy future, and we won't let the Trump Administration push us backwards. Governor Cuomo's new commitments ensure New York is the undisputed national clean energy and climate leader, and we will continue to build upon the foundations of the REV agenda to achieve a sustainable economy and healthy environment for generations of New Yorkers to come."
Alicia Barton, President and CEO, NYSERDA, said, "Climate scientists have made frighteningly clear that averting the worst effects of climate change will require bold action, not incremental steps, and Governor Cuomo's Green New Deal boldly goes where no others have before. His unwavering climate agenda includes the most aggressive clean energy target in U.S. history, the largest commitments to renewable energy and to offshore wind in the nation, a massive mobilization of clean energy jobs and an unprecedented investment in offshore wind port infrastructure. Together these actions make New York the clear national leader in the fight against climate change, and will show the world that New York can and will achieve a clean energy future for the sake of future generations."
DEC Commissioner Basil Seggos said, "The threat of climate change calls for bold action like Governor Cuomo's comprehensive agenda to make New York State carbon neutral. The Green New Deal ensures New York is continuing our nation-leading efforts to capitalize on the economic potential of the clean energy economy, while making sure those most vulnerable to climate change are benefitting from the state's efforts and investments. I look forward to working with my agency and authority partners on the Climate Action Council to develop and implement meaningful solutions to reduce greenhouse gas emissions from all sectors of our economy."
John B. Rhodes, CEO, Department of Public Service, said, "With this nation-leading Green New Deal, Governor Cuomo puts New York on the path to fully clean electricity and to carbon neutrality with the strongest renewable energy goals in the nation. This will deliver the energy system that New York needs - cost-effective, reliable, and 100% clean.”
Related News