Texas Deep Freeze Energy Crisis strains grids as polar vortex triggers rolling blackouts, record natural gas and electricity prices, refinery shutdowns, WTI gains, and scarcity pricing across Texas, Oklahoma, SPP, and Mexico.
Key Points
A polar vortex slamming Texas energy: outages, record power prices, gas spikes, and reduced oil output.
✅ Record gas trades near $500/mmBtu; power hits $6,000/MWh
✅ WTI tops $60 as Texas shuts in ~1 million bpd
✅ Rolling blackouts across SPP; ERCOT scarcity pricing
A deep freeze is roiling electricity markets in more than a dozen U.S. states, leading to record-setting prices for electricity and natural gas, knocking oil production off line and shutting down some of North America’s largest refineries.
“It’s freakishly cold,” said Eric Fell, a senior natural gas analyst with Wood Mackenzie in Houston, where record cold temperatures and snow have blanketed the city, caused rolling power outages, shut down refineries and sent both natural gas and electricity prices soaring.
'It’s freakishly cold': Deep freeze slams North American energy sector
The polar vortex has led to freezing temperatures in every county in Texas, the largest energy-producing state in the U.S., and caused massive disruptions across the North American energy complex, triggering Texas power outages as far south as Mexico.
As the plunge in temperatures forced oil companies to shut in an estimated one million barrels of oil production in Texas on Monday, the West Texas Intermediate benchmark price rose above the US$60 per barrel threshold for the first time in a year to settle up 1 per cent, or US65 cents, at US$60.12 per barrel.
President Joe Biden declared an emergency on Monday, unlocking federal assistance to Texas.
People carry groceries from a local gas station on Monday in Austin, Texas. Winter storm Uri has brought historic cold weather to Texas, causing traffic delays and power outages.
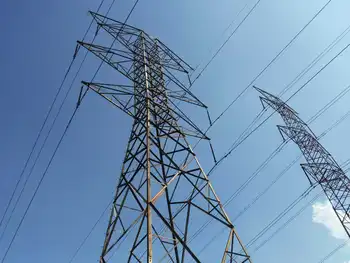
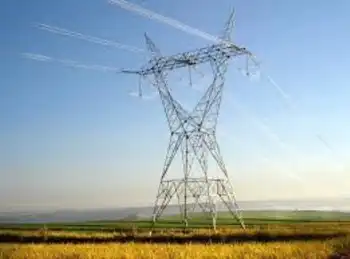
Frozen wind farms are just a small piece of Texas’s power grid woes right now.
Fell said regional natural gas and electricity prices in Oklahoma and Texas broke U.S. records over the weekend.
On Friday, Oklahoma gas transmission prices averaged US$350 per million British thermal units and Fell said one trade went as high as US$600 per mmBtu. In parts of the Texas panhandle and elsewhere, prices jumped to US$200, “all of which individually would have been new records,” Fell said, noting the previous record was US$160.
On Monday, natural gas for physical delivery in the U.S. was trading for as much as US$500 per mmBtu as demand for the heating and power plant fuel soared. Spot gas has been trading for hundreds of dollars across the central U.S. since Thursday with a surge in heating demand triggering widespread blackouts and sending electricity prices soaring. The fuel normally trades in the region for less than US$3 per mmBtu.
Similarly, electricity prices in Texas surged to US$6,000 per megawatt hour on Monday, as U.S. power companies grapple with supply-chain constraints, which Fell said is “100 times the normal price.”
“You’re seeing scarcity pricing in power and gas. The only thing that’s different this time is it’s staying there – it’s not just an hour or two hours, it’s the whole day,” he said.
The blast of Arctic cold, which has blanketed Canada and much of the U.S., has created a massive draw on natural gas supplies, used both for home heating and industrial uses like electricity generation.
Little Rock, Ark.-based Southwest Power Pool, which coordinates electricity distribution for parts of 14 states including Oklahoma Kansas, Nebraska and even as far north as North Dakota, announced rolling blackouts across its network on Monday as a result of the power outages.
“In our history as a grid operator, this is an unprecedented event and marks the first time SPP has ever had to call for controlled interruptions of service” SPP’s executive vice-president and chief operating officer Lanny Nickell said in a release, adding the move was “a last resort” to “prevent circumstances from getting worse.”
The frigid conditions have led to a surge in natural gas prices across the continent, including in Alberta where the AECO benchmark price jumped to a seven-year high of $6.36 per thousand cubic feet last week, a price not seen since 2014.
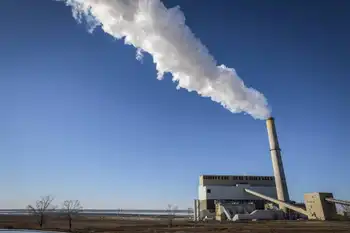
Energy systems in Texas and Oklahoma, which are major energy exporters to other U.S. states, are built to withstand severe heat – not extreme cold. The result is a disruption to the gas supply at exactly the time the U.S. energy system is demanding those molecules.
“Given how far south it’s gone into Texas, this is where you have a lot of gas production that isn’t properly winterized,” said Jeremy McCrea, an analyst with Raymond James covering the natural gas industry.
Related News