With vast reserves, Montana eyes coal expansion

By Reuters


NFPA 70e Training

Our customized live online or in‑person group training can be delivered to your staff at your location.

  • Live Online
  • 6 hours Instructor-led
  • Group Training Available
Regular Price:
$199
Coupon Price:
$149
Reserve Your Seat Today
Underneath Montana lies an estimated $1.5 trillion of coal, but with uncertainty about future environmental rules, investors are wary about opening new mines in the rugged western U.S. state.

Many say a big boost to Montana coal production can only follow November's national election, when a new president could lead the way in clarifying environmental laws and encouraging cleaner coal technology. Montana ends the long U.S. state-by-state presidential primary process.

"Nothing is going to happen until we have a carbon law, that's the bottom line," Montana Gov. Brian Schweitzer told Reuters. "It needs a new president."

"But what's happening right now is the partnerships are being formed, the capital is being raised, the coal is being acquired, so everybody is ready to move as soon as we have a carbon law."

The state produced 43.4 million tons of coal in 2007, up 3.7 percent on the year, the biggest growth rate of any state. That output is just a tenth of that in neighboring Wyoming, where coal is generally easier to extract and transport.

Yet Montana, which borders Canada, sits on America's greatest coal reserves: 120 billion tons, worth about $1.5 trillion at current prices, according to Jay Gunderson, a research geologist at the Montana Bureau of Mines and Geology.

"Coal demand is up all over the world," said John O'Laughlin, Westmoreland Coal Company's vice president, coal operations. "With the price for a barrel of oil, there's a lot of interest in Montana coal. But we've got to figure out a way to sequester the CO2. That's what is holding us back."

The company's 34-year-old Absaloka mine in southeast Montana reached a record 7.35 million tons output last year. In 2009, it plans to expand into adjacent Crow Indian reservation land for the first time.

All the presidential candidates back an expansion of some form of coal using more environmentally friendly technology.

"We're sitting on the world's largest supply of energy in our coal resources," presumed Republican nominee Sen. John McCain said recently. "That has to be one of the fundamental components of energy independence."

Among the Democrats, Sen. Barack Obama has said he would increase resources for commercialization and development of low-emission coal plants, and Sen. Hillary Clinton has called on industry to implement clean coal technology.

"It has been kind of refreshing to hear Hillary and Obama talk about clean coal," Westmoreland's O'Laughlin said. "There is at least a glimmer of acceptance."

Montana has not opened a new coal mine in decades.

"Companies are reluctant to invest billions of dollars in infrastructure not knowing what the government is going to do about CO2," said Gunderson at the Bureau of Mines and Geology.

At Absaloka, a single machine - a dragline excavator that scoops out slabs of rolling countryside to get near the coal - costs $120 million. Elsewhere, workers dynamite sections of earth and expensive trucks with wheels taller than people carry away coal to be crushed in a vast facility before transport.

Great Northern Properties is the largest private holder of U.S. coal reserves with 20 billion tons, mostly in Montana and North Dakota. Chuck Kerr, president of the Houston-based company, said the nation will eventually tap Montana's coal.

"It's not a matter of if, it's a matter of when," he said in an interview. "The silent majority back coal development because it's a very cheap source of fuel."

Gov. Schweitzer has long championed Fischer-Tropsch technology to convert coal into liquid fuels that can be burned in a greener way than traditional coal, but no one has yet invested the many billions needed for such a plant.

"It is incredibly expensive to deploy," Kerr said.

But there are signs of other new projects.

John DeMichiei, president and CEO of Bull Mountain Coal Mining Inc, expects to get private financing by July 15 for what he said could be the largest underground coal mine in the world, located 35 miles north of Billings, Montana.

"It takes extreme capital investment," he said. "With these sales prices starting to at least support this type of capital investment, I think you will see more investment in Montana in terms of coal."

DeMichiei hopes to begin large-scale production at Bull Mountain by September 2009, with production of 14 million tons a year. The mine, with 430 million tons in reserve, now produces just 40,000 tons a month, he said in an interview.

The company's main investor is Airlie Group of Greenwich, Connecticut. "We are in discussions with a number of parties to get the mine fully financed and build a railroad and get it to be one of the largest long wall mines in the United States, if not the largest," Airlie Managing Director Andy Dwyer said.

But he added: Wyoming's "Powder River Basin has established rail lines and transportation hubs and the ability to substantially expand. So if there isn't going to be any substantial increase in demand then quite frankly the Powder River Basin can meet a good deal of that demand."

Schweitzer said despite its greater reserves and plans for expansion, Montana may never surpass Wyoming in production. "The world of hydrocarbons will be over and we'll still have 90 percent of our coal in the ground," he predicted.

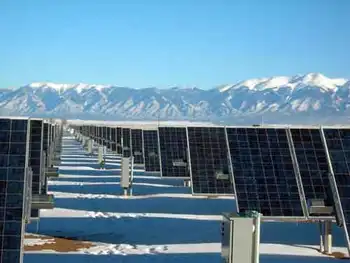
"Wind and solar and hydrogen - they'll be the energy sources of the future. Forty, 50 years from now hydrocarbons won't be an energy source of any large quality."

Related News

New Orleans Levees Withstood Hurricane Ida as Electricity Failed

Hurricane Ida New Orleans Infrastructure faced a split outcome: levees and pumps protected against storm surge, while the power grid collapsed as transmission lines failed, prompting large-scale restoration efforts across Louisiana and Mississippi.


Key Points

It summarizes Ida's impact: levees and pumps held, but the power grid failed, causing outages and slow restoration.

✅ Levees and pumps mitigated flooding and storm surge impacts.

✅ All transmission lines failed, crippling the power grid.

✅ Crews and drones assess damage; restoration may take weeks.


Infrastructure in the city of New Orleans turned in a mixed performance against the fury of Hurricane Ida, with the levees and pumps warding off catastrophic flooding even as the electrical grid, part of the broader Louisiana power grid, failed spectacularly.

Ida’s high winds, measuring 150 miles (240 kilometers) an hour at landfall, took out all eight transmissions lines that deliver power into New Orleans, ripped power poles in half and crumpled at least one steel transmission tower into a twisted metal heap, knocking out electricity to all of the city. A total of more than 1.2 million homes and businesses in Louisiana and Mississippi lost power. While about 90,000 customers were reconnected by Monday afternoon, many could face days without electricity, and frustration can mount as seen during the Houston outage after major storms.

In contrast, the New Orleans area’s elaborate flood defenses seem to have held up, a vindication of the Army Corps of Engineers’ $14.5 billion project to rebuild levees, flood gates and pumps in the wake of the devastation wrought by Hurricane Katrina in 2005. While there were reports of scattered deaths tied to Ida, the city escaped the kind of flooding that destroyed entire neighborhoods in Katrina’s wake, left parts of the city uninhabitable for months and claimed 1,800 lives. 

“The situation in New Orleans, as bad as it is today with the power, could be so much worse,” Louisiana Governor John Bel Edwards said Monday on the Today Show, praising the levee system’s performance. “All you have to do is go back 16 years to get a glimpse of what that would have been like.”

While the levees’ resiliency is no doubt due to the rebuilding effort that followed Katrina, the starkly different outcomes also stems from the storms’ different characteristics. Katrina slammed the coast with a 30-foot storm surge of ocean water, while preliminary estimates from Ida put its surge far lower. 


Ida’s winds, however, were stronger than Katrina’s, and that’s what ultimately took out so many power lines, a dynamic that also saw Texas utilities struggle during Harvey. Deanna Rodriguez, the chief executive officer of power provider Entergy New Orleans, declined to comment on when service would be restored, saying the company was using helicopters and drones to help assess the damage.

Michael Webber, an energy and engineering professor at the University of Texas at Austin, estimated power restoration will take days and possibly weeks, a pattern seen in Florida restoration timelines after major hurricanes, based on the initial damage reports from the storm. More than 25,000 workers from at least 32 states and Washington are mobilized to assist with power restoration efforts, similar to FPL's massive response after Irma, according to the Edison Electric Institute.

“The question is, how long will it take to rebuild these lines,” Webber said. The utilities will first need to complete their damage assessments before they can get a sense of repair timelines, a step that Gulf Power crews have highlighted in past recoveries, he said. “You can imagine that will take days at least, possibly weeks.”

The loss of electricity will have other affects as well, and even though grid resilience during the pandemic was strong, local systems face immediate constraints. Sewer substations, for example, need electricity to keep wastewater moving, said Ghassan Korban, executive director of the New Orleans Sewerage & Water Board. The storm knocked out power to about 80 of the city’s 84 pumping stations, he said at a Monday press conference. “Without electricity, wastewater backs up and can cause overflows,” he said, adding that residents should conserve water to lessen stress on the system.


Related News

View more

Nuclear plant workers cite lack of precautions around virus

Millstone COVID-19 safety concerns center on a nuclear refueling outage in Connecticut, temporary workers, OSHA complaints, PPE shortages, and disinfecting protocols, as Dominion Energy addresses virus precautions, staffing, and cybersecurity for safe voting infrastructure.


Key Points

Employee and union claims about PPE, cleaning, and OSHA compliance during a refueling outage at the nuclear plant.

✅ 10 positive cases; 750 temporary workers during refueling outage

✅ Union cites PPE gaps, partitions, and disinfectant effectiveness

✅ Dominion Energy notes increased cleaning, communication, staffing


Workers at Connecticut's only nuclear power plant worry that managers are not taking enough precautions against the coronavirus, as some utilities weigh on-site staffing measures to maintain operations, after 750 temporary employees were brought in to help refuel one of the two active reactors.

Ten employees at the Millstone Power Station in Waterford have tested positive for the virus, and, amid a U.S. grid pandemic warning, the arrival of the temporary workers alarms some of the permanent employees, The Day newspaper reported Sunday.

"Speaking specifically for the guard force, there's a lot of frustration, there's a lot of concern, and I would say there's anger," said Millstone security officer Jim Foley.

Foley, vice president of the local chapter of the United Government Security Officers of America, noted broader labor concerns such as unpaid wages for Kentucky miners while saying security personnel have had to fight for personal protective equipment and for partitions at access points to separate staff from security.

Foley also has filed a complaint with the Occupational Safety and Health Administration saying Millstone staff are using ineffective cleaning materials and citing a lack of cleaning and sanitizing, as telework limits at the EPA drew scrutiny during the pandemic, he said.

Officials at Millstone, owned by Dominion Energy, have not heard internal criticism about the plant's virus precautions, Millstone spokesman Kenneth Holt said.

"We've actually gotten a lot of compliments from employees on the steps we've taken," he said. "We've stepped up communications with employees to let them know what's going on."

As another example of communication efforts, COVID-19 updates at Site C have been published to keep workers informed.

Millstone recently increased cleaning staff on the weekends, Holt said, and there is regular disinfecting at the plant.

Separately, utility resilience remains a concern, as extended outages for tornado survivors in Kentucky may last weeks, affecting essential services.

Responding to the complaint about ineffective cleaning materials, Holt said staff members early in the pandemic went to a Home Depot and got a bottle of disinfectant that wasn't approved by the federal government as effective against the coronavirus. An approved disinfectant was brought in the next day, he said.

The deaths of nearly 2,500 Connecticut residents have been linked to COVID-19, the disease caused by the virus. More than 29,000 state residents have tested positive. As of Sunday, hospitalizations had declined for 11 consecutive days, to over 1,480.

With more people working remotely, utilities have reported higher residential electricity use during the pandemic, affecting household bills.

For most people, the coronavirus causes mild or moderate symptoms, such as fever and cough, that clear up in two to three weeks. For some, especially older adults and people with existing health problems, it can cause more severe illness, including pneumonia, and death.

In other developments related to the coronavirus:

SAFE VOTING

Secretary of the State Denise Merrill released a plan Monday aimed at making voting safe during the Aug. 11 primary and Nov. 3 general election.

Merrill said her office is requiring all cities and towns in the state to submit plans for the two elections that include a list of cleaning and safety products to be used, a list of polling locations, staffing levels at each polling location, and the names of polling workers and moderators.

Municipalities will be eligible for grants to cover the extra costs of holding elections during a pandemic, including expenses for cleaning products and increased staffing.

Merrill also announced her office and the Connecticut National Guard will perform a high-level cybersecurity assessment of the election infrastructure of all 169 towns in the state to guard against malicious actors.

Merrill's office also will provide network upgrades to the election infrastructures of 20 towns that have had chronic problems with connecting to the elections system.


Related News

View more

Idaho gets vast majority of electricity from renewables, almost half from hydropower

Idaho Renewable Energy 2018 saw over 80% in-state utility-scale power from hydropower, wind, solar, biomass, and geothermal, per EIA, with imports declining as Snake River Plain resources and Hells Canyon hydro lead.


Key Points

Idaho produced over 80% in-state power from renewables in 2018, led by hydropower, wind, solar, and biomass.

✅ Hydropower supplies about half of capacity; Hells Canyon leads.

✅ Wind provides nearly 20% of capacity along the Snake River Plain.

✅ Utility-scale solar surged since 2016; biomass and geothermal add output.


More than 80% of Idaho’s in-state utility-scale electricity generation came from renewable resources in 2018, behind only Vermont, according to recently released data from the U.S. Energy Information Administration’s Electric Power Monthly and broader trends showing that solar and wind reached about 10% of U.S. generation in the first half of 2018.

Idaho generated 17.4 million MWh of electricity in 2018, of which 14.2 million MWh came from renewable sources, while nationally January power generation jumped 9.3% year over year according to EIA. Idaho uses a variety of renewable resources to generate electricity:

Hydroelectricity. Idaho ranked seventh in the U.S. in electricity generation from hydropower in 2018. About half of Idaho’s electricity generating capacity is at hydroelectric power plants, and utility actions such as the Idaho Power settlement could influence future resource choices, and seven of the state’s 10 largest power plants (in terms of electricity generation) are hydroelectric facilities. The largest privately owned hydroelectric generating facility in the U.S. is a three-dam complex on the Snake River in Hells Canyon, the deepest river gorge in North America.

Wind. Nearly one-fifth of Idaho’s electricity generating capacity and one-sixth of its generation comes from wind turbines. Idaho has substantial wind energy potential, and nationally the EIA expects solar and wind to be larger sources this summer, although only a small percentage of the state's land area is well-suited for wind development. All of the state’s wind farms are located in the southern half of the state along the Snake River Plain.

Solar. Almost 5% of Idaho’s electricity generating capacity and 3% of its generation come from utility-scale solar facilities, and nationally over half of new capacity in 2023 will be solar according to projections. The state had no utility-scale solar generation as recently as 2015. Between 2016 and 2017, Idaho’s utility-scale capacity doubled and generation increased from 30,000 MWh to more than 450,000 MWh. Idaho’s small-scale solar capacity also doubled since 2017, generating 33,000 MWh in 2018.

Biomass. Biomass-fueled power plants account for about 2% of the state’s utility-scale electricity generating capacity and 3% of its generation, contributing to a broader U.S. shift where 40% of electricity came from non-fossil sources in 2021. Wood waste from the state’s forests is the primary fuel for these plants.

Geothermal. Idaho is one of seven states with utility-scale geothermal electricity generation. Idaho has one 18-MW geothermal facility, located near the state’s southern border with Utah.

EIA says Idaho requires significant electricity imports, totaling about one-third of demand, to meet its electricity needs. However, Idaho’s electricity imports have decreased over time, and Georgia's recent import levels illustrate how regional dynamics can vary. Almost all of these imports are from neighboring states, as electricity imports from Canada accounted for less than 0.1% of Idaho’s total electricity supply in 2017.


Related News

View more

New England's solar growth is creating tension over who pays for grid upgrades

New England Solar Interconnection Costs highlight distributed generation strains, transmission charges, distribution upgrades, and DAF fees as National Grid maps hosting capacity, driving queue delays and FERC disputes in Rhode Island and Massachusetts.


Key Points

Rising upfront grid upgrade and DAF charges for distributed solar in RI and MA, including some transmission costs.

✅ Upfront grid upgrades shifted to project developers

✅ DAF and transmission charges increase per MW costs

✅ Queue delays tied to hosting capacity and cluster studies


Solar developers in Rhode Island and Massachusetts say soaring charges to interconnect with the electric grid are threatening the viability of projects. 

As more large-scale solar projects line up for connections, developers are being charged upfront for the full cost of the infrastructure upgrades required, a long-common practice that they say is now becoming untenable amid debates over a new solar customer charge in Nova Scotia. 

“It is a huge issue that reflects an under-invested grid that is not ready for the volume of distributed generation that we’re seeing and that we need, particularly solar,” said Jeremy McDiarmid, vice president for policy and government affairs at the Northeast Clean Energy Council, a nonprofit business organization. 

Connecting solar and wind systems to the grid often requires upgrades to the distribution system to prevent problems, such as voltage fluctuations and reliability risks highlighted by Australian distributors in their networks. Costs can vary considerably from place to place, depending on the amount of distributed generation coming online and the level of capacity planning by regulators, said David Feldman, a senior financial analyst at the National Renewable Energy Laboratory.

“Certainly the Northeast often has more distribution challenges than much of the rest of the country just because it’s more populous and often the infrastructure is older,” he said. “But it’s not unique to the Northeast — in the Midwest, for example, there’s a significant amount of wind projects in the queues and significant delays.”

In Rhode Island and Massachusetts, where strong incentive programs are driving solar development, the level of solar coming online is “exposing the under-investment in the distribution system that is causing these massive costs that National Grid is assigning to particular projects or particular groups of projects,” McDiarmid said. “It is going to be a limiting factor for how much clean energy we can develop and bring online.”

Frank Epps, chief executive officer at Energy Development Partners, has been developing solar projects in Rhode Island since 2010. In that time, he said, interconnection charges on his projects have grown from about $80,000-$120,000 per megawatt to more than $400,000 per megawatt. He attributed the increase to a lack of investment in the distribution network by National Grid over the last decade.

He and other developers say the utility is now adding further to their costs by passing along not just the cost of improving the distribution system — the equivalent of the city street of the grid that brings power directly to customers — but also costs for modifying the transmission system — the interstate highway that moves bulk power over long distances to substations. 

Solar developers who are only requesting to hook into the distribution system, and not applying for transmission service, say they should not be charged for those additional upgrades under state interconnection rules unless they are properly authorized under the federal law that governs the transmission system. 

A Rhode Island solar and wind developer filed a complaint with the Federal Energy Regulatory Commission in February over transmission system improvement charges for its four proposed solar projects. Green Development said National Grid subsidiaries Narragansett Electric and New England Power Company want to charge the company more than $500,000 a year in operating and maintenance expenses assessed as so-called direct assignment facility charges. 

“This amount nearly doubles the interconnection costs associated with the projects,” which total 38.4 megawatts in North Smithfield, the company says in its complaint. “Crucially, these charges are linked to recovering costs associated with providing transmission service — even though no such transmission service is being provided to Green Development.”

But Ted Kresse, a spokesperson for National Grid, said the direct assignment facility, or DAF, construct has been in place for decades and has been applied to any customer affecting the need for transmission upgrades.

“It is the result of the high penetration and continued high volume of distributed generation interconnections that has recently prompted the need for transmission upgrades, and subsequently the pass-through of the associated DAF charges,” he said. 

Several complaints before the Rhode Island Public Utilities Commission object to these DAF and other transmission charges.

One petition for dispute resolution concerns four solar projects totaling 40 MW being developed by Energy Development Partners in a former gravel pit in North Kingstown. Brown University has agreed to purchase the power. 

The developer signed interconnection service agreements with Narragansett Electric in 2019 requiring payment of $21.6 million for costs associated with connecting the projects at a new Wickford Junction substation. Last summer, Narragansett sought to replace those agreements with new ones that reclassified a portion of the costs as transmission-level costs, through New England Power, National Grid’s transmission subsidiary.

That shift would result in additional operational and maintenance charges of $835,000 per year for the estimated 35-year life of the projects, the complaint says.

“This came as a complete shock to us,” Epps said. “We’re not just paying for the maintenance of a new substation. We are paying a share of the total cost that the system owner has to own and operate the transmission system. So all of the sudden, it makes it even tougher for distributed energy resources to be viable.”

In its response to the petition, National Grid argues that the charges are justified because the solar projects will require transmission-level upgrades at the new substation. The company argues that the developer should be responsible for the costs rather than ratepayers, “who are already supporting renewable energy development through their electric rates.”

Seth Handy, one of the lawyers representing Green Development in the FERC complaint, argues that putting transmission system costs on distribution assets is unfair because the distributed resources are “actually reducing the need to move electricity long distances. We’ve been fighting these fights a long time over the underestimating of the value of distributed energy in reducing system costs.”

Handy is also representing the Episcopal Diocese of Rhode Island before the state Supreme Court in its appeal of an April 2020 public utilities commission order upholding similar charges for a proposed 2.2-megawatt solar project at the diocese’s conference center and camp in Glocester. 

Todd Bianco, principal policy associate at the utilities commission, said neither he nor the chairperson can comment on the pending dockets contesting these charges. But he noted that some of these issues are under discussion in another docket examining National Grid’s standards for connecting distributed generation. Among the proposals being considered is the appointment of an independent ombudsperson to resolve interconnection disputes. 

Separately, legislation pending before the Rhode Island General Assembly would remove responsibility for administering the interconnection of renewable energy from utilities, and put it under the authority of the Rhode Island Infrastructure Bank, a financing agency.

Handy, who recently testified in support of the bill, said he believes National Grid has too many conflicting interests to administer interconnecting charges in a timely, transparent and fair fashion, and pointed to utility moves such as changes to solar compensation in other states as examples. In particular, he noted the company’s interests in expanding natural gas infrastructure. 

“There are all kinds of economic interests that they have that conflict with our state policy to provide lower-cost renewable energy and more secure energy solutions,” Handy said.

In testimony submitted to the House Committee on Corporations opposing the legislation, National Grid said such powers are well beyond the purpose and scope of the infrastructure bank. And it cited figures showing Rhode Island is third in the country for the most installed solar per square mile (behind New Jersey and Massachusetts).

Nadav Enbar, program manager at the Electric Power Research Institute, a nonprofit research organization for the utility industry, said interconnection delays and higher costs are becoming more common due to “the incredible uptake” in distributed renewable energy, particularly solar.

That’s impacting hosting capacity, the room available to connect all resources to a circuit without causing adverse harm to reliability and safety. 

“As hosting capacity is being reduced, it’s causing an increasing number of situations where utilities need to study their systems to guarantee interconnection without compromising their systems,” he said. “And that is the reason why you’re starting to see some delays, and it has translated into some greater costs because of the need for upgrades to infrastructure.”

The cost depends on the age or absence of infrastructure, projected load growth, the number of renewable energy projects in the queue, and other factors, he said. As utilities come under increasing pressure to meet state renewable goals, and as some states pilot incentives like a distributed energy rebate in Illinois to drive utility innovation, some (including National Grid) are beginning to provide hosting capacity maps that provide detailed information to developers and policymakers about the amount of distributed energy that can be accommodated at various locations on the grid, he said. 

In addition, the coming availability of high-tech “smart inverters” should help ease some of these problems because they provide the grid with more flexibility when it comes to connecting and communicating with distributed energy resources, Enbar said. 

In Massachusetts, the Department of Public Utilities has opened a docket to explore ways to better plan for and share the cost of upgrading distribution infrastructure to accommodate solar and other renewable energy sources as part of a grid overhaul for renewables nationwide. National Grid has been conducting “cluster studies” there that attempt to analyze the transmission impacts of a group of solar projects and the corresponding interconnection cost to each developer.

Kresse, of National Grid, said the company favors cost-sharing methodologies under consideration that would “provide a pathway to spread cost over the total enabled capacity from the upgrade, as opposed to spreading the cost over only those customers in the queue today.” 

Solar developers want regulators to take an even broader approach that factors in how the deployment of renewables and the resulting infrastructure upgrades benefit not just the interconnecting generator, but all customers. 

“Right now, if your project is the one that causes a multimillion-dollar upgrade, you are assigned that cost even though that upgrade is going to benefit a lot of other projects, as well as make the grid stronger,” said McDiarmid, of the clean energy council. “What we’re asking for is a way of allocating those costs among a variety of developers, as well as to the grid itself, meaning ratepayers. There’s a societal benefit to increasing the modernization of the grid, and improving the resilience of the grid.”

In the meantime, BlueHub Capital, a Boston-based solar developer focused on serving affordable housing developments, recently learned from National Grid that, as a part of one of the area studies, it will be required to pay $5.8 million in transmission and distribution upgrades to interconnect a 2-megawatt solar-plus-storage project that leverages cheaper batteries to enhance resilience, approved for a brownfield site in Gardner, Massachusetts. 

According to testimony submitted to the department, the sum is supposed to be paid within the next year, even though the project will have to wait to be interconnected until April 2027, when a new transmission line is completed. In addition, BlueHub will be responsible for DAF charges totaling $3.4 million over the 20-year life of the project. 

“We’re being asked to pay a fortune to provide solar that the state wants,” said DeWitt Jones, BlueHub’s president. “It’s so expensive that the upgrades are driving everyone out of the interconnection queue. The costs stay the same, but they fall on fewer projects. We need a process of grid design and modernization to guide this.”


Related News

View more

Amazon launches new clean energy projects in US, UK

Amazon Renewable Energy Projects advance net zero goals with a Scotland wind farm PPA and US solar farms in North Carolina and Virginia, delivering clean power, added capacity, and lower carbon emissions across cloud operations.


Key Points

Amazon initiatives adding wind and solar capacity in the UK and US to cut carbon and power cloud operations.

✅ Largest UK corporate wind PPA on Scotland Kintyre Peninsula

✅ Two US solar farms in North Carolina and Virginia

✅ 265 MW added capacity, 668,997 MWh clean power annually


Amazon is launching three renewable energy projects in the United States and the United Kingdom that support Amazon’s commitment to using net zero carbon energy by 2040.

The U.K. project is a wind farm on the Kintyre Peninsula in Scotland, aligned with a 10 GW renewables contract boosting the U.K. grid. It will generate 168,000 megawatt hours (MWh) of clean energy each year, enough to power 46,000 U.K. homes. It will be the largest corporate wind power purchase agreement (PPA) in the U.K.

Offshore wind energy in the UK is powering up rapidly, complementing onshore developments.

The other two are solar projects – one in Warren County, N.C, and the other in Prince George County, Va, reflecting broader US solar and wind growth trends nationwide. Together, they are expected to generate 500,997 MWh of energy annually. It is Amazon’s second renewable energy project in North Carolina, following the Amazon Wind Farm US East operated by Avangrid Renewables, and eighth in Virginia.

The three new Amazon wind and solar projects – which are expected to be in operation in 2012 — will provide 265 MW of additional renewable capacity, and align with U.K. wind power lessons for the U.S. market nationwide.

“In addition to the environmental benefits inherently associated with running applications in the cloud, Amazon is committed to minimizing our carbon emissions and reaching 80% renewable energy use across the company by 2024. We’ve announced eight projects this year and have more projects on the horizon – and we’re committed to investing in renewable energy as a critical step toward addressing our carbon footprint globally,” Kara Hurst, director of sustainability at Amazon, said. “With nearly 70 renewable energy projects around the globe – including 54 solar rooftops – we are making significant progress towards reaching Amazon’s company-wide commitment to reach 100% renewable energy by 2030.”

Amazon has launched 18 utility-scale wind and solar renewable energy projects to date, and in parallel, Duke Energy Renewables has acquired three California solar projects, underscoring sector momentum. They will generate over 1,600 MW of renewable capacity and deliver more than 4.6 million MWh of clean energy annually. Amazon has also installed more than 50 solar rooftops on fulfillment centers and sort centers around the world. They generate 98 MW of renewable capacity and deliver 130,000 MWh of clean energy annually.

“Today’s announcement by Amazon is another important step for North Carolina’s clean energy plan that will increase our reliance on renewables and reduce our greenhouse gas emissions,” North Carolina Governor Roy Cooper said. “Not only is this the right thing to do for our planet, it’s the right thing to do for our economy. More clean energy jobs means better jobs for North Carolina families.”

Amazon reports on its sustainability commitments, initiatives, and performance on a new web site the company recently launched. It includes information on Amazon’s carbon footprint and other metrics and updates the company’s progress towards reaching The Climate Pledge. 

“It’s wonderful to see the announcement of these new projects, helping bring more clean energy to the Commonwealth of Virginia where Amazon is already recognized as a leader in bringing renewable energy projects online,” Virginia Governor Ralph Northam said. “These solar farms help reaffirm the Commonwealth’s role as a leading producer of clean energy in the U.S., helping take the nation forward in responding to climate change.”


Related News

View more

Solar PV and wind power in the US continue to grow amid favourable government plans

US Renewable Power Outlook 2030 projects surging capacity, solar PV and wind growth, grid modernization, and favorable tax credits, detailing market trends, CAGR, transmission expansion, and policy drivers shaping clean energy generation and consumption.


Key Points

A forecast of US power capacity, generation, and consumption, highlighting solar, wind, tax credits, and grid modernization.

✅ Targets 48.4% renewable capacity share by 2030

✅ Strong growth in solar PV and onshore wind installations

✅ Investment and tax credits drive grid and transmission upgrades


GlobalData’s latest report, ‘United States Power Market Outlook to 2030, Update 2021 – Market Trends, Regulations, and Competitive Landscape’ discusses the power market structure of the United States and provides historical and forecast numbers for capacity, generation and consumption up to 2030. Detailed analysis of the country’s power market regulatory structure, competitive landscape and a list of major power plants are provided. The report also gives a snapshot of the power sector in the country on broad parameters of macroeconomics, supply security, generation infrastructure, transmission and distribution infrastructure, about a quarter of U.S. electricity from renewables in recent years, electricity import and export scenario, degree of competition, regulatory scenario, and future potential. An analysis of the deals in the country’s power sector is also included in the report.

Renewable power held a 19% share of the US’s total power capacity in 2020, and in that year renewables became the second-most prevalent source in the U.S. electricity mix by generation; this share is expected to increase significantly to 48.4% by 2030. Favourable policies introduced by the US Government will continue to drive the country’s renewable sector, particularly solar photovoltaics (PV) and wind power, with wind now the most-used renewable source in the U.S. generation mix. Installed renewable capacity* increased from 16.5GW in 2000 to 239.2GW in 2020, growing at a compound annual growth rate (CAGR) of 14.3%. By 2030, the cumulative renewable capacity is expected to rise to 884.6GW, growing at a CAGR of 14% from 2020 to 2030. Despite increase in prices of renewable equipment, such as solar modules, in 2021, the US renewable sector will show strong growth during the 2021 to 2030 period as this increase in equipment prices are short term due to supply chain disruptions caused by the Covid-19 pandemic.

The expansion of renewable power capacity during the 2000 to 2020 period has been possible due to the introduction of federal schemes, such as Production Tax Credits, Investment Tax Credits and Manufacturing Tax Credits. These have massively aided renewable installations by bringing down the cost of renewable power generation and making it at par with power generated from conventional sources. Over the last few years, the cost of solar PV and wind power installations has declined sharply, and by 2023 wind, solar, and batteries made up most of the utility-scale pipeline across the US, highlighting investor confidence. Since 2010, the cost of utility-scale solar PV projects decreased by around 82% while onshore wind installations decreased by around 39%. This has supported the rapid expansion of the renewable market. However, the price of solar equipment has risen due to an increase in raw material prices and supply shortages. This may slightly delay the financing of some solar projects that are already in the pipeline.

The US will continue to add significant renewable capacity additions during the forecast period as industry outlooks point to record solar and storage installations over the coming years, to meet its target of reaching 80% clean energy by 2030. In November 2021, President Biden signed a $1tr Infrastructure Bill, within which $73bn is designated to renewables. This includes not just renewable capacity building, but also strengthening the country’s power grid and laying new high voltage transmission lines, both of which will be key to driving solar and wind power capacity additions as wind power surges in the U.S. electricity mix nationwide.

The US was one of the worst hit countries in the world due to the Covid-19 pandemic in 2020. With respect to the power sector, the electricity consumption in the country declined by 2.5% in 2020 as compared to 2019, even as renewable electricity surpassed coal in 2022 in the generation mix, highlighting continued structural change. Power plants that were under construction faced delays due to unavailability of components due to supply chain disruptions and unavailability of labour due to travel restrictions.

According to the US Energy Information Administration, 61 power projects, having a total capacity of 2.4GWm which were under construction during March and April 2020 were delayed because of the Covid-19 pandemic. Among renewable power technologies, solar PV and wind power projects were the most badly affected due to the pandemic.

In March and April 2020, 53 solar PV projects, having a total capacity of 1.3GW, and wind power projects, having a total capacity of 1.2GW, were delayed due to the Covid-19 pandemic. Moreover, several states suspended renewable energy auctions due to the pandemic.

For instance, New York State Energy Research and Development Authority (NYSERDA) had issued a new offshore wind solicitation for 1GW and up to 2.5GW in April 2020, but this was suspended due to the Covid-19 pandemic. In July 2020, the authority relaunched the tender for 2.5GW of offshore wind capacity, with a submission deadline in October 2020.

To ease the financial burden on consumers during the pandemic, more than 1,000 utilities in the country announced disconnection moratoria and implemented flexible payment plans. Duke Energy, American Electric Power, Dominion Power and Southern California Edison were among the major utilities that voluntarily suspended disconnections.


Related News

View more

Sign Up for Electricity Forum’s Newsletter

Stay informed with our FREE Newsletter — get the latest news, breakthrough technologies, and expert insights, delivered straight to your inbox.

Electricity Today T&D Magazine Subscribe for FREE

Stay informed with the latest T&D policies and technologies.
  • Timely insights from industry experts
  • Practical solutions T&D engineers
  • Free access to every issue

Live Online & In-person Group Training

Advantages To Instructor-Led Training – Instructor-Led Course, Customized Training, Multiple Locations, Economical, CEU Credits, Course Discounts.

Request For Quotation

Whether you would prefer Live Online or In-Person instruction, our electrical training courses can be tailored to meet your company's specific requirements and delivered to your employees in one location or at various locations.