PGEÂ’s Biglow Canyon Wind Farm expanding daily

By Business Wire


CSA Z463 Electrical Maintenance

Our customized live online or in‑person group training can be delivered to your staff at your location.

  • Live Online
  • 6 hours Instructor-led
  • Group Training Available
Regular Price:
$249
Coupon Price:
$199
Reserve Your Seat Today
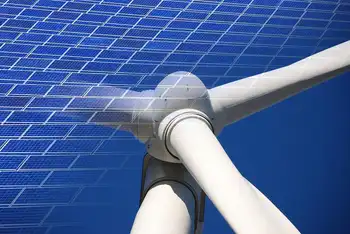
Portland General Electric Company (PGE) announced that the first turbines erected for phase two of its Biglow Canyon Wind Farm have begun generating electricity and supplying power on the Pacific NorthwestÂ’s electricity grid.

“This major capital investment is moving forward on time and on budget,” said Jim Piro, PGE president and CEO. “Our customers place a high priority on renewable power, and Biglow Canyon is an important step toward helping PGE meet Oregon’s Renewable Energy Standard.”

Phase one of Biglow Canyon was completed in 2007, with 76 turbines and an installed capacity of 125 megawatts of electricity. Trucks laden with wind-turbine parts for this second phase began rolling into Biglow in mid-April. A total of 65 new turbines are scheduled for completion this spring and summer — with about 10 truckloads of parts delivered per wind turbine. Twelve turbines are currently generating power.

Each of the new turbines will be capable of generating up to 2.3 megawatts, bringing Biglow CanyonÂ’s combined installed capacity to nearly 275 megawatts by the end of 2009. A third phase with another 76 turbines is slated for commercial operation in 2010, which will bring the wind farm to a combined installed capacity of 450 megawatts.

Given the variability of wind power, the plant is expected to produce an average of around 150 megawatts – enough to power the homes of about 125,000 average PGE residential customers.

The Biglow Canyon Wind Farm is located near Wasco in Sherman County, Ore. It is PGEÂ’s newest renewable energy project. When complete, it is expected to be one of the largest wind power facilities in the Pacific Northwest. In addition to providing carbon-free and emissions-free generation of electric power, the wind farm is also creating jobs, providing income for local businesses, generating tax revenues for local government, and providing easement payments to landowners.

The Biglow Canyon project was developed by Orion Energy LLC. It is being built by PGE, which will also own and operate it.

Related News

Wind has become the ‘most-used’ source of renewable electricity generation in the US

U.S. Wind Generation surpassed hydroelectric output in 2019, EIA data shows, becoming the top renewable electricity source, driven by PTC incentives, expanded capacity, and utility-scale projects across states, boosting the national electricity mix.


Key Points

U.S. Wind Generation is the nation's top renewable, surpassing hydro as EIA-tracked capacity grows under PTC incentives.

✅ EIA: wind topped hydro in 2019, over 300M MWh generated

✅ PTC credits spurred growth in utility-scale wind projects

✅ 103 GW installed; 77% added in the last decade


Last year saw wind power surging in the U.S. to overtake hydroelectric generation for the first time, according to data from the U.S. Energy Information Administration (EIA).

Released Wednesday, the figures from the EIA’s “Electric Power Monthly” report show that yearly wind generation hit a little over 300 million megawatt hours (MWh) in 2019. This was roughly 26 million MWh more than hydroelectric production.

Wind now represents the “most-used renewable electricity generation source” in the U.S., the EIA said, and renewables hit a 28% monthly record in April in later data.

Overall, total renewable electricity generation — which includes sources such as solar's 4.7% share in 2022 as one example, geothermal and landfill gas — at utility scale facilities hit more than 720 million MWh in 2019, compared to just under 707 million MWh in 2018. To put things in perspective, generation from coal came to more than 966 million MWh in 2019, while renewables surpassed coal in 2022 nationally according to later analyses.

According to the EIA’s “Today in Energy” briefing, which was also published Wednesday, generation from wind power has grown “steadily” across the last decade, and by 2020, renewables became the second-most prevalent source in the U.S. power mix.

This, it added, was partly down to the extension of the Production Tax Credit, or PTC, amid favorable government plans supporting solar and wind growth. According to the EIA, the PTC is a system which gives operators a tax credit per kilowatt hour of renewable electricity production. It applies for the first 10 years of a facility’s operation.

At the end of 2019, the country was home to 103 gigawatts (GW) of wind capacity, with 77% of this being installed in the last decade, and wind capacity surpassed hydro in 2016 according to industry data. The U.S. is home 80 GW of hydroelectric capacity, according to the EIA.

“The past decade saw a steady increase in wind capacity across the country and we capped the decade with a monumental achievement for the industry in reaching more than 100 GW,” Tom Kiernan, the American Wind Energy Association’s CEO, said in a statement issued Thursday.

“And more wind energy is coming, as the industry is well into investing $62 billion in new projects over the next few years that put us on the path to achieving 20 percent of the nation’s electricity mix in 2030,” Kiernan went on to state.

“As a result, wind is positioned to remain the largest renewable energy generator in the country for the foreseeable future.”


Related News

View more

Research shows that Ontario electricity customers want more choice and flexibility

Hydro One Account Customization lets Ontario customers pick billing due dates, enable balanced billing, get early high usage notifications, monitor electricity consumption, and receive outage alerts, offering flexibility during COVID-19.


Key Points

A flexible toolkit to set due dates, balance bills, get usage alerts, and track electricity.

✅ Pick your billing due date for better cash flow

✅ Balanced billing smooths seasonal usage spikes

✅ Early high usage and outage alerts via text or email


Hydro One announced it is providing its customers with the flexibility to customize their account. Customers can choose their own billing due date, flatten usage spikes from temperature fluctuations through balanced billing and the Ultra-Low Overnight Price Plan, and monitor their electricity consumption by signing up for early high usage notifications.

Research shows that Ontario electricity customers want more choice and flexibility (CNW Group/Hydro One Inc.)
"Being in-tune with our customers' needs is more important than ever. As we continue to navigate the COVID-19 pandemic, customers tell us that choice and flexibility, alongside electricity relief, will help them during this difficult time," said Jason Fitzsimmons, Chief Corporate Affairs and Customer Care Officer, Hydro One. "As a customer-driven organization, we have an important responsibility to support customers with relief, flexibility and choice."

According to recent research conducted by Angus Reid, 78 per cent of Ontario electricity customers said balanced billing would help them better manage their finances, even as peak hydro rates remained unchanged for many self-isolating customers. Balanced billing flattens out the spikes in electricity usage that commonly occurs in the summer due to air conditioning use and in the winter due to heating.

The research also found that 72 per cent of customers would like to pick their own due date to better manage their finances. This feature is now included in Hydro One's new customization bundle, which will be shared with customers through an awareness campaign. Other customization tools include alerts when electricity usage falls outside of the customer's normal pattern, the ability to report outages online and the ability to receive text messages or emails when outages occur. Customers can visit www.HydroOne.com/Choice to learn more.

"Customers can pick and choose the tools that work best for them. We are now able to offer a suite of features built for any lifestyle as our employees support Ontario's COVID-19 response across the province," said Fitzsimmons.

In addition to these customization options, Hydro One has also developed a number of customer support measures during COVID-19, including a Pandemic Relief Fund to offer payment flexibility and financial assistance to customers. The company is also extending its ban on electricity disconnections to ensure that no customer is disconnected at a time when support is needed most. More information about Hydro One's Pandemic Relief Program can be found at www.HydroOne.com/PandemicRelief. Customers can continue to contact Hydro One to determine individual payment plans and determine financial assistance programs available to meet their needs, especially as disconnection pressures can arise for some households.


Related News

View more

U.S. Electricity and natural gas prices explained

Energy Pricing Factors span electricity generation, transmission, and distribution costs, plus natural gas supply-demand, renewables, seasonal peaks, and wholesale pricing effects across residential, commercial, and industrial customers, usage patterns, weather, and grid constraints.


Key Points

They are the costs and market forces driving electricity and natural gas prices, from generation to delivery and demand.

✅ Generation, transmission, distribution shape electricity rates

✅ Gas prices hinge on supply, storage, imports/exports

✅ Demand shifts: weather, economy, and fuel alternatives


There are a lot of factors that affect energy prices globally. What’s included in the price to heat homes and supply them with electricity may be a lot more than some people may think.

Electricity
Generating electricity is the largest component of its price, according to the U.S. Energy Information Administration (EIA). Generation accounts for 56% of the price of electricity, while distribution and transmission account for 31% and 13% respectively.

Homeowners and businesses pay more for electricity than industrial companies, and U.S. electricity prices have recently surged, highlighting broader inflationary pressures. This is because industrial companies can take electricity at higher voltages, reducing transmission costs for energy companies.

“Industrial consumers use more electricity and can receive it at higher voltages, so supplying electricity to these customers is more efficient and less expensive. The price of electricity to industrial customers is generally close to the wholesale price of electricity,” EIA explains.

NYSEG said based on the average use of 600 kilowatt-hours per month, its customers spent the most money on delivery and transition charges in 2020, 57% or about $42, and residential electricity bills increased 5% in 2022 after inflation, according to national data. They also spent on average 35% (~$26) on supply charges and 8% (~$6) on surcharges.

Electricity prices are usually higher in the summer. Why? Because energy companies use sources of electricity that cost more money. It used to be that renewable sources, like solar and wind, were the most expensive sources of energy but increased technological advances have changed this, according to the International Energy Agency’s 2021 World Energy Outlook.

“In most markets, solar PV or wind now represents the cheapest available source of new electricity generation. Clean energy technology is becoming a major new area for investment and employment – and a dynamic arena for international collaboration and competition,” the report said.

Natural gas
The price of natural gas is driven by supply and demand. If there is more supply, prices are generally lower. If there is not as much supply, prices are generally higher the EIA explains. On the other side of the equation, more demand can also increase the price and less demand can decrease the price.

High natural gas prices mean people turn their home thermostats down a few degrees to save money, so the EIA said reduced demand can encourage companies to produce more natural gas, which would in turn help lower the cost. Lower prices will sometimes cause companies to reduce their production, therefore causing the price to rise.

The three major supply factors that affect prices: the amount of natural gas produced, how much is stored, and the volume of gas imported and exported. The three major demand factors that affect price are: changes in winter/summer weather, economic growth, and the broader energy crisis dynamics, as well as how much other fuels are available and their price, said EIA.

To think the price of natural gas is higher when the economy is thriving may sound counterintuitive but that’s exactly what happens. The EIA said this is because of increases in demand.


Related News

View more

BC Hydro cryptic about crypto mining electricity use

BC Hydro Crypto Mining Moratorium pauses high-load connection requests, as BCUC reviews electricity demand, gigawatt-hours and megawatt load forecasts, data center growth, and potential rate impacts on the power grid and industrial customers.


Key Points

A BC order pausing crypto mining connections while BC Hydro and BCUC assess load, grid impacts, and ratepayer risks.

✅ 18-month pause on new high-load crypto connections

✅ 1,403 MW in requests suspended; 273 MW existing or pending

✅ Seeks to manage demand, rates, and grid reliability


In its Nov. 1, 2022 load update briefing note to senior executives of the Crown corporation, BC Hydro shows that the entire large industrial sector accounted for 6,591 gigawatt-hours during the period – one percent less than forecast in the service plan.

BC Hydro censored load statistics about crypto mining, coal mining and chemicals from the briefing note, which was obtained under the freedom of information law and came amid scrutiny over B.C. electricity imports because it feared that disclosure would harm Crown corporation finances and third-party business interests.

Crypto mining requires high-powered computers to run and be cooled around the clock constantly. So much so that cabinet ordered the BC Utilities Commission (BCUC) last December to place an 18-month moratorium on crypto mining connection requests, while other jurisdictions, such as the N.B. Power crypto review, undertook similar pauses to assess impacts.


In a news release, the government said 21 projects seeking 1,403 megawatts were temporarily suspended. The government said that would be enough to power 570,000 homes or 2.1 million electric vehicles for a year.

A report issued by BC Hydro before Christmas said there were already 166 megawatts of power from operational projects at seven sites. Another six projects with 107 megawatts were nearing connection, bringing its total load to 273 megawatts.

Richard McCandless, a retired assistant deputy minister who analyzes the performance of BC Hydro and the Insurance Corp of British Columbia, said China's May 2021 ban on crypto mining had a major ripple effect on those seeking cheap and reliable power.

"When China cracked down, these guys fled to different areas," McCandless said in an interview. "So they took their computers and went somewhere else. Some wound up in B.C."

He said BC Hydro's secrecy about crypto loads appears rooted in the Crown corporation underestimating load demand, even as new generating stations were commissioned to bolster capacity.

"Crypto is up so dramatically; they didn't want to show that," McCandless said. "Maybe they didn't want to be seen as being asleep at the switch."

Indeed, BCUC's April 21 decision on BC Hydro's 2021 revenue forecasts through the 2025 fiscal year included BC Hydro's forecast increase for crypto and data centres of about 100 gigawatt-hours through fiscal 2024 before returning to 2021 levels by 2025. In addition, the BCUC document said that BC Hydro's December 2020 load forecast was lower than the previous one because of project cancellations and updated load requests, amid ongoing nuclear power debate in B.C.

"Given the segment's continued uncertainty and volatility, the forecast assumes these facilities are not long-lived," the BC Hydro application said.

A September 2022 report to the White House titled "Crypto-Assets in the United States" said increased electricity demand from crypto-asset mining could lead to rate increases.

"Crypto-asset mining in upstate New York increased annual household electric bills by [US]$82 and annual small business electric bills by [US]$164, with total net losses from local consumers and businesses estimated to be [US]$179 million from 2016-2018," the report said. The information mentioned Plattsburgh, New York's 18-month moratorium in 2018. Manitoba announced a similar suspension almost a month before B.C.

B.C.'s total core domestic load of 23,666 gigawatt-hours was two percent higher than the service plan amid BC Hydro call for power planning, with commercial and light industrial (9,198 gigawatt-hours) and residential (7,877 gigawatt-hours) being the top two customer segments.

"A cooler spring and warmer summer supported increased loads, as the Western Canada drought strained hydropower production regionally. However, warmer daytime temperatures in September impacted heating more than cooling," said the briefing note.

"Commercial and light industrial consumption benefited from warmer temperatures in August but has also been impacted to a lesser degree by the reduced heating load in the first three weeks of October."

Loads improved relative to 2021, but offices, retail businesses and restaurants remained below pre-pandemic levels. Education, recreation and hotel sectors were in line with pre-pandemic levels. Light industrial sector growth offset the declines.

For heavy industry, pulp and paper electricity use was 15 percent ahead of forecast, but wood manufacturing was 16 percent below forecast. The briefing note said oil and gas grew nine percent relative to the previous year but, alongside ongoing LNG power demand, fell nine percent below the service plan.


Related News

View more

IEA: Electricity investment surpasses oil and gas for the first time

Electricity Investment Surpasses Oil and Gas 2016, driven by renewable energy, power grids, and energy efficiency, as IEA reports lower oil and gas spending, rising solar and wind capacity, and declining coal power plant approvals.


Key Points

A 2016 milestone where electricity topped global energy investment, led by renewables, grids, and efficiency, per the IEA.

✅ IEA: electricity investment hit $718b; oil and gas fell to $650b.

✅ Renewables led with $297b; solar and wind unit costs declined.

✅ Coal plant approvals plunged; networks and storage spending rose.


Investments in electricity surpassed those in oil and gas for the first time ever in 2016 on a spending splurge on renewable energy and power grids as the fall in crude prices led to deep cuts, the International Energy Agency (IEA) said.

Total energy investment fell for the second straight year by 12 per cent to US$1.7 trillion compared with 2015, the IEA said. Oil and gas investments plunged 26 per cent to US$650 billion, down by over a quarter in 2016, and electricity generation slipped 5 per cent.

"This decline (in energy investment) is attributed to two reasons," IEA chief economist Laszlo Varro told journalists.

"The reaction of the oil and gas industry to the prolonged period of low oil prices which was a period of harsh investment cuts; and technological progress which is reducing investment costs in both renewable power and in oil and gas," he said.

Oil and gas investment is expected to rebound modestly by 3 per cent in 2017, driven by a 53 per cent upswing in U.S. shale, and spending in Russia and the Middle East, the IEA said in a report.

"The rapid ramp up of U.S. shale activities has triggered an increase of U.S. shale costs of 16 per cent in 2017 after having almost halved from 2014-16," the report said.

The global electricity sector, however, was the largest recipient of energy investment in 2016 for the first time ever, overtaking oil, gas and coal combined, the report said.

"Robust investments in renewable energy and increased spending in electricity networks, which supports the outlook that low-emissions sources will cover most demand growth, made electricity the biggest area of capital investments," Varro said.

Electricity investment worldwide was US$718 billion, lifted by higher spending in power grids which offset the fall in power generation investments.

"Investment in new renewables-based power capacity, at US$297 billion, remained the largest area of electricity spending, despite falling back by 3 per cent as clean energy investment in developing nations slipped, the report said."

Although renewables investments was 3 per cent lower than five years ago, capacity additions were 50 per cent higher and expected output from this capacity about 35 per cent higher, thanks to the fall in unit costs and technology improvements in solar PV and wind generation, the IEA said.


COAL INVESTMENT IS COMING TO AN END

Investments in coal-fired electricity plants fell sharply. Sanctioning of new coal power plants fell to the lowest level in nearly 15 years, reflecting concerns about local air pollution, and emergence of overcapacity and competition from renewables, with renewables poised to eclipse coal in global power generation, notably in China. Coal investments, however, grew in India.

"Coal investment is coming to an end. At the very least, it is coming to a pause," Varro said.

The IEA report said energy efficiency investments continued to expand in 2016, reaching US$231 billion, with most of it going to the building sector globally.

Electric vehicles sales rose 38 per cent in 2016 to 750,000 vehicles at $6 billion, and represented 10 per cent of all transport efficiency spending. Some US$6 billion was spent globally on electronic vehicle charging stations, the IEA said.

Spending on electricity networks and storage continued the steady rise of the past five years, as surging electricity demand puts power systems under strain, reaching an all-time high of US$277 billion in 2016, with 30 per cent of the expansion driven by China’s spending in its distribution system, the report said.

China led the world in energy investments with 21 per cent of global total share, the report said, driven by low-carbon electricity supply and networks projects.

Although oil and gas investments fell in the United States in 2016, its total energy investments rose 16 per cent, even as Americans use less electricity in recent years, on the back of spending in renewables projects, the IEA report said.


Related News

View more

Indian government takes steps to get nuclear back on track

India Nuclear Generation Shortfall highlights missed five-year plan targets due to uranium fuel scarcity, commissioning delays at Kudankulam, PFBR slippage, and PHWR equipment bottlenecks under IAEA safeguards and domestic supply constraints.


Key Points

A gap between planned and actual nuclear output due to fuel shortages, reactor delays, and first-of-a-kind hurdles.

✅ Fuel scarcity pre-2009-10 constrained unsafeguarded reactors.

✅ Kudankulam delays from protests, litigation, and remobilisation.

✅ FOAK PHWR equipment bottlenecks and PFBR slippage.


A lack of available domestically produced nuclear fuel and delays in constructing and commissioning nuclear power plants, including first-of-a-kind plants and the Prototype Fast Breeder Reactor (PFBR), meant that India failed to meet its nuclear generation targets under the governmental plans over the decade to 2017, even as global project milestones were being recorded elsewhere.

India's nuclear generation target under its 11th five-year plan, covering the period 2007-2012, was 163,395 million units (MUs) and the 12th five-year Plan (2012-17) was 241,748 MUs, Minister of state for the Department of Atomic Energy and the Prime Minister's Office Jitendra Singh told parliament on 6 February. Actual nuclear generation in those periods was 109,642 MUs and 183,488 MUs respectively, Singh said in a written answer to questions in the Lok Sabah.

Singh attributed the shortfall in generation to a lack of availability of the necessary quantities of domestically produced fuel during the three years before 2009-2010; delays to the commissioning of two 1000 MWe nuclear power plants at Kudankulam due to local protests and legal challenges; and delays in the completion of two indigenously designed pressurised heavy water reactors and the PFBR.

Kudankulam 1 and 2 are VVER-1000 pressurised water reactors (PWRs) supplied by Russia's Atomstroyexport under a Russian-financed contract. The units were built by Nuclear Power Corporation of India Ltd (NPCIL) and were commissioned and are operated by NPCIL under International Atomic Energy Agency (IAEA) safeguards, with supervision from Russian specialists, while China's nuclear program advanced on a steady development track in the same period. Construction of the units - the first PWRs to enter operation in India - began in 2002.

Singh said local protests resulted in the halt of commissioning work at Kudankulam for nine months from September 2011 to March 2012, when he said project commissioning had been at its peak. As a consequence, additional time was needed to remobilise the workforce and contractors, he said. Litigation by anti-nuclear groups, and compliance with supreme court directives, impacted commissioning in 2013, he said. Unit 1 entered commercial operation in December 2014 and unit 2 in April 2017.

Delays in the manufacture and supply by domestic industry of critical equipment for first-of-a-kind 700 MWe pressurised heavy water reactors -  Kakrapar units 3 and 4, and Rajasthan units 7 and 8 - has led to delays in the completion of those units, the minister said, as well as noting the delay in completion of the PFBR, which is being built at Kalpakkam by Bhavini. In answer to a separate question, Singh said the PFBR is in an "advance stage of integrated commissioning" and is "expected to approach first criticality by the year 2020."

Eight of India's operating nuclear power plants are not under IAEA safeguards and can therefore only use indigenously-sourced uranium. The other 14 units operate under IAEA safeguards and can use imported uranium. The Indian government has taken several measures to secure fuel supplies for reactors in operation and under construction, amid coal supply rationing pressures elsewhere in the power sector, concluding fuel supply contracts with several countries for existing and future reactors under IAEA Safeguards and by "augmentation" of fuel supplies from domestic sources, Singh said.

Kakrapar 3 and 4, with Kakrapar 3 criticality already reported, and Rajasthan 7 and 8 are all currently expected to enter service in 2022, according to World Nuclear Association information.


Joint venture discussions

In February 2016 the government amended the Atomic Energy Act to allow NPCIL to form joint venture companies with other public sector undertakings (PSUs) for involvement in nuclear power generation and possibly other aspects of the fuel cycle, reflecting green industrial strategies shaping future reactor waves globally. In answer to another question, Singh confirmed that NPCIL has entered into joint ventures with NTPC Limited (National Thermal Power Corporation, India's largest power company) and Indian Oil Corporation Limited. Two joint venture companies - Anushakti Vidhyut Nigam Limited and NPCIL-Indian Oil Nuclear Energy Corporation Limited - have been incorporated, and discussions on possible projects to be set up by the joint venture companies are in progress.

An exploratory discussion had also been held with Oil & Natural Gas Corporation, Singh said. Indian Railways - which has in the past been identified as a potential joint venture partner for NPCIL - had "conveyed that they were not contemplating entering into an MoU for setting up of nuclear power plants," Singh said.


Related News

View more

Sign Up for Electricity Forum’s Newsletter

Stay informed with our FREE Newsletter — get the latest news, breakthrough technologies, and expert insights, delivered straight to your inbox.

Electricity Today T&D Magazine Subscribe for FREE

Stay informed with the latest T&D policies and technologies.
  • Timely insights from industry experts
  • Practical solutions T&D engineers
  • Free access to every issue

Download the 2025 Electrical Training Catalog

Explore 50+ live, expert-led electrical training courses –

  • Interactive
  • Flexible
  • CEU-cerified