PG&E Wind Shutdown and Renewable Reliability examines PSPS strategy, wildfire risk, transmission line exposure, wind turbine cut-out speeds, grid stability, and California's energy mix amid historic high-wind events and supply constraints across service areas.
Key Points
An overview of PG&E's PSPS decisions, wildfire mitigation, and how wind cut-out limits influence grid reliability.
✅ Wind turbines reach cut-out near 55 mph, reducing generation.
✅ PSPS mitigates ignition from damaged transmission infrastructure.
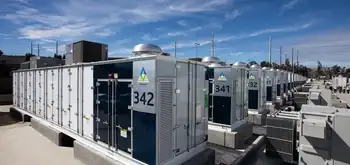
✅ Baseload diversity improves resilience during high-wind events.
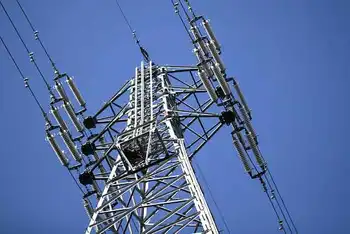
According to the official, widely reported story, Pacific Gas & Electric (PG&E) initiated power shutoffs across substantial portions of its electric transmission system in northern California as a precautionary measure.
Citing high wind speeds they described as “historic,” the utility claims that if it didn’t turn off the grid, wind-caused damage to its infrastructure could start more wildfires.
Perhaps that’s true. Perhaps. This tale presumes that the folks who designed and maintain PG&E’s transmission system are unaware of or ignored the need to design it to withstand severe weather events, and that the Federal Energy Regulatory Commission (FERC) and North American Electric Reliability Corp. (NERC) allowed the utility to do so.
Ignorance and incompetence happens, to be sure, but there’s much about this story that doesn’t smell right—and it’s disappointing that most journalists and elected officials are apparently accepting it without question.
Take, for example, this statement from a Fox News story about the Kincade Fires: “A PG&E meteorologist said it’s ‘likely that many trees will fall, branches will break,’ which could damage utility infrastructure and start a fire.”
Did you ever notice how utilities cut wide swaths of trees away when transmission lines pass through forests? There’s a reason for that: When trees fall and branches break, the grid can still function, and even as the electric rhythms of New York City shifted during COVID-19, operators planned for variability.
So, if badly designed and poorly maintained infrastructure isn’t the reason PG&E cut power to millions of Californians, what might have prompted them to do so? Could it be that PG&E’s heavy reliance on renewable energy means they don’t have the power to send when a “historic” weather event occurs, especially as policymakers weigh the postponed closure of three power plants elsewhere in California?
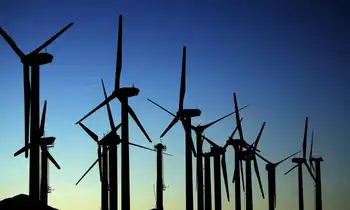
Wind Speed Limits
The two most popular forms of renewable energy come with operating limitations, which is why some energy leaders urge us to keep electricity options open when planning the grid. With solar power, the constraint is obvious: the availability of sunlight. One doesn’t generate solar power at night and energy generation drops off with increasing degrees of cloud cover during the day.
The main operating constraint of wind power is, of course, wind speed, and even in markets undergoing 'transformative change' in wind generation, operators adhere to these technical limits. At the low end of the scale, you need about a 6 or 7 miles-per-hour wind to get a turbine moving. This is called the “cut-in speed.” To generate maximum power, about a 30 mph wind is typically required. But, if the wind speed is too high, the wind turbine will shut down. This is called the “cut-out speed,” and it’s about 55 miles per hour for most modern wind turbines.
It may seem odd that wind turbines have a cut-out speed, but there’s a very good reason for it. Each wind turbine rotor is connected to an electric generator housed in the turbine nacelle. The connection is made through a gearbox that is sized to turn the generator at the precise speed required to produce 60 Hertz AC power.
The blades of the wind turbine are airfoils, just like the wings of an airplane. Adjusting the pitch (angle) of the blades allows the rotor to maintain constant speed, which, in turn, allows the generator to maintain the constant speed it needs to safely deliver power to the grid. However, there’s a limit to blade pitch adjustment. When the wind is blowing so hard that pitch adjustment is no longer possible, the turbine shuts down. That’s the cut-out speed.
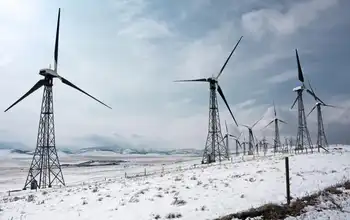
Now consider how California’s power generation profile has changed. According to Energy Information Administration data, the state generated 74.3 percent of its electricity from traditional sources—fossil fuels and nuclear, amid debates over whether to classify nuclear as renewable—in 2001. Hydroelectric, geothermal, and biomass-generated power accounted for most of the remaining 25.7 percent, with wind and solar providing only 1.98 percent of the total.
By 2018, the state’s renewable portfolio had jumped to 43.8 percent of total generation, with clean power increasing and wind and solar now accounting for 17.9 percent of total generation. That’s a lot of power to depend on from inherently unreliable sources. Thus, it wouldn’t be at all surprising to learn that PG&E didn’t stop delivering power out of fear of starting fires, but because it knew it wouldn’t have power to deliver once high winds shut down all those wind turbines
Related News