Electric Vehicle Grid Integration aligns EV charging with grid capacity using smart charging, time-of-use rates, V2G, and demand response to reduce peak load, enable renewable energy, and optimize infrastructure planning.
Key Points
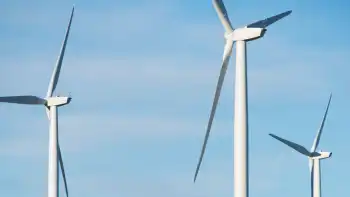
Aligning EV charging with grid needs via smart charging, TOU pricing, and V2G to balance load and support renewables.
✅ Time-of-use rates shift charging to off-peak hours
✅ Smart charging responds to real-time grid signals
✅ V2G turns fleets into distributed energy storage
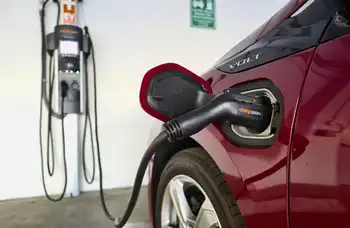
When Seattle City Light unveiled five new electric vehicle charging stations last month in an industrial neighborhood south of downtown, the electric utility wasn't just offering a new spot for drivers to fuel up. It also was creating a way for the service to figure out how much more power it might need as electric vehicles catch on.
Seattle aims to have nearly a third of its residents driving electric vehicles by 2030. Washington state is No. 3 in the nation in per capita adoption of plug-in cars, behind California and Hawaii. But as Washington and other states urge their residents to buy electric vehicles — a crucial component of efforts to reduce carbon emissions — they also need to make sure the electric grid can handle it amid an accelerating EV boom nationwide.
The average electric vehicle requires 30 kilowatt hours to travel 100 miles — the same amount of electricity an average American home uses each day to run appliances, computers, lights and heating and air conditioning.
An Energy Department study found that increased electrification across all sectors of the economy could boost national consumption by as much as 38 percent by 2050, in large part because of electric vehicles. The environmental benefit of electric cars depends on the electricity being generated by renewables.
So far, states predict they will be able to sufficiently boost power production. But whether electric vehicles will become an asset or a liability to the grid largely depends on when drivers charge their cars.
Electricity demand fluctuates throughout the day; demand is higher during daytime hours, peaking in the early evening. If many people buy electric vehicles and mostly try to charge right when they get home from work — as many now do — the system could get overloaded or force utilities to deliver more electricity than they are capable of producing.
In California, for example, the worry is not so much with the state’s overall power capacity, but rather with the ability to quickly ramp up production and maintain grid stability when demand is high, said Sandy Louey, media relations manager for the California Energy Commission, in an email. About 150,000 electric vehicles were sold in California in 2018 — 8 percent of all state car sales.
The state projects that electric vehicles will consume 5.4 percent of the state’s electricity, or 17,000 gigawatt hours, by 2030.
Responding to the growth in electric vehicles will present unique challenges for each state. A team of researchers from the University of Texas at Austin estimated the amount of electricity that would be required if every car on the road transitioned to electric. Wyoming, for instance, would need to nudge up its electricity production only 17 percent, while Maine would have to produce 55 percent more.
Efficiency Maine, a state trust that oversees energy efficiency and greenhouse gas reduction programs, offers rebates for the purchase of electric vehicles, part of state efforts to incentivize growth.
“We’re certainly mindful that if those projections are right, then there will need to be more supply,” said Michael Stoddard, the program’s executive director. “But it’s going to unfold over a period of the next 20 years. If we put our minds to it and plan for it, then we should be able to do it.”
A November report sponsored by the Energy Department found that there has been almost no increase in electricity demand nationwide over the past 10 years, while capacity has grown an average of 12 gigawatts per year (1 GW can power more than a half-million homes). That means energy production could climb at a similar rate and still meet even the most aggressive increase in electric vehicles, with proper planning.
Charging during off-peak hours would allow not only many electric vehicles to be added to the roads but also utilities to get more use out of power plants that run only during the limited peak times through improved grid coordination and flexible demand.
Seattle City Light and others are looking at various ways to promote charging during ideal times. One method is time-of-day rates. For the Seattle chargers unveiled last month, users will pay 31 cents per kilowatt hour during peak daytime hours and 17 cents during off-peak hours. The utility will monitor use at its charging stations to see how effective the rates are at shifting charging to more favorable times.
The utility also is working on a pilot program to study charging behavior at home. And it is partnering with customers such as King County Metro that are electrifying large vehicle fleets, including growing electric truck fleets that will demand significant power, to make sure they have both the infrastructure and charging patterns to integrate smoothly.
“Traditionally, our utility approach is to meet the load demand,” said Emeka Anyanwu, energy innovation and resources officer for Seattle City Light.
Instead, he said, the utility is working with customers to see whether they can use existing assets without the need for additional investment.
Numerous analysts say that approach is crucial.
“Even if there’s an overall increase in consumption, it really matters when that occurs,” said Sally Talberg, head of the Michigan Public Service Commission, which oversees the state’s utilities. “The encouragement of off-peak charging and other technology solutions that could come to bear could offset any negative impact.”
One of those solutions is smart charging, a system in which vehicles are plugged in but don’t charge until they receive a signal from the grid that demand has tapered off a sufficient amount. This is often paired with a lower rate for drivers who use it. Several smart-charging pilot programs are being conducted by utilities, although they have not yet been phased in widely, amid ongoing debates over charging control among manufacturers and utilities.
In many places, the increased electricity demand from electric vehicles is seen as a benefit to utilities and rate payers. In the Northwest, electricity consumption has remained relatively stagnant since 2000, despite robust population growth and development. That’s because increasing urbanization and building efficiency have driven down electricity needs.
Electric vehicles could help push electricity consumption closer to utilities’ capacity for production. That would bring in revenue for the providers, which would help defray the costs for maintaining that capacity, lowering rates for all customers.
“Having EV loads is welcome, because it’s environmentally cleaner and helps sustain revenues for utilities,” said Massoud Jourabchi, manager of economic analysis for the Northwest Power and Conservation Council, which develops power plans for the region.
Colorado also is working to promote electric cars, with the aim of putting 940,000 on the road by 2030. The state has adopted California’s zero-emission vehicles mandate, which requires automakers to reach certain market goals for their sales of cars that don’t burn fossil fuels, while extending tax credits for the purchase of such cars, investing in charging stations and electrifying state fleets.
Auto dealers have opposed the mandate, saying it infringes on consumer freedom.
“We think it should be a customer choice, a consumer choice and not a government mandate,” said Tim Jackson, president and chief executive of the Colorado Automobile Dealers Association.
Jackson also said that there’s not yet a strong consumer appetite for electric vehicles, meaning that manufacturers that fail to sell the mandated number of emission-free vehicles would be required to purchase credits, which he thinks would drive up the price of their other models.
Republicans in the state have registered similar concerns, saying electric vehicle adoption should take place based on market forces, not state intervention.
Many in the utility community are excited about the potential for electric cars to serve as mobile energy storage for the grid. Vehicle-to-grid technology, known as V2G, would allow cars charging during the day to take on surplus power from renewable energy sources.
Then, during peak demand times, electric vehicles would return some of that stored energy to the grid. As demand tapers off in the evening, the cars would be able to recharge.
In practice, V2G technology could be especially beneficial if used by heavy-duty fleets, such as school buses or utility vehicles. Those fleets would have substantial battery storage and long periods where they are idle, such as evenings and weekends — and even longer periods such as summer and the holiday season when school is out. The batteries on a bus, Jourabchi said, could store as much as 10 times the electricity needed to power a home for a day.
Related News