European Oil Majors Energy Transition highlights BP, Shell, and Total rapidly scaling renewables, wind and solar assets, hydrogen, electricity, and EV charging while cutting upstream capex, aligning with net-zero goals and utility-style energy services.
Key Points
It is the shift by BP, Shell, Total and peers toward renewables, electricity, hydrogen, and EV charging to meet net-zero goals.
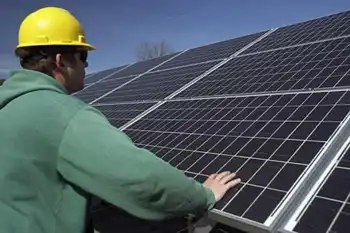
✅ Offshore wind, solar, and hydrogen projects scale across Europe
✅ Capex shifts, fossil output declines, net-zero targets by 2050
✅ EV charging, utilities, and power trading become core services
Under pressure from governments and investors, including rising investor pressure at utilities that reverberates across the sector, industry leaders like BP and Shell are accelerating their production of cleaner energy.
This may turn out to be the year that oil giants, especially in Europe, started looking more like electric companies.
Late last month, Royal Dutch Shell won a deal to build a vast wind farm off the coast of the Netherlands. Earlier in the year, France’s Total, which owns a battery maker, agreed to make several large investments in solar power in Spain and a wind farm off Scotland. Total also bought an electric and natural gas utility in Spain and is joining Shell and BP in expanding its electric vehicle charging business.
At the same time, the companies are ditching plans to drill more wells as they chop back capital budgets. Shell recently said it would delay new fields in the Gulf of Mexico and in the North Sea, while BP has promised not to hunt for oil in any new countries.
Prodded by governments and investors to address climate change concerns about their products, Europe’s oil companies are accelerating their production of cleaner energy — usually electricity, sometimes hydrogen — and promoting natural gas, which they argue can be a cleaner transition fuel from coal and oil to renewables, as carbon emissions drop in power generation.
For some executives, the sudden plunge in demand for oil caused by the pandemic — and the accompanying collapse in earnings — is another warning that unless they change the composition of their businesses, they risk being dinosaurs headed for extinction.
This evolving vision is more striking because it is shared by many longtime veterans of the oil business.
“During the last six years, we had extreme volatility in the oil commodities,” said Claudio Descalzi, 65, the chief executive of Eni, who has been with that Italian company for nearly 40 years. He said he wanted to build a business increasingly based on green energy rather than oil.
“We want to stay away from the volatility and the uncertainty,” he added.
Bernard Looney, a 29-year BP veteran who became chief executive in February, recently told journalists, “What the world wants from energy is changing, and so we need to change, quite frankly, what we offer the world.”
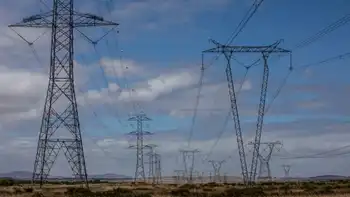
The bet is that electricity will be the prime means of delivering cleaner energy in the future and, therefore, will grow rapidly as clean-energy investment incentives scale globally.
American giants like Exxon Mobil and Chevron have been slower than their European counterparts to commit to climate-related goals that are as far reaching, analysts say, partly because they face less government and investor pressure (although Wall Street investors are increasingly vocal of late).
“We are seeing a much bigger differentiation in corporate strategy” separating American and European oil companies “than at any point in my career,” said Jason Gammel, a veteran oil analyst at Jefferies, an investment bank.
Companies like Shell and BP are trying to position themselves for an era when they will rely much less on extracting natural resources from the earth than on providing energy as a service tailored to the needs of customers — more akin to electric utilities than to oil drillers.
They hope to take advantage of the thousands of engineers on their payrolls to manage the construction of new types of energy plants; their vast networks of retail stations to provide services like charging electric vehicles; and their trading desks, which typically buy and hedge a wide variety of energy futures, to arrange low-carbon energy supplies for cities or large companies.
All of Europe’s large oil companies have now set targets to reduce the carbon emissions that contribute to climate change. Most have set a ”net zero” ambition by 2050, a goal also embraced by governments like the European Union and Britain.
The companies plan to get there by selling more and more renewable energy and by investing in carbon-free electricity across their portfolios, and, in some cases, by offsetting emissions with so-called nature-based solutions like planting forests to soak up carbon.
Electricity is the key to most of these strategies. Hydrogen, a clean-burning gas that can store energy and generate electric power for vehicles, also plays an increasingly large role.
The coming changes are clearest at BP. Mr. Looney said this month that he planned to increase investment in low-emission businesses like renewable energy by tenfold in the next decade to $5 billion a year, while cutting back oil and gas production by 40 percent. By 2030, BP aims to generate renewable electricity comparable to a few dozen large offshore wind farms.
Mr. Looney, though, has said oil and gas production need to be retained to generate cash to finance the company’s future.
Environmentalists and analysts described Mr. Looney’s statement that BP’s oil and gas production would decline in the future as a breakthrough that would put pressure on other companies to follow.
BP’s move “clearly differentiates them from peers,” said Andrew Grant, an analyst at Carbon Tracker, a London nonprofit. He noted that most other oil companies had so far been unwilling to confront “the prospect of producing less fossil fuels.”
While there is skepticism in both the environmental and the investment communities about whether century-old companies like BP and Shell can learn new tricks, they do bring scale and know-how to the task.
“To make a switch from a global economy that depends on fossil fuels for 80 percent of its energy to something else is a very, very big job,” said Daniel Yergin, the energy historian who has a forthcoming book, “The New Map,” on the global energy transition now occurring in energy. But he noted, “These companies are really good at big, complex engineering management that will be required for a transition of that scale.”
Financial analysts say the dreadnoughts are already changing course.
“They are doing it because management believes it is the right thing to do and also because shareholders are severely pressuring them,” said Michele Della Vigna, head of natural resources research at Goldman Sachs.
Already, he said, investments by the large oil companies in low-carbon energy have risen to as much as 15 percent of capital spending, on average, for 2020 and 2021 and around 50 percent if natural gas is included.
Oswald Clint, an analyst at Bernstein, forecast that the large oil companies would expand their renewable-energy businesses like wind, solar and hydrogen by around 25 percent or more each year over the next decade.
Shares in oil companies, once stock market stalwarts, have been marked down by investors in part because of the risk that climate change concerns will erode demand for their products. European electric companies are perceived as having done more than the oil industry to embrace the new energy era.
“It is very tricky for an investor to have confidence that they can pull this off,” Mr. Clint said, referring to the oil industry’s aspirations to change.
But, he said, he expects funds to flow back into oil stocks as the new businesses gather momentum.
At times, supplying electricity has been less profitable than drilling for oil and gas. Executives, though, figure that wind farms and solar parks are likely to produce more predictable revenue, partly because customers want to buy products labeled green.
Mr. Descalzi of Eni said converted refineries in Venice and Sicily that the company uses to make lower-carbon fuel from plant matter have produced better financial results in this difficult year than its traditional businesses.
Oil companies insist that they must continue with some oil and gas investments, not least because those earnings can finance future energy sources. “Not to make any mistake,” Patrick Pouyanné, chief executive of Total, said to analysts recently: Low-cost oil projects will be a part of the future.
During the pandemic, BP, Total and Shell have all scrutinized their portfolios, partly to determine if climate change pressures and lingering effects from the pandemic mean that petroleum reserves on their books — developed for perhaps billions of dollars, when oil was at the center of their business — might never be produced or earn less than previously expected. These exercises have led to tens of billions of dollars of write-offs for the second quarter, and there are likely to be more as companies recalibrate their plans.
“We haven’t seen the last of these,” said Luke Parker, vice president for corporate analysis at Wood Mackenzie, a market research firm. “There will be more to come as the realities of the energy transition bite.”
Related News