New Zealand Energy Transition will electrify transport and industry with renewables, grid-scale solar, wind farms, geothermal, batteries, demand response, pumped hydro, and transmission upgrades to manage dry-year risk and winter peak loads.
Key Points
A shift to renewables and smart demand to decarbonise transport and industry while ensuring reliable, affordable power.
✅ Electrifies transport and industrial heat with renewables
✅ Uses demand response, batteries, and pumped hydro for resilience
✅ Targets 99%+ renewable supply, managing dry-year and peak loads
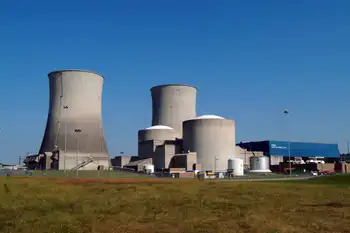
As fossil fuels are phased out over the coming decades, the Climate Change Commission (CCC) suggests electricity will take up much of the slack, aligning with the vision of a sustainable electric planet powering our vehicle fleet and replacing coal and gas in industrial processes.
But can the electricity system really provide for this increased load where and when it is needed? The answer is “yes”, with some caveats.
Our research examines climate change impacts on the New Zealand energy system. It shows we’ll need to pay close attention to demand as well as supply. And we’ll have to factor in the impacts of climate change when we plan for growth in the energy sector.
Demand for electricity to grow
While electricity use has not increased in NZ in the past decade, many agencies project steeply rising demand in coming years. This is partly due to both increasing population and gross domestic product, but mostly due to the anticipated electrification of transport and industry, which could result in a doubling of demand by mid-century.
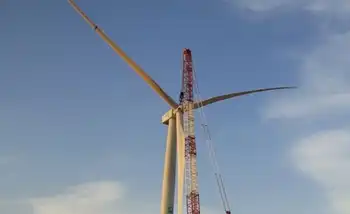
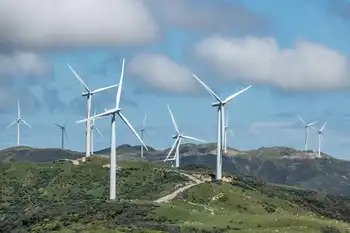
It’s hard to get a sense of the scale of the new generation required, but if wind was the sole technology employed to meet demand by 2050, between 10 and 60 new wind farms would be needed nationwide.
Of course, we won’t only build wind farms, as renewables are coming on strong and grid-scale solar, rooftop solar, new geothermal, some new small hydro plant and possibly tidal and wave power will all have a part to play.
Managing the demand
As well as providing more electricity supply, demand management and batteries will also be important. Our modelling shows peak demand (which usually occurs when everyone turns on their heaters and ovens at 6pm in winter) could be up to 40% higher by 2050 than it is now.
But meeting this daily period of high demand could see expensive plant sitting idle for much of the time (with the last 25% of generation capacity only used about 10% of the time).
This is particularly a problem in a renewable electricity system when the hydro lakes are dry, as hydro is one of the few renewable electricity sources that can be stored during the day (as water behind the dam) and used over the evening peak (by generating with that stored water).
Demand response will therefore be needed. For example, this might involve an industrial plant turning off when there is too much load on the electricity grid.
But by 2050, a significant number of households will also need smart appliances and meters that automatically use cheaper electricity at non-peak times. For example, washing machines and electric car chargers could run automatically at 2am, rather than 6pm when demand is high.
Our modelling shows a well set up demand response system could mitigate dry-year risk (when hydro lakes are low on water) in coming decades, where currently gas and coal generation is often used.
Instead of (or as well as) having demand response and battery systems to combat dry-year risk, a pumped storage system could be built. This is where water is pumped uphill when hydro lake inflows are plentiful, and used to generate electricity during dry periods.
The NZ Battery project is currently considering the potential for this in New Zealand, and debates such as whether we would use Site C's electricity offer relevant lessons.
Almost (but not quite) 100% renewable
Dry-year risk would be greatly reduced and there would be “greater greenhouse gas emissions savings” if the Interim Climate Change Committee’s (ICCC) 2019 recommendation to aim for 99% renewable electricity was adopted, rather than aiming for 100%.
A small amount of gas-peaking plant would therefore be retained. The ICCC said going from 99% to 100% renewable electricity by overbuilding would only avoid a very small amount of carbon emissions, at a very high cost.
Our modelling supports this view. The CCC’s draft advice on the issue also makes the point that, although 100% renewable electricity is the “desired end point”, timing is important to enable a smooth transition.
Despite these views, Energy Minister Megan Woods has said the government will be keeping the target of a 100% renewable electricity sector by 2030.
Impacts of climate change
In future, the electricity system will have to respond to changing climate patterns as well, becoming resilient to climate risks over time.
The National Institute of Water and Atmospheric Research predicts winds will increase in the South Island and decrease in the far north in coming decades.
Inflows to the biggest hydro lakes will get wetter (more rain in their headwaters), and their seasonality will change due to changes in the amount of snow in these catchments.
Our modelling shows the electricity system can adapt to those changing conditions. One good news story (unless you’re a skier) is that warmer temperatures will mean less snow storage at lower elevations, and therefore higher lake inflows in the big hydro catchments in winter, leading to a better match between times of high electricity demand and higher inflows.
The price is right
The modelling also shows the cost of generating electricity is not likely to increase, because the price of building new sources of renewable energy continues to fall globally.
Because the cost of building new renewables is now cheaper than non-renewables (such as coal-fired plants), investing in carbon-free electricity is increasingly compelling, and renewables are more likely to be built to meet new demand in the near term.
While New Zealand’s electricity system can enable the rapid decarbonisation of (at least) our transport and industrial heat sectors, international efforts like cleaning up Canada's electricity underline the need for certainty so the electricity industry can start building to meet demand everywhere.
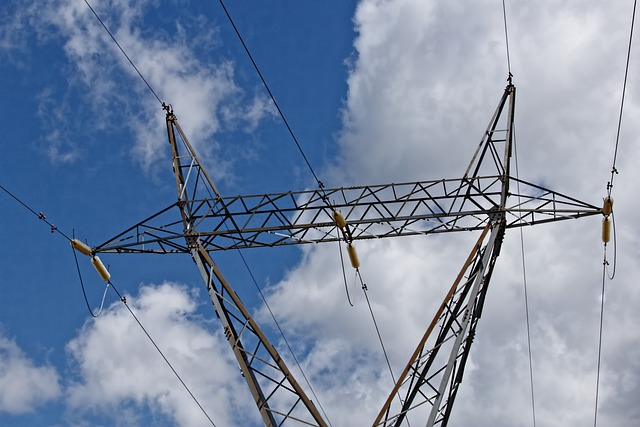
Bipartisan cooperation at government level will be important to encourage significant investment in generation and transmission projects with long lead times and life expectancies, as analyses of climate policy and grid implications underscore in comparable markets.
Infrastructure and markets are needed to support demand response uptake, as well as certainty around the Tiwai exit in 2024 and whether pumped storage is likely to be built.
Our electricity system can support the rapid decarbonisation needed if New Zealand is to do its fair share globally to tackle climate change.
But sound planning, firm decisions and a supportive and relatively stable regulatory framework are all required before shovels can hit the ground.
Related News