IEEE begins work on new power switchgear standards

By Electricity Forum


Substation Relay Protection Training

Our customized live online or in‑person group training can be delivered to your staff at your location.

  • Live Online
  • 12 hours Instructor-led
  • Group Training Available
Regular Price:
$699
Coupon Price:
$599
Reserve Your Seat Today
The IEEE has launched work on a new standard, IEEE PC37.20.8 "Standard for Metal-Enclosed Low-Voltage (3200V and Below) Direct Current Power Circuit Breaker Switchgear for Traction Power Applications."

The intent of the project is to identify specific requirements of metal-enclosed low-voltage direct current power circuit breaker switchgear used in traction power applications.

IEEE has also approved work to begin on revisions to three existing switchgear standards. The first, IEEE PC37.10, "Guide for Investigation, Analysis and Reporting of Power Circuit Breaker Failures," will combine the existing C37.10 standard with IEEE 1325, "IEEE Recommended Practice for Reporting Field Failure Data for Power Circuit Breakers," which will then be withdrawn.

The next two revisions, IEEE PC37.013, "Standard for AC High Voltage (Rated Above 1000 V) Generator Circuit Breakers for Use With Generators Rated 10 MVA or More," and IEEE PC37.016, "Standard for AC High Voltage Circuit Switchers Rated 15.5kV through 245kV," will each be revised in coordination with the International Electrotechnical Commission (IEC) as part of our harmonization efforts between IEEE and the IEC.

IEEE has also approved a new switchgear standard, IEEE C37.16, "Standard for Preferred Ratings, Related Requirements, and Application Recommendations for Low-Voltage AC (635V and Below) and DC (3200V and Below) Power Circuit Breakers." The standard defines the preferred ratings for low-voltage AC (635V and below) power circuit breakers, general-purpose DC (325V and below) power circuit breakers, heavy duty low-voltage DC (3200V and below) power circuit breakers, and fused (integrally or non-integrally) low-voltage AC (600V and below) power circuit breakers.

IEEE has also reaffirmed two existing standards: IEEE C37.26, "IEEE Guide for Methods of Power Factor Measurement for Low-Voltage Inductive Test Circuits"; and IEEE C37.40, "IEEE Standard Service Conditions and Definitions for High-Voltage Fuses, Distribution Enclosed Single-Pole Air Switches, Fuse Disconnecting Switches, and Accessories."

Related News

On the road to 100 per cent renewables

US Climate Alliance 100% Renewables 2035 accelerates clean energy, electrification, and decarbonization, replacing coal and gas with wind, solar, and storage to cut air pollution, lower energy bills, create jobs, and advance environmental justice.


Key Points

A state-level target for alliance members to meet all electricity demand with renewable energy by 2035.

✅ 100% RES can meet rising demand from electrification

✅ Major health gains from reduced SO2, NOx, and particulates

✅ Jobs grow, energy burdens fall, climate resilience improves


The Union of Concerned Scientists joined with COPAL (Minnesota), GreenRoots (Massachusetts), and the Michigan Environmental Justice Coalition, to better understand the feasibility and implications of leadership states meeting 100 percent of their electricity needs with renewable energy by 2035, a target reflected in federal clean electricity goals under discussion today.

We focused on 24 member states of the United States Climate Alliance, a bipartisan coalition of governors committed to the goals of the 2015 Paris Climate Agreement. We analyzed two main scenarios: business as usual versus 100 percent renewable electricity standards, in line with many state clean energy targets now in place.

Our analysis shows that:

Climate Alliance states can meet 100 percent of their electricity consumption with renewable energy by 2035, as independent assessments of zero-emissions feasibility suggest. This holds true even with strong increases in demand due to the electrification of transportation and heating.

A transition to renewables yields strong benefits in terms of health, climate, economies, and energy affordability.

To ensure an equitable transition, states should broaden access to clean energy technologies and decision making to include environmental justice and fossil fuel-dependent communitieswhile directly phasing out coal and gas plants.

Demands for climate action surround us. Every day brings news of devastating "this is not normal" extreme weather: record-breaking heat waves, precipitation, flooding, wildfires. To build resilience and mitigate the worst impacts of the climate crisis requires immediate action to reduce heat-trapping emissions and transition to renewable energy, including practical decarbonization strategies adopted by states.

On the Road to 100 Percent Renewables explores actions at one critical level: how leadership states can address climate change by reducing heat-trapping emissions in key sectors of the economy as well as by considering the impacts of our energy choices. A collaboration of the Union of Concerned Scientists and local environmental justice groups COPAL (Minnesota), GreenRoots (Massachusetts), and the Michigan Environmental Justice Coalition, with contributions from the national Initiative for Energy Justice, assessed the potential to accelerate the use of renewable energy dramatically through state-level renewable electricity standards (RESs), major drivers of clean energy in recent decades. In addition, the partners worked with Greenlink Analytics, an energy research organization, to assess how RESs most directly affect people's lives, such as changes in public health, jobs, and energy bills for households.

Focusing on 24 members of the United States Climate Alliance (USCA), the study assesses the implications of meeting 100 percent of electricity consumption in these states, including examples like Rhode Island's 100% by 2030 plan that inform policy design, with renewable energy in the near term. The alliance is a bipartisan coalition of governors committed to reducing heat-trapping emissions consistent with the goals of the 2015 Paris climate agreement.[1]

On the Road to 100 Percent Renewables looks at three types of results from a transition to 100 percent RES policies: improvements in public health from decreasing the use of coal and gas2 power plants; net job creation from switching to more labor-oriented clean energy; and reduced household energy bills from using cleaner sources of energy. The study assumes a strong push to electrify transportation and heating to address harmful emissions from the current use of fossil fuels in these sectors. Our core policy scenario does not focus on electricity generation itself, nor does it mandate retiring coal, gas, and nuclear power plants or assess new policies to drive renewable energy in non-USCA states.

Our analysis shows that:

USCA states can meet 100 percent of their electricity consumption with renewable energy by 2035 even with strong increases in demand due to electrifying transportation and heating.

A transition to renewables yields strong benefits in terms of health, climate, economies, and energy affordability.

Renewable electricity standards must be paired with policies that address not only electricity consumption but also electricity generation, including modern grid infrastructure upgrades that enable higher renewable shares, both to transition away from fossil fuels more quickly and to ensure an equitable transition in which all communities experience the benefits of a clean energy economy.

Currently, the states in this analysis meet their electricity needs with differing mixes of electricity sourcesfossil fuels, nuclear, and renewables. Yet across the states, the study shows significant declines in fossil fuel use from transitioning to clean electricity; the use of solar and wind powerthe dominant renewablesgrows substantially:

In the study's "No New Policy" scenario"business as usual"coal and gas generation stay largely at current levels over the next two decades. Electricity generation from wind and solar grows due to both current policies and lowest costs.

In a "100% RES" scenario, each USCA state puts in place a 100 percent renewable electricity standard. Gas generation falls, although some continues for export to non-USCA states. Coal generation essentially disappears by 2040. Wind and solar generation combined grow to seven times current levels, and three times as much as in the No New Policy scenario.

A focus on meeting in-state electricity consumption in the 100% RES scenario yields important outcomes. Reductions in electricity from coal and gas plants in the USCA states reduce power plant pollution, including emissions of sulfur dioxide and nitrogen oxides. By 2040, this leads to 6,000 to 13,000 fewer premature deaths than in the No New Policy scenario, as well as 140,000 fewer cases of asthma exacerbation and 700,000 fewer lost workdays. The value of the additional public health benefits in the USCA states totals almost $280 billion over the two decades. In a more detailed analysis of three USCA statesMassachusetts, Michigan, and Minnesotathe 100% RES scenario leads to almost 200,000 more added jobs in building and installing new electric generation capacity than the No New Policy scenario.

The 100% RES scenario also reduces average energy burdens, the portion of household income spent on energy. Even considering household costs solely for electricity and gas, energy burdens in the 100% RES scenario are at or below those in the No New Policy scenario in each USCA state in most or all years. The average energy burden across those states declines from 3.7 percent of income in 2020 to 3.0 percent in 2040 in the 100% RES scenario, compared with 3.3 percent in 2040 in the No New Policy scenario.

Decreasing the use of fossil fuels through increasing the use of renewables and accelerating electrification reduces emissions of carbon dioxide (CO2), with implications for climate, public health, and economies. Annual CO2 emissions from power plants in USCA states decrease 58 percent from 2020 to 2040 in the 100% RES scenario compared with 12 percent in the No New Policy scenario.

The study also reveals gaps to be filled beyond eliminating fossil fuel pollution from communities, such as the persistence of gas generation to sell power to neighboring states, reflecting barriers to a fully renewable grid that policy must address. Further, it stresses the importance of policies targeting just and equitable outcomes in the move to renewable energy.

Moving away from fossil fuels in communities most affected by harmful air pollution should be a top priority in comprehensive energy policies. Many communities continue to bear far too large a share of the negative impacts from decades of siting the infrastructure for the nation's fossil fuel power sector in or near marginalized neighborhoods. This pattern will likely persist if the issue is not acknowledged and addressed. State policies should mandate a priority on reducing emissions in communities overburdened by pollution and avoiding investments inconsistent with the need to remove heat-trapping emissions and air pollution at an accelerated rate. And communities must be centrally involved in decisionmaking around any policies and rules that affect them directly, including proposals to change electricity generation, both to retire fossil fuel plants and to build the renewable energy infrastructure.

Key recommendations in On the Road to 100 Percent Renewables address moving away from fossil fuels, increasing investment in renewable energy, and reducing CO2 emissions. They aim to ensure that communities most affected by a history of environmental racism and pollution share in the benefits of the transition: cleaner air, equitable access to good-paying jobs and entrepreneurship alternatives, affordable energy, and the resilience that renewable energy, electrification, energy efficiency, and energy storage can provide. While many communities can benefit from the transition, strong justice and equity policies will avoid perpetuating inequities in the electricity system. State support to historically underserved communities for investing in solar, energy efficiency, energy storage, and electrification will encourage local investment, community wealth-building, and the resilience benefits the transition to renewable energy can provide.

A national clean electricity standard and strong pollution standards should complement state action to drive swift decarbonization and pollution reduction across the United States. Even so, states are well positioned to simultaneously address climate change and decades of inequities in the power system. While it does not substitute for much-needed national and international leadership, strong state action is crucial to achieving an equitable clean energy future.


Related News

View more

EIA expects solar and wind to be larger sources of U.S. electricity generation this summer

US Summer Electricity Outlook 2022 projects rising renewable energy generation as utility-scale solar and wind capacity additions surge, while coal declines and natural gas shifts amid higher fuel prices and regional supply constraints.


Key Points

An EIA forecast of summer 2022 power: more solar and wind, less coal, and shifting gas use amid higher fuel prices.

✅ Solar +10 million MWh; wind +8 million MWh vs last summer

✅ Coal generation -20 million MWh amid supply constraints, retirements

✅ Gas prices near $9/MMBtu; slight national gen decline


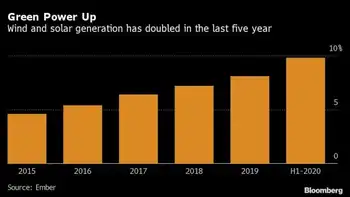
In our Summer Electricity Outlook, a supplement to our May 2022 Short-Term Energy Outlook, we expect the largest increases in U.S. electric power sector generation this summer will come from renewable energy sources such as wind and solar generation. These increases are the result of new capacity additions. We forecast utility-scale solar generation between June and August 2022 will grow by 10 million megawatthours (MWh) compared with the same period last summer, and wind generation will grow by 8 million MWh. Forecast generation from coal and natural gas declines by 26 million MWh this summer, although natural gas generation could increase in some electricity markets where coal supplies are constrained.

For recent context, overall U.S. power generation in January rose 9.3% year over year, the EIA reports.

Wind and solar power electric-generating capacity has been growing steadily in recent years. By the start of June, we estimate the U.S. electric power sector will have 65 gigawatts (GW) of utility-scale solar-generating capacity, a 31% increase in solar capacity since June 2021. Almost one-third of this new solar capacity will be built in the Texas electricity market. The electric power sector will also have an estimated 138 GW of wind capacity online this June, which is a 12% increase from last June.

Along with growth in renewables capacity, we expect that an additional 6 GW of new natural gas combined-cycle generating capacity will come online by June 2022, an increase of 2% from last summer. Despite this increase in capacity, we expect natural gas-fired electricity generation at the national level will be slightly (1.3%) lower than last summer.

We forecast the price of natural gas delivered to electric generators will average nearly $9 per million British thermal units between June and August 2022, which would be more than double the average price last summer. The higher expected natural gas prices and growth in renewable generation will likely lead to less natural gas-fired generation in some regions of the country.

In contrast to renewables and natural gas, the electricity industry has been steadily retiring coal-fired power plants over the past decade. Between June 2021 and June 2022, the electric power sector will have retired 6 GW (2%) of U.S. coal-fired generating capacity.

In previous years, higher natural gas prices would have resulted in more coal-fired electricity generation across the fleet. However, coal-fired power plants have been limited in their ability to replenish their historically low inventories in recent months as a result of mine closures, rail capacity constraints, and labor market tightness. These coal supply constraints, along with continued retirement of generating capacity, contribute to our forecast that U.S. coal-fired generation will decline by 20 million MWh (7%) this summer. In some regions of the country, these coal supply constraints may lead to increased natural gas-fired electricity generation despite higher natural gas prices.


Related News

View more

China to build 2,000-MW Lawa hydropower station on Jinsha River

Lawa Hydropower Station approved on the Jinsha River, a Yangtze tributary, delivers 2,000 MW via four units; 784 ft dam, 12 sq mi reservoir, Sichuan-Tibet site, US$4.59b investment, Huadian stake, renewable energy generation.


Key Points

A 2,000 MW dam project on the Jinsha River with four units, a 784 ft barrier, and 8.36 billion kWh annual output.

✅ Sichuan-Tibet junction on the Jinsha River

✅ 2,000 MW capacity; four turbine-generator units

✅ 8.36 bn kWh/yr; US$4.59b total; Huadian 48% stake


China has approved construction of the 2,000-MW Lawa hydropower station, a Yangtze tributary hydropower project on the Jinsha River, multiple news agencies are reporting.

Lawa, at the junction of Sichuan province and the Tibet autonomous region, will feature a 784-foot-high dam and the reservoir will submerge about 12 square miles of land. The Jinsha River is a tributary of the Yangtze River, and the project aligns with green hydrogen development in China.

The National Development and Reform Commission of the People’s Republic of China, which also guides China's nuclear energy development as part of national planning, is reported to have said that four turbine-generator units will be installed, and the project is expected to produce about 8.36 billion kWh of electricity annually.

Total investment in the project is to be US$4.59 billion, and Huadian Group Co. Ltd. will have a 48% stake in the project, reflecting overseas power infrastructure activity, with minority stakes held by provincial firms, according to China Daily.

In other recent news in China, Andritz received an order in December 2018 to supply four 350-MW reversible pump-turbines and motor-generators, alongside progress in compressed air generation technologies, for the 1,400-MW ZhenAn pumped storage plant in Shaanxi province.


Related News

View more

COVID-19: Daily electricity demand dips 15% globally, says report

COVID-19 Impact on Electricity Demand, per IEA data, shows 15% global load drop from lockdowns, with residential use up, industrial and service sectors down; fossil fuel generation fell as renewables and photovoltaics gained share.


Key Points

An overview of how lockdowns cut global power demand, boosted residential use, and increased the renewable share.

✅ IEA review shows at least 15% dip in daily global electricity load

✅ Lockdowns cut commercial and industrial demand; homes used more

✅ Fossil fuels fell as renewables and PV generation gained share


The daily demand for electricity dipped at least 15 per cent across the globe, according to Global Energy Review 2020: The impacts of the COVID-19 crisis on global energy demand and CO2 emissions, a report published by the International Energy Agency (IEA) in April 2020, even as global power demand surged above pre-pandemic levels.

The report collated data from 30 countries, including India and China, that showed partial and full lockdown measures adopted by them were responsible for this decrease.

Full lockdowns in countries — including France, Italy, India, Spain, the United Kingdom where daily demand fell about 10% and the midwest region of the United States (US) — reduced this demand for electricity.


Reduction in electricity demand after lockdown measures (weather corrected)


Source: Global Energy Review 2020: The impacts of the COVID-19 crisis on global energy demand and CO2 emissions, IEA


Drivers of the fall

There was, however, a spike in residential demand for electricity as a result of people staying and working from home. This increase in residential demand, though, was not enough to compensate for reduced demand from industrial and commercial operations.

The extent of reduction depended not only on the duration and stringency of the lockdown, but also on the nature of the economy of the countries — predominantly service- or industry-based — the IEA report said.

A higher decline in electricity demand was noted in countries where the service sector — including retail, hospitality, education, tourism — was dominant, compared to countries that had industrial economies.

The US, for example — where industry forms only 20 per cent of the economy — saw larger reductions in electricity demand, compared to China, where power demand dropped as the industry accounts for more than 60 per cent of the economy.

Italy — the worst-affected country from COVID-19 — saw a decline greater than 25 per cent when compared to figures from last year, even as power demand held firm in parts of Europe during later lockdowns.

The report said the shutting down of the hospitality and tourism sectors in the country — major components of the Italian economy — were said to have had a higher impact, than any other factor, for this fall.


Reduced fossil fuel dependency

Almost all of the reduction in demand was reportedly because of the shutting down of fossil fuel-based power generation, according to the report. Instead, the share of electricity supply from renewables in the entire portfolio of energy sources, increased during the pandemic, reflecting low-carbon electricity lessons observed during COVID-19.

This was due to a natural increase in wind and photovoltaic power generation compared to 2019 along with a drop in overall electricity demand that forced electricity producers from non-renewable sources to decrease their supplies, before surging electricity demand began to strain power systems worldwide.

The Power System Operation Corporation of India also reported that electricity production from coal — India’s primary source of electricity — fell by 32.2 per cent to 1.91 billion units (kilowatt-hours) per day, in line with India's electricity demand decline reported during the pandemic, compared to the 2019 levels.


Related News

View more

BC Hydro says province sleeping in, showering less in pandemic

BC Hydro pandemic electricity trends reveal weekend-like energy consumption patterns: later morning demand, earlier evenings, more cooking, streaming on smart TVs, and work-from-home routines, with tips to conserve using laptops and small appliances.


Key Points

Weekend-like shifts in power demand from work-from-home routines: later mornings, earlier evenings, and more streaming.

✅ Later morning electricity demand; earlier evening peaks

✅ More cooking and baking; increased streaming after dinner

✅ Conservation tips: laptops, small appliances, smart TVs


The latest report on electricity usage in British Columbia reveals the COVID-19 pandemic has created an atmosphere where every day feels like a Saturday, a pattern also reflected in BC electricity demand during peak seasons.

BC Hydro says overall power usage hasn't changed much, but similar Ontario electricity demand shifts suggest regional differences, while Manitoba demand fell more noticeably, and a survey of 500 people shows daily routines have shifted dramatically since mid-March when pandemic-related closures began.

The hydro report says, with nearly 40 per cent of B.C. residents working from home, trends in residential electricity use confirm almost half are sleeping in and eating breakfast later, while about a quarter say they are showering less.

Those patterns more closely resemble what hydro says is typical weekend power consumption, and could influence time-of-use rates as electricity demand occurs later in the morning and earlier in the evening.

The report also finds many people are cooking and baking more than before the pandemic, preparing the evening meal earlier, streaming or viewing more television after dinner even as Ottawa's electricity consumption dipped earlier in the pandemic, and 80 per cent are going to bed later.

Although electricity use is normal for this time of year, hydro says homebound residents can conserve by using laptops instead of desktops, small appliances such as Instant Pots instead of ovens, and streaming movies or TV shows on a smart televisions instead of game consoles, even as Hydro One peak rates continue to shape consumption patterns elsewhere.


Related News

View more

No time to be silent on NZ's electricity future

New Zealand Renewable Energy Strategy examines decarbonisation, GHG emissions, and net energy as electrification accelerates, expanding hydro, geothermal, wind, and solar PV while weighing intermittency, storage, materials, and energy security for a resilient power system.


Key Points

A plan to expand electricity generation, balancing decarbonisation, net energy limits, and energy security.

✅ Distinguishes decarbonisation targets from renewable capacity growth

✅ Highlights net energy limits, intermittency, and storage needs

✅ Addresses materials, GHG build-out costs, and energy security


The Electricity Authority has released a document outlining a plan to achieve the Government’s goal of more than doubling the amount of electricity generated in New Zealand over the next few decades.

This goal is seen as a way of both reducing our greenhouse gas (GHG) emissions overall, as everything becomes electrified, and ensuring we have a 100 percent renewable energy system at our disposal. Often these two goals are seen as being the same – to decarbonise we must transition to more renewable energy to power our society.

But they are quite different goals and should be clearly differentiated. GHG emissions could be controlled very effectively by rationing the use of a fossil fuel lockdown approach, with declining rations being available over a few years. Such a direct method of controlling emissions would ensure we do our bit to remain within a safe carbon budget.

If we took this dramatic step we could stop fretting about how to reduce emissions (that would be guaranteed by the rationing), and instead focus on how to adapt our lives to the absence of fossil fuels.

Again, these may seem like the same task, but they are not. Decarbonising is generally thought of in terms of replacing fossil fuels with some other energy source, signalling that a green recovery must address more than just wind capacity. Adapting our lives to the absence of fossil fuels pushes us to ask more fundamental questions about how much energy we actually need, what we need energy for, and the impact of that energy on our environment.

MBIE data indicate that between 1990 and 2020, New Zealand almost doubled the total amount of energy it produced from renewable energy sources - hydro, geothermal and some solar PV and wind turbines.

Over this same time period our GHG emissions increased by about 25 percent. The increase in renewables didn’t result in less GHG emissions because we increased our total energy use by almost 50 percent, mostly by using fossil fuels. The largest fossil fuel increases were used in transport, agriculture, forestry and fisheries (approximately 60 percent increases for each).

These data clearly demonstrate that increasing renewable energy sources do not necessarily result in reduced GHG emissions.

The same MBIE data indicate that over this same time period, the amount of Losses and Own Use category for energy use more than doubled. As of 2020 almost 30 percent of all energy consumed in New Zealand fell into this category.

These data indicate that more renewable energy sources are historically associated with less energy actually being available to do work in society.

While the category Losses and Own Use is not a net energy analysis, the large increase in this category makes the call for a system-wide net energy analysis all the more urgent.

Net energy is the amount of energy available after the energy inputs to produce and deliver the energy is subtracted. There is considerable data available indicating that solar PV and wind turbines have a much lower net energy surplus than fossil fuels.

And there is further evidence that when the intermittency and storage requirements are engineered into a total renewable energy system, the net energy of the entire system declines sharply. Could the Losses and Other Uses increase over this 30-year period be an indication of things to come?

Despite the importance of net energy analysis in designing a national energy system which is intended to provide energy security and resilience, there is not a single mention of net energy surplus in the EA reference document.

So over the last 30 years, New Zealand has doubled its renewable energy capacity, and at the same time increased its GHG emissions and reduced the overall efficiency of the national energy system.

And we are now planning to more than double our renewable energy system yet again over the next 30 years, even as zero-emissions electricity by 2035 is being debated elsewhere. We need to ask if this is a good idea.

How can we expand New Zealand’s solar PV and wind turbines without using fossil fuels? We can’t.

How could we expand our solar PV and wind turbines without mining rare minerals and the hidden costs of clean energy they entail, further contributing to ecological destruction and often increasing social injustices? We can't.

Even if we could construct, deliver, install and maintain solar PV and wind turbines without generating more GHG emissions and destroying ecosystems and poor communities, this “renewable” infrastructure would have to be replaced in a few decades. But there are at least two major problems with this assumed scenario.

The rare earth minerals required for this replacement will already be exhausted by the initial build out. Recycling will only provide a limited amount of replacements.

The other challenge is that a mostly “renewable” energy system will likely have a considerably lower net energy surplus. So where, in 2060, will the energy come from to either mine or recycle the raw materials, and to rebuild, reinstall and maintain the next iteration of a renewable energy system?

There is currently no plan for this replacement. It is a serious misnomer to call these energy technologies “renewable”. They are not as they rely on considerable raw material inputs and fossil energy for their production and never ending replacement.

New Zealand is, of course, blessed with an unusually high level of hydro electric and geothermal power. New Zealand currently uses over 170 GJ of total energy per capita, 40 percent of which is “renewable”. This provides approximately 70 GJ of “renewable” energy per capita with our current population.

This is the average global per capita energy level from all sources across all nations, as calls for 100% renewable energy globally emphasize. Several nations operate with roughly this amount of total energy per capita that New Zealand can generate just from “renewables”.

It is worth reflecting on the 170 GJ of total energy use we currently consume. Different studies give very different results regarding what levels are necessary for a good life.

For a complex industrial society such as ours, 100 GJ pc is said to be necessary for a high levels of wellbeing, determined both subjectively (life satisfaction/ happiness measures), and objectively (e.g. infant mortality levels, female morbidity as an index of population health, access to nutritious food and educational and health resources, etc). These studies do not take into account the large amount of energy that is wasted either through inefficient technologies, or frivolous use, which effective decarbonization strategies seek to reduce.

Other studies that consider the minimal energy needed for wellbeing suggest a much lower level of per capita energy consumption is required. These studies take a different approach and focus on ensuring basic wellbeing is maintained, but not necessarily with all the trappings of a complex industrial society. Their results indicate a level of approximately 20 GJ per capita is adequate.

In either case, we in New Zealand are wasting a lot of energy, both in terms of the efficiency of our technologies (see the Losses and Own Use info above), and also in our uses which do not contribute to wellbeing (think of the private vehicle travel that could be done by active or public transport – if we had good infrastructure in place).

We in New Zealand need a national dialogue about our future. And energy availability is only one aspect. We need to discuss what our carrying capacity is, what level of consumption is sustainable for our population, and whether we wish to make adjustments in either our per capita consumption or our population. Both together determine whether we are on the sustainable side of carrying capacity. Currently we are on the unsustainable side, meaning our way of life cannot endure. Not a good look for being a good ancestor.

The current trajectory of the Government and Electricity Authority appears to be grossly unsustainable. At the very least they should be able to answer the questions posed here about the GHG emissions from implementing a totally renewable energy system, the net energy of such a system, and the related environmental and social consequences.

Public dialogue is critical to collectively working out our future. Allowing the current profit-driven trajectory to unfold is a recipe for disasters for our children and grandchildren.

Being silent on these issues amounts to complicity in allowing short-term financial interests and an addiction to convenience jeopardise a genuinely secure and resilient future. Let’s get some answers from the Government and Electricity Authority to critical questions about energy security.


Related News

View more

Sign Up for Electricity Forum’s Newsletter

Stay informed with our FREE Newsletter — get the latest news, breakthrough technologies, and expert insights, delivered straight to your inbox.

Electricity Today T&D Magazine Subscribe for FREE

Stay informed with the latest T&D policies and technologies.
  • Timely insights from industry experts
  • Practical solutions T&D engineers
  • Free access to every issue

Live Online & In-person Group Training

Advantages To Instructor-Led Training – Instructor-Led Course, Customized Training, Multiple Locations, Economical, CEU Credits, Course Discounts.

Request For Quotation

Whether you would prefer Live Online or In-Person instruction, our electrical training courses can be tailored to meet your company's specific requirements and delivered to your employees in one location or at various locations.