EU share of electric cars grew during virus lockdown months


EU electric cars

Protective Relay Training - Basic

Our customized live online or in‑person group training can be delivered to your staff at your location.

  • Live Online
  • 12 hours Instructor-led
  • Group Training Available
Regular Price:
$699
Coupon Price:
$599
Reserve Your Seat Today

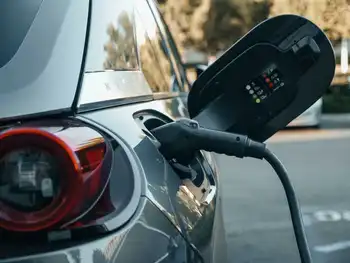
European Electric Car Market Share rose as EV adoption accelerated during lockdowns, driven by CO2 emissions limits, subsidies, battery-electric and plug-in hybrids, fast-charging networks, and launches like Volkswagen ID.3, despite overall auto sales plunging.


Key Points

European Electric Car Market Share is the EV share of auto sales, showing policy, price, and charging network impacts.

✅ Driven by CO2 limits, subsidies, and falling battery costs

✅ Includes battery-electric and plug-in hybrid registrations

✅ Gains despite pandemic slump in diesel and gasoline sales


The market share of electric cars in Europe increased during and immediately after the worst of the pandemic lockdowns, industry figures showed Thursday, even as overall sales of vehicles of all types plunged during the second quarter. The new figures come as automakers ramp up electric car production, suggesting the age of electric cars is arriving ahead of schedule, under pressure to meet tough new emissions limits next year.

The share of chargeable cars rose to 7.2% per cent in the April-June quarter from 6.8% in the first quarter, according to figures from the European Automobile Manufacturers Association, while the global market went from zero to 2 million in five years. The figures include both battery-only vehicles and plug-in hybrids, which combine a battery that can be charged from a wall plug with an internal combustion engine, to extend range.

Chargeable vehicles sales fell, to 129,000 from 167,000, but the overall car market shrank even more, by more than 50 per cent for both diesel and gasoline-engine cars. The April-June quarter included the worst of the lockdowns that limited movements and gatherings.

Market share is important because carmakers will be judged by their fleet average under tough new limits on carbon dioxide emissions that come fully into force next year. The new limits, aimed at combating global warming, mean that carmakers must make and sell more low-emission cars, amid concerns that an EV slump in Europe could jeopardize climate goals. Carbon dioxide is the main greenhouse gas blamed by scientists for global warming.

The second half of the year will see Europe's largest carmaker, Volkswagen, launch sales of its battery-only ID.3, intended as a mass-market electric option starting at less than 30,000 euros ($35,500). Uptake of electric cars had been slow until this year due to concerns about range, places to charge and higher prices, but forecasts suggest that within a decade many drivers will be in electric vehicles. Battery prices have been falling, however, and a carmaker consortium is building a network of highway fast-charging stations. Governments have also increased subsidies for electric vehicle sales as part of economic stimulus programs aimed at cushioning the pandemic recession.

Uptake of electrics has been heavily tilted toward the 27-country EU's wealthier western members, with France recently hitting record market share levels. For instance, there were 8,137 chargeable vehicles registered in the Netherlands in the second quarter compared to 328 in Romania.

The share of sales that went to diesel cars fell to 29.4% from 31.3% in the same period a year ago. Diesel sales have plummeted in the wake of Volkswagen's 2015 scandal over diesel cars manipulated to cheat on emissions standards in the United States.

Lucien Mathieu, e-mobility analyst with environmental lobby Transport & Environment, said that “despite the pandemic, electric car sales are growing at an unprecedented rate" and that electric vehicles and hybrids are taking market share from diesel and gasoline models, which emit greenhouse gases and pollutants that harm people's health. “2020 is the year of the electric car in Europe,” he said.

The U.S., with cheap gasoline and a federal government that wants to roll back fuel economy requirements, is moving more slowly in adopting electric vehicles, even as EV sales soar into 2024 and market share dips in Q1 2024. In China, a reduction in subsidies led to a slowdown in electric sales late last year, but the government is moving ahead with requirements for more low-emission vehicles over the long term.

Related News

U.S. Electric Vehicle Sales Soar Into 2024

U.S. EV Sales Growth reflects rising consumer demand, expanding market share, new tax credits, and robust charging infrastructure, as automakers boost output and quarterly sales under the Inflation Reduction Act drive adoption across states.


Key Points

It is the rise in U.S. EV sales and market share, driven by incentives, charging growth, and automaker investment.

✅ Quarterly EV sales and share have risen since Q3 2021.

✅ Share topped 10% in Q3 2023, with states far above.

✅ IRA credits and chargers lower costs and boost adoption.


Contrary to any skepticism, the demand for electric vehicles (EVs) in the United States is not dwindling. Data from the Alliance for Automotive Innovation highlights a significant and ongoing increase in EV sales from 2021 through the third quarter of 2023. An upward trend in quarterly sales (depicted as bars on the left axis) and EV sales shares (illustrated by the red line on the right axis) is evident. Sales surged from about 125,000 in Q1 2021 to 185,000 in Q4 2021, and from around 300,000 in Q1 2023 to 375,000 by Q3 2023. Notably, by Q3 2023, annual U.S. EV sales exceeded 1 million for the first time, a milestone often cited as the tipping point for mass adoption in the U.S., marking a 58% increase over the same period in 2022.

EV sales have shown consistent quarterly growth since Q3 2021, and the proportion of EVs in total light-duty vehicle sales is also on the rise. EVs’ share of new sales increased from roughly 3% in Q1 2021 to about 7% in 2022, and further to over 10% in Q3 2023, though they are still behind gas cars in overall market share, for now. For context, according to the U.S. Environmental Protection Agency’s Automotive Trends Report, EVs have reached a 10% market share more quickly than conventional hybrids without a plug, which took about 25 years.

State-level data also indicates that several states exceed national averages in EV sales. California, for example, saw EVs comprising nearly 27% of sales through September 2023, even as a brief Q1 2024 market share dip has been noted nationally. Additionally, 12 states plus the District of Columbia had EV sales shares between 10% and 20% through Q3 2023.

EV sales data by automaker reveal that most companies sold more EVs in Q2 or Q3 2023 than in any previous quarter, mirroring global growth that went from zero to 2 million in five years. Except for Ford, each automaker sold more EVs in the first three quarters of 2023 than in all of 2022. EV sales in Q3 2023 notably increased compared to Q3 2022 for companies like BMW, Tesla, and Volkswagen.

Despite some production scalebacks by Ford and General Motors, these companies, along with others, remain dedicated to an electric future and expect to sell more EVs than ever. The growing consumer interest in EVs is also reflected in recent surveys by McKinsey, J.D. Power, and Consumer Reports, and echoed in Europe where the share of electric cars grew during lockdown months, showing an increasing intent to purchase EVs and a declining interest in gasoline vehicles.

Furthermore, the Inflation Reduction Act of 2022 introduces new tax credits, potentially making EVs more affordable than gasoline counterparts. Investments in charging infrastructure are also expected to increase, especially as EV adoption could drive a 38% rise in U.S. electricity demand, with over $21 billion allocated to boost public chargers from around 160,000 in 2023 to nearly 1 million by 2030.

The shift to EVs is crucial for reducing climate pollution, enhancing public health, and generating economic benefits and jobs, and by 2021 plug-in vehicles had already traveled 19 billion miles on electricity, underscoring real-world progress toward these goals. The current data and trends indicate a robust and positive future for EVs in the U.S., reinforcing the need for strong standards to further encourage investment and consumer confidence in electric vehicles.


Related News

View more

US Moving Towards 30% Electricity From Wind & Solar

US Wind and Solar Outlook 2026 projects cheap renewables displacing coal and gas, with utility-scale additions, rooftop solar growth, improved grid reliability, and EV V2G integration accelerating decarbonization across the electricity market.


Key Points

An analysis forecasting wind and solar growth, displacing coal and gas as utility-scale and rooftop solar expand.

✅ Utility-scale solar installs avg 21 GW/yr through 2026.

✅ 37.7 GW wind in pipeline; 127.8 GW already online.

✅ Small-scale solar could near 100 TWh in 2026.


A recent report from the Institute for Energy Economics and Financial Analysis (IEEFA) predicts that cheap renewables in the form of wind and solar will push coal and gas out of the energy market space. Already at 9% of US generation, the report predicts that wind and solar will supply almost 30% of US electricity demand by 2026, consistent with renewables nearing one-fourth of U.S. generation projections for the near term.

“The Solar Energy Industries Association now expects utility-scale installations to average more than 21,000MW a year through 2026, following a year when U.S. solar generation rose 25% and with a peak of 25,000MW in 2023,” IEEFA writes. “Continued growth is also expected in U.S. wind generation, mirroring global trends where China's solar PV expansion outpaced all other fuels in 2016, with 37.7GW of new capacity already under construction or in advanced development, which would be added to 127.8GW in existing installed capacity.”

Meanwhile, with wind and solar growth booming, fossil fuels are declining, as renewables surpassed coal in 2022 nationwide. “Coal and natural gas are now locked into an essentially zero-sum game where increases in one fuel’s generation comes at the expense of the other. Together, they are not gaining market share, rather they are trading it back and forth, and the rapid growth in renewable generation will cut even deeper into the market share of both.”

And what of rooftop solar? Some states in Australia now have periods where the entire state grid is powered just by solar on the roofs of private citizens. As this revolution progresses in the USA, especially if a tenfold national solar push moves forward, what impact will it make on fossil fuel generators — which are expensive to build, expensive to maintain, expensive to fuel, and rely on an expensive distribution network.

“EIA estimates that this ‘small-scale solar’ produced 41.7 million MWh of power in 2020, when solar accounted for about 3% of U.S. electricity, a 19 percent increase from 2019. This growth will likely continue in the years ahead as costs continue to fall and concerns about grid reliability rise. Assuming a conservative 15 percent annual increase in small-scale solar going forward would push the sector’s generation to almost 100 million MWh in 2026.”

The Joker in the story might be the impact from electric vehicle adoption. Sales are set to surge and there’s more and more interest in V2G technology, even as wind and solar could provide 50% by 2050 in broader forecasts.


Related News

View more

Biden's Climate Law Is Working, and Not Working

Inflation Reduction Act Clean Energy drives EV adoption and renewable power, but grid interconnection, permitting, and supply chain bottlenecks slow wind, solar, and offshore projects, risking emissions targets despite domestic manufacturing growth and tax incentives.


Key Points

An IRA push to scale EVs and renewables, meeting EV goals but lagging wind and solar amid grid and permitting delays.

✅ EV sales up 50%, 9.2% of 2023 new cars; growth may moderate.

✅ 32.3 GW added, below 46-79 GW/year needed for climate targets.

✅ Grid, permitting, and supply chain delays bottleneck wind and solar.


A year and a half following President Biden's enactment of an ambitious climate change bill, the landscape of the United States' clean energy transition, shaped by 2021 electricity lessons, presents a mix of successes and challenges. A recent study by a consortium of research organizations highlights that while electric vehicle (EV) sales have surged, aligning with the law's projections, the expansion of renewable energy sources like wind and solar has encountered significant hurdles.

The legislation, known as the Inflation Reduction Act, aimed for a dual thrust in America's climate strategy: boosting EV adoption, alongside EPA emission limits, and significantly increasing the generation of electricity from renewable resources. The Act, passed in 2022, was anticipated to propel the United States toward reducing its greenhouse gas emissions by approximately 40 percent from 2005 levels by the end of this decade, backed by extensive financial incentives for clean energy advancements.

Electric vehicle sales have indeed seen a remarkable uptick, with a more than 50 percent increase over the past year, as EV sales surge into 2024 across the market, culminating in EVs comprising 9.2 percent of all new car sales in the United States in 2023. This growth trajectory met the upper range of analysts' predictions post-law enactment, signaling a strong start toward achieving the Act's emission reduction targets.

However, the EV market faces uncertainties regarding the sustainability of this rapid growth. The initial surge in sales was largely driven by early adopters, and the market now confronts challenges such as high prices and limited charging infrastructure, while EVs still trail gas cars in overall market share. Despite these concerns, projections suggest that even a slowdown to 30-40 percent growth in EV sales for 2024 would align with the law's emission goals.

The renewable energy sector's progress is less straightforward. Despite achieving a record addition of 32.3 gigawatts of clean electricity capacity in the past year, the pace falls short of the projected 46 to 79 gigawatts needed annually to meet the United States' climate objectives. While there is potential for about 60 gigawatts of projects in the pipeline for this year, not all are expected to materialize on schedule, indicating a lag in the deployment of new renewable energy sources.

Logistical challenges are a significant barrier to scaling up renewable energy, especially as EV-driven electricity demand rises in the coming years. Lengthy grid connection processes, permitting delays, and local opposition hinder wind and solar project developments. Moreover, ambitious plans for offshore wind farms are hampered by supply chain issues and regulatory constraints.

To achieve the Inflation Reduction Act's ambitious targets, the United States needs to add 70 to 126 gigawatts of renewable capacity annually from 2025 to 2030—a formidable task given the current logistical and regulatory bottlenecks. The analysis underscores the urgency of addressing these non-cost barriers to unlock the full potential of the law's clean energy and emissions reduction ambitions.

In addition to promoting clean energy generation and EV adoption, the Inflation Reduction Act has spurred domestic manufacturing of clean energy technologies. With $44 billion invested in U.S. clean-energy manufacturing last year, this aspect of the law has seen considerable success, and permanent clean energy tax credits are being debated to sustain momentum, demonstrating the Act's capacity to drive economic and industrial transformation.

The law's impact extends to emerging clean energy technologies, offering tax incentives for advanced nuclear reactors, renewable hydrogen production, and carbon capture and storage projects. While these initiatives hold promise for further emissions reductions, their development and deployment are still in the early stages, with tangible outcomes expected in the longer term.

While the Inflation Reduction Act has catalyzed significant strides in certain areas of the United States' clean energy transition, including an EV inflection point in adoption trends, it faces substantial hurdles in fully realizing its objectives. Overcoming logistical, regulatory, and market challenges will be crucial for the nation to stay on course toward its ambitious climate goals, underscoring the need for continued innovation, investment, and policy refinement in the journey toward a sustainable energy future.


Related News

View more

Solar Is Now 33% Cheaper Than Gas Power in US, Guggenheim Says

US Renewable Energy Cost Advantage signals cheaper utility-scale solar and onshore wind versus natural gas, with LCOE declines, tax credits, and climate policy cutting electricity costs for utilities and grids across the United States.


Key Points

Cheaper solar and wind than natural gas, driven by LCOE drops, tax credits, and policy, lowering US electricity costs.

✅ Utility-scale solar is about one-third cheaper than gas

✅ Onshore wind costs roughly 44 percent less than natural gas

✅ Policy and tax credits accelerate renewables and cut power prices


Natural gas’s dominance as power-plant fuel in the US is fading fast as the cost of electricity generated by US wind and solar projects tumbles and as wind and solar surpass coal in the generation mix, according to Guggenheim Securities.

Utility-scale solar is now about a third cheaper than gas-fired power, while onshore wind is about 44% less expensive, Guggenheim analysts led by Shahriar Pourreza said Monday in a note to clients, a dynamic consistent with falling wholesale power prices in several markets today. 

“Solar and wind now present a deflationary opportunity for electric supply costs,” the analysts said, which “supports the case for economic deployment of renewables across the US,” as the country moves toward 30% wind and solar and one-fourth of total generation in the near term.

Gas prices have surged amid a global supply crunch after Russia’s invasion of Ukraine, while tax-credit extensions and sweeping US climate legislation have brought down the cost of wind and solar, even as renewables surpassed coal in 2022 nationwide. Renewables-heavy utilities like NextEra Energy Inc. and Allete Inc. stand to benefit, and companies that can boost spending on wind and solar, as wind, solar and batteries dominate the 2023 pipeline, will also see faster growth, Guggenheim said.


Related News

View more

Canadian climate policy and its implications for electricity grids

Canada Electricity Decarbonization Costs indicate challenging greenhouse gas reductions across a fragmented grid, with wind, solar, nuclear, and natural gas tradeoffs, significant GDP impacts, and Net Zero targets constrained by intermittency and limited interties.


Key Points

Costs to cut power CO2 via wind, solar, gas, and nuclear, considering grid limits, intermittency, and GDP impacts.

✅ Alberta model: eliminate coal; add wind, solar, gas; 26-40% CO2 cuts

✅ Nuclear option enables >75% cuts at higher but feasible system costs

✅ National costs 1-2% GDP; reserves, transmission, land, and waste not included


Along with many western developed countries, Canada has pledged to reduce its greenhouse gas emissions by 40–45 percent by 2030 from 2005 emissions levels, and to achieve net-zero emissions by 2050.

This is a huge challenge that, when considered on a global scale, will do little to stop climate change because emissions by developing countries are rising faster than emissions are being reduced in developed countries. Even so, the potential for achieving emissions reduction targets is extremely challenging as there are questions as to how and whether targets can be met and at what cost. Because electricity can be produced from any source of energy, including wind, solar, geothermal, tidal, and any combustible material, climate change policies have focused especially on nations’ electricity grids, and in Canada cleaning up electricity is viewed as critical to meeting climate pledges.

Canada’s electricity grid consists of ten separate provincial grids that are weakly connected by transmission interties to adjacent grids and, in some cases, to electricity systems in the United States. At times, these interties are helpful in addressing small imbalances between electricity supply and demand so as to prevent brownouts or even blackouts, and are a source of export revenue for provinces that have abundant hydroelectricity, such as British Columbia, Manitoba, and Quebec.

Due to generally low intertie capacities between provinces, electricity trade is generally a very small proportion of total generation, though electricity has been a national climate success in recent years. Essentially, provincial grids are stand alone, generating electricity to meet domestic demand (known as load) from the lowest cost local resources.

Because climate change policies have focused on electricity (viz., wind and solar energy, electric vehicles), and Canada will need more electricity to hit net-zero according to the IEA, this study employs information from the Alberta electricity system to provide an estimate of the possible costs of reducing national CO2 emissions related to power generation. The Alberta system serves as an excellent case study for examining the potential for eliminating fossil-fuel generation because of its large coal fleet, favourable solar irradiance, exceptional wind regimes, and potential for utilizing BC’s reservoirs for storage.

Using a model of the Alberta electricity system, we find that it is infeasible to rely solely on renewable sources of energy for 100 percent of power generation—the costs are prohibitive. Under perfect conditions, however, CO2 emissions from the Alberta grid can be reduced by 26 to 40 percent by eliminating coal and replacing it with renewable energy such as wind and solar, and gas, but by more than 75 percent if nuclear power is permitted. The associated costs are estimated to be some $1.4 billion per year to reduce emissions by at most 40 percent, or $1.9 billion annually to reduce emissions by 75 percent or more using nuclear power (an option not considered feasible at this time).

Based on cost estimates from Alberta, and Ontario’s experience with subsidies to renewable energy, and warnings that the switch from fossil fuels to electricity could cost about $1.4 trillion, the costs of relying on changes to electricity generation (essentially eliminating coal and replacing it with renewable energy sources and gas) to reduce national CO2 emissions by about 7.4 percent range from some $16.8 to $33.7 billion annually. This constitutes some 1–2 percent of Canada’s GDP.

The national estimates provided here are conservative, however. They are based on removing coal-fired power from power grids throughout Canada. We could not account for scenarios where the scale of intermittency turned out worse than indicated in our dataset—available wind and solar energy might be lower than indicated by the available data. To take this into account, a reserve market is required, but the costs of operating such a capacity market were not included in the estimates provided in this study. Also ignored are the costs associated with the value of land in other alternative uses, the need for added transmission lines, environmental and human health costs, and the life-cycle costs of using intermittent renewable sources of energy, including costs related to the disposal of hazardous wastes from solar panels and wind turbines.


Related News

View more

Spain Breaks Gas Link with Wind and Solar

Spain has broken its reliance on fossil gas as soaring wind and solar energy drive Europe’s lowest wholesale electricity prices, reducing emissions, stabilizing the grid, and advancing renewable power, energy independence, and clean transition goals across the EU.


How Has Spain Broken the Gas Link with Wind and Solar??

Spain has broken the link between gas and power prices by rapidly expanding wind and solar generation, which now supplies nearly half its electricity, cutting fossil fuel influence by 75% since 2019 and reducing power costs 32% below the EU average.

✅ Wind and solar cut fossil influence by 75% since 2019

✅ Power prices 32% below EU average in 2025

✅ Renewables meet nearly half of national electricity demand


Spain has emerged as one of Europe’s most affordable electricity markets, largely due to its rapid expansion of wind and solar power. By decoupling its wholesale electricity prices from volatile fossil gas and coal, Spain has achieved a 32 percent lower average wholesale price than the EU average in the first half of 2025. This remarkable shift marks a dramatic turnaround from 2019, when Spain had some of the highest power prices in Europe.

According to new data, the influence of fossil fuels on Spain’s electricity prices has fallen by 75 percent since 2019, mirroring how renewables have surpassed fossil fuels in Europe over the same period, dropping from 75 percent of hours tied to gas costs to just 19 percent in early 2025. “Spain has broken the ruinous link between power prices and volatile fossil fuels, something its European neighbours are desperate to do,” said Dr. Chris Rosslowe, Senior Energy Analyst at Ember.

The change is driven by a surge in renewable generation. Between 2019 and mid-2025, Spain added more than 40 gigawatts of new solar and wind capacity—second only to Germany, whose power market is twice the size. Wind and solar now meet nearly half (46 percent) of Spain’s electricity demand, compared with 27 percent six years ago. As a result, fossil generation has fallen to 20 percent of total demand, well below the levels seen in other major economies such as Germany (41 percent) and Italy (43 percent).

This renewable growth has also cut Spain’s dependence on imported fuels. In the past five years, new solar and wind plants have avoided 26 billion cubic metres of gas imports, saving €13.5 billion—five times the amount the country invested in transmission infrastructure over the same period. The Central Bank of Spain estimated that wholesale electricity prices would have been 40 percent higher in 2024 if renewables had not displaced fossil generation, and neighboring France has seen negative prices during periods of renewable surplus.

August 2025 marked a historic milestone: Spain recorded a full month without coal-fired generation for the first time. A decade earlier, coal accounted for a quarter of the nation’s electricity supply. Gas use has also declined steadily, from 26% of demand in 2019 to 19% this year.

However, the system still faces challenges. Following the April 28th Iberian blackout, Spain has relied more heavily on gas-fired plants to stabilize the grid. These services—such as voltage control and balancing—have proven to be expensive, with costs doubling since the blackout and accounting for 57 percent of the average electricity price in May 2025, up from 14 percent the previous year. Curtailment of renewables has also tripled, reaching 7.2 percent of generation between May and July.

Despite being Europe’s fourth-largest electricity market, Spain ranks only 13th in battery storage capacity, underscoring the need for further investment in clean flexibility solutions, such as grid-scale batteries to provide flexibility and stronger interconnections. Post-blackout reforms aim to address this weakness and ensure the gains from renewable integration are not lost.

“Spain risks sliding back into costly gas reliance amid post-blackout fears,” warned Rosslowe. “Boosting grids and batteries will help Spain break free from fossil dependency for good.”

With record-low electricity prices and one of the fastest decoupling rates in Europe, Spain’s experience demonstrates how large-scale wind and solar adoption can reshape energy economics—and offers a roadmap for other nations seeking to escape the volatility of fossil fuels.

View more

Sign Up for Electricity Forum’s Newsletter

Stay informed with our FREE Newsletter — get the latest news, breakthrough technologies, and expert insights, delivered straight to your inbox.

Electricity Today T&D Magazine Subscribe for FREE

Stay informed with the latest T&D policies and technologies.
  • Timely insights from industry experts
  • Practical solutions T&D engineers
  • Free access to every issue

Live Online & In-person Group Training

Advantages To Instructor-Led Training – Instructor-Led Course, Customized Training, Multiple Locations, Economical, CEU Credits, Course Discounts.

Request For Quotation

Whether you would prefer Live Online or In-Person instruction, our electrical training courses can be tailored to meet your company's specific requirements and delivered to your employees in one location or at various locations.