UK Offshore Wind Expansion will make wind the main power source, driving renewable energy, offshore projects, smart grids, battery storage, and interconnectors to cut carbon emissions, boost exports, and attract global investment.
Key Points
A UK strategy to scale offshore wind, integrate smart grids and storage, cut emissions and drive investment and exports
✅ 30% energy target by 2030, backed by CfD support
✅ 250m industry investment and smart grid build-out
✅ Battery storage and interconnectors balance intermittency
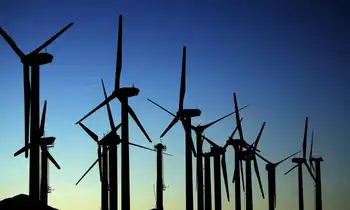
Plans are afoot to make wind the UKs main power source for the first time in history amid ambitious targets to generate 30 percent of its total energy supply by 2030, up from 8 percent at present.
A recently inked deal will see the offshore wind industry invest 250 million into technology and infrastructure over the next 11 years, with the government committing up to 557 million in support, under a renewable energy auction that boosts wind and tidal projects, as part of its bid to lower carbon emissions to 80 percent of 1990 levels by 2050.
Offshore wind investment is crucial for meeting decarbonisation targets while increasing energy production, says Dominic Szanto, Director, Energy and Infrastructure at JLL. The governments approach over the last seven years has been to promise support to the industry, provided that cost reduction targets were met. This certainty has led to the development of larger, more efficient wind turbines which means the cost of offshore wind energy is a third of what it was in 2012.
Boosting the wind industry
Offshore wind power has been gathering pace in the UK and has grown despite COVID-19 disruptions in recent years. Earlier this year, the Hornsea One wind farm, the worlds largest offshore generator which is located off the Yorkshire coast, started producing electricity. When fully operational in 2020, the project will supply energy to over a million homes, and a further two phases are planned over the coming decade.
Over 10 gigawatts of offshore wind either already has government support or is eligible to apply for it in the near future, following a 10 GW contract award that underscores momentum, representing over 30 billion of likely investment opportunities.
Capital is coming from European utility firms and increasingly from Asian strategic investors looking to learn from the UKs experience. The attractive government support mechanism means banks are keen to lend into the sector, says Szanto.
New investment in the UKs offshore wind sector will also help to counter the growing influence of China. The UK is currently the worlds largest offshore wind market, but by 2021 it will be outstripped by China.
Through its new deal, the government hopes to increase wind power exports fivefold to 2.6 billion per year by 2030, with the UKs manufacturing and engineering skills driving projects in growth markets in Europe and Asia and in developing countries supported by the World Bank support through financing and advisory programs.
Over the next two decades, theres a massive opportunity for the UK to maintain its industry leading position by designing, constructing, operating and financing offshore wind projects, says Szanto. Building on projects such as the Hywind project in Scotland, it could become a major export to countries like the USA and Japan, where U.S. lessons from the U.K. are informing policy and coastal waters are much deeper.
Wind-powered smart grids
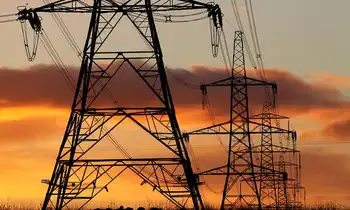
As wind power becomes a major contributor to the UKs energy supply, which will be increasingly made up of renewable sources in coming decades, there are key infrastructure challenges to overcome.
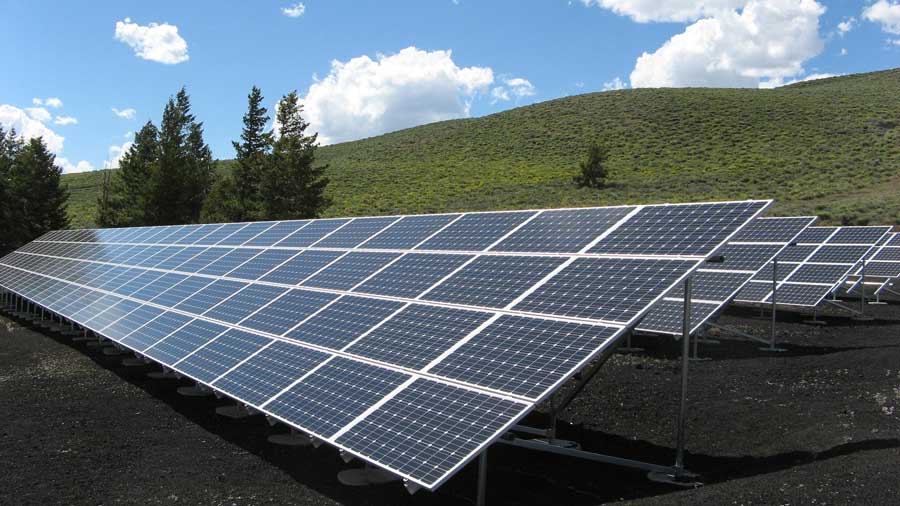
A real challenge is that the UKs power generation is becoming far more decentralised, with smaller power stations such as onshore wind farms and solar parks and more prosumers residential houses with rooftop solar coupled with a significant rise in intermittent generation, says Szanto. The grid was never designed to manage energy use like that.
One potential part of the solution is to use offshore wind farms in other sites in European waters.
By developing connections between wind projects from neighbouring countries, it will create super-grids that will help mitigate intermittency issues, says Szanto.
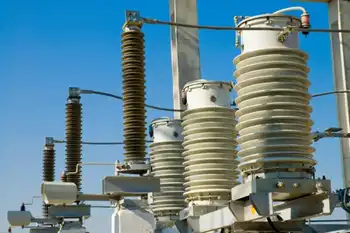
More advanced energy storage batteries will also be key for when less energy is generated on still days. There is a growing need for batteries that can store large amounts of energy and smart technology to discharge that energy. Were going through a revolution where new technology companies are working to enable a much smarter grid.
Future smart grids, based on developing technology such as blockchain, might enable the direct trading of energy between generators and consumers, with algorithms that can manage many localised sources and, critically, ensure a smooth power supply.
Investors seeking a higher-yield market are increasingly turning to battery technology, Szanto says. In a future smart grid, for example, batteries could store electricity bought cheaply at low-usage times then sold at peak usage prices or be used to provide backup energy services to other companies.
Majors investing in the transition
Its not just new energy technology companies driving change; established oil and gas companies are accelerating spending on renewable energy. Shell has committed to $1-2 billion per year on clean energy technologies out of a $25-30 billion budget, while Equinor plans to spend 15-20 percent of its budget on renewables by 2030.
The oil and gas majors have the global footprint to deliver offshore wind projects in every country, says Szanto. This could also create co-investment opportunities for other investors in the sector especially as nascent wind markets such as the U.S., where the U.S. offshore wind timeline is still developing, and Japan evolve.
European energy giants, for example, have bid to build New Yorks first offshore wind project.
As offshore wind becomes a globalised sector, with a trillion-dollar market outlook emerging, the major fuel companies will have increasingly large roles. They have the resources to undertake the years-long, cost-intensive developments of wind projects, driven by a need for new business models as the world looks beyond carbon-based fuels, says Szanto.
Oil and gas heavyweights are also making wind, solar and energy storage acquisitions BP acquired solar developer Lightsource and car-charging network Chargemaster, while Shell spent $400 million on solar and battery companies.
The public perception is that renewable energy is niche, but its now a mainstream form of energy generation., concludes Szanto.
Every nation in the world is aligned in wanting a decarbonised future. In terms of electricity, that means renewable energy and for offshore wind energy, the outlook is extremely positive.
Related News