Wheatland couple turns to wind for electrical needs

By Appeal-Democrat


NFPA 70e Training

Our customized live online or in‑person group training can be delivered to your staff at your location.

  • Live Online
  • 6 hours Instructor-led
  • Group Training Available
Regular Price:
$199
Coupon Price:
$149
Reserve Your Seat Today
Two miles west of Wheatland on Spenceville Road, among the rolling hills leading to the Sierra Nevada, a 60-foot tall wind turbine peaks over the horizon.

The owners of the steel pole with a white propellor, Perrie and Janice Costa, said the wind power generated from the turbine will eliminate their electric bill and, they hope, power two electric cars.

"I love windy days, " Perrie Costa said, gleefully pointing to the turbine.

After years of discussion and research, the Costas decided to invest in the alternative energy source six months ago.

Their location is ideal, said Scott Jackson, president of Powershacks, Inc., an alternative energy company out of Chico. He said the 5 acres of land they live on is located in a class-two wind area, which means they get an average wind of 11 mph.

Jackson said most residential wind turbines would begin generating power at 8 or 9 mph, but the new model installed at the Costas' home will turn at 3 mph.

"When others are just getting started, this turbine will be generating half the power it's capable of," Jackson said. The turbine is manufactured by ReDriven, a company in Ontario, Canada.

Because of the capacity to generate 20 kilowatts of electricity, Perrie Costa said they went with a larger turbine to be sure there is enough power for their home, and when they purchase electric cars.

"It's my gas station," he said with a smile.

Though they are guinea pigs for this turbine — Jackson said only one other turbine of its kind was located in the United States before this one was installed — the Costas said they are still deciding on the type of electric car to purchase because the technology has not been fully developed, yet.

The Costas said they are spending $600 a month on gas alone, which is why they'd like to buy an electric car. Perrie and Janice commute to work in Roseville and Marysville, respectively.

If the price of gas continues to drop, though, Perrie Costa said they will purchase one electric vehicle instead of two.

They estimate their electricity bill to range between $200 and $300 each month. Gas and electric bills will both be eliminated as a result of the turbine, the Costas said.

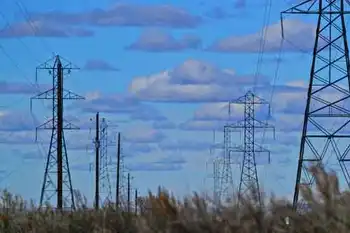
Unused power from the turbine will go to PG&E. The couple chose a state rebate program that enourages alternative energy uses. The Costas, who will get $37,000 from the state, could have entered into a 20-year contract to sell the extra power to the utility company.

The couple also said they considered a combination of solar and wind, but found the turbine to be a better investment.

From purchase to installation, it took the Costas roughly six months to get the wind turbine functioning. Power to the turbine was officially hooked up October 27. They plan to hold a special opening ceremony Wednesday to mark the occasion.

While the Costas are a success story as one of the first residential turbines in Yuba County, 30 miles to the north, Roger Austin has been waiting more than a year to cut his power bill by 75 percent with a slightly smaller turbine.

Austin's project has been stalled since he found out the conditional use permit necessary for the 5-kilowatt turbine would cost $5,000.

The Costas, who happened to be located in a different planning zone than Austin, paid just $500 for their tower.

"It's the same county," Jackson said. "It doesn't make sense."

Jackson said the Costas are in agricultural/rural residential zone, which does not require a special use permit. Austin, however, is located in a strictly agriculture zone, which does require the permit.

Perrie Costa said he was aware of the permit fees Austin faced, but the couple wanted to look into the energy alternative anyway.

"If it cost $5,000, we would've done it," Costa said.

Because of Austin's difficulties, Jackson said he was given permission by the Loma Rica man to resell his turbine.

"He was just running in so many circles," Jackson said.

Austin appealed to the Board of Supervisors twice to have the permit fees lowered, but his request was left unanswered.

"They got into a political arm wrestling match," Jackson said.

Yuba County planning department officials have said any changes to permit fees or zoning would require supervisors' approval.

Sitting in a chair against her blue barn, Janice Costa enjoyed the view she had of her new turbine.

"It is pretty amazing," she said. "I can hardly wait until the meter begins to say that we are delivering power to PG&E, rather than receiving it."

Related News

Emissions rise 2% in Australia amid increased pollution from electricity and transport

Australia's greenhouse gas emissions rose in Q2 as electricity and transport pollution increased, despite renewable energy growth. Net zero targets, carbon dioxide equivalent metrics, and land use changes underscore mixed trends in decarbonisation.


Key Points

About 499-500 Mt CO2-e annually, with a 2% quarterly rise led by electricity and transport.

✅ Q2 emissions rose to 127 Mt from 124.4 Mt seasonally adjusted

✅ Electricity sector up to 41.6 Mt; transport added nearly 1 Mt

✅ Land use remains a net sink; renewables expanded capacity


Australia’s greenhouse gas emissions rose in the June quarter by about 2% as pollution from the electricity sector and transport increased.

Figures released on Tuesday by the Morrison government showed that on a year to year basis, emissions for the 12 months to last June totalled 498.9m tonnes of carbon dioxide equivalent. That tally was down 2.1%, or 10.8m tonnes compared with the same period a year earlier.

However, on a seasonally adjusted quarterly basis, emissions increased to 127m tonnes, or just over 2%, from the 124.4m tonnes reported in the March quarter. For the year to March, emissions totalled 494.2m tonnes, underscoring the pickup in pollution in the more recent quarter even as global coal power declines worldwide.

A stable pollution rate, if not a rising one, is also implied by the government’s release of preliminary figures for the September quarter. They point to 125m tonnes of emissions in trend terms for the July-September months, bringing the year to September total to about 500m tonnes, the latest report said.

The government has made much of Australia “meeting and beating” climate targets. However, the latest statistics show mostly emissions are not in decline despite its pledge ahead of the Glasgow climate summit that the country would hit net zero by 2050, and AEMO says supply can remain uninterrupted as coal phases out over the next three decades.

“Nothing’s happening except for the electricity sector,” said Hugh Saddler, an honorary associate professor at the Australian National University. Once Covid curbs on the economy eased, such as during the current quarter, emission sources such as from transport will show a rise, he predicted.

Falling costs for new wind and solar farms, with the IEA naming solar the cheapest in history worldwide, are pushing coal and gas out of electricity generation, as well as pushing down power prices. In seasonally adjusted terms, though, emissions for that sector rose from 39.7m tonnes the March quarter to 41.6m in the June one.

Most other sectors were steady, with pollution from transport adding almost 1m tonnes in the June quarter.

On an annual basis, a 500m tonnes tally is the lowest since records began in the 1990s, and IEA reported global emissions flatlined in 2019 for context. That lower trajectory, though, is lower due much to the land sector remaining a net sink even as some experts raise questions about the true trends when it comes to land clearing.

According to the government, this sector – known as land use, land-use change and forestry – amounted to a net reduction of emissions of 24.4m tonnes, or almost negative 5% of the national total, in the year to June.

Sign up to receive an email with the top stories from Guardian Australia every morning

“The magnitude of this net sink has decreased by 0.6% (0.2 Mt CO2-e) on the previous 12 months due to an increase in emissions from agricultural soils, partially offset by a continuing decline in land clearing emissions,” the latest report said.

For its part, the government also touted the increase of renewable energy, as seen in Canada's electricity progress too, as central to driving emissions lower.

“Since 2017, Australia’s consumption of renewable energy has grown at a compound annual rate of 4.6%, with more than $40bn invested in Australia’s renewable energy sector,” Angus Taylor, the federal energy minister said, while UK net zero policy changes show a different approach. “Last year, Australia deployed new solar and wind at eight times the global per capita average.”

ANU’s Saddler said the main driver had been the 2020 Renewable Energy Target that the Coalition government had cut, and had anyway been implemented “a very considerable time ago”.

Tim Baxter, the Climate Council’s senior researcher, said “the time for leaning on the achievements of others is long since past”.

“We need a federal government willing to step up on emissions reductions and take charge with real policy, not wishlists,” he said, referring to the government’s net zero plan to rely on technologies to cut pollution in pursuit of a sustainable electric planet in practice, some of which don’t exist now.


Related News

View more

Hydroelectricity Under Pumped Storage Capacity

Pumped Storage Hydroelectricity balances renewable energy, stabilizes the grid, and provides large-scale energy storage using reservoirs and reversible turbines, delivering flexible peak power, frequency control, and rapid response to variable wind and solar generation.


Key Points

A reversible hydro system that stores energy by pumping water uphill, then generates flexible peak power.

✅ Balances variable wind and solar with rapid ramping

✅ Stores off-peak electricity in upper reservoirs

✅ Enhances grid stability, frequency control, and reserves


The expense of hydroelectricity is moderately low, making it a serious wellspring of sustainable power. The hydro station burns-through no water, dissimilar to coal or gas plants. The commonplace expense of power from a hydro station bigger than 10 megawatts is 3 to 5 US pennies for every kilowatt hour, and Niagara Falls powerhouse upgrade projects show how modernization can further improve efficiency and reliability. With a dam and supply it is likewise an adaptable wellspring of power, since the sum delivered by the station can be shifted up or down quickly (as meager as a couple of moments) to adjust to changing energy requests.

When a hydroelectric complex is developed, the task creates no immediate waste, and it for the most part has an extensively lower yield level of ozone harming substances than photovoltaic force plants and positively petroleum product fueled energy plants, with calls to invest in hydropower highlighting these benefits. In open-circle frameworks, unadulterated pumped storage plants store water in an upper repository with no normal inflows, while pump back plants use a blend of pumped storage and regular hydroelectric plants with an upper supply that is renewed to a limited extent by common inflows from a stream or waterway.

Plants that don't utilize pumped capacity are alluded to as ordinary hydroelectric plants, and initiatives focused on repowering existing dams continue to expand clean generation; regular hydroelectric plants that have critical capacity limit might have the option to assume a comparable function in the electrical lattice as pumped capacity by conceding yield until required.

The main use for pumped capacity has customarily been to adjust baseload powerplants, however may likewise be utilized to decrease the fluctuating yield of discontinuous fuel sources, while emerging gravity energy storage concepts broaden long-duration options. Pumped capacity gives a heap now and again of high power yield and low power interest, empowering extra framework top limit.

In specific wards, power costs might be near zero or once in a while negative on events that there is more electrical age accessible than there is load accessible to retain it; despite the fact that at present this is infrequently because of wind or sunlight based force alone, expanded breeze and sun oriented age will improve the probability of such events.

All things considered, pumped capacity will turn out to be particularly significant as an equilibrium for exceptionally huge scope photovoltaic age. Increased long-distance bandwidth, including hydropower imports from Canada, joined with huge measures of energy stockpiling will be a critical piece of directing any enormous scope sending of irregular inexhaustible force sources. The high non-firm inexhaustible power entrance in certain districts supplies 40% of yearly yield, however 60% might be reached before extra capaciy is fundamental.

Pumped capacity plants can work with seawater, despite the fact that there are extra difficulties contrasted with utilizing new water. Initiated in 1966, the 240 MW Rance flowing force station in France can incompletely function as a pumped storage station. At the point when elevated tides happen at off-top hours, the turbines can be utilized to pump more seawater into the repository than the elevated tide would have normally gotten. It is the main enormous scope power plant of its sort.

Alongside energy mechanism, pumped capacity frameworks help control electrical organization recurrence and give save age. Warm plants are substantially less ready to react to abrupt changes in electrical interest, and can see higher thermal PLF during periods of reduced hydro generation, conceivably causing recurrence and voltage precariousness.

Pumped storage plants, as other hydroelectric plants, including new BC generating stations, can react to stack changes in practically no time. Pumped capacity hydroelectricity permits energy from discontinuous sources, (for example, sunlight based, wind) and different renewables, or abundance power from consistent base-load sources, (for example, coal or atomic) to be put something aside for times of more popularity.

The repositories utilized with siphoned capacity are tiny when contrasted with ordinary hydroelectric dams of comparable force limit, and creating periods are regularly not exactly a large portion of a day. This technique produces power to gracefully high top requests by moving water between repositories at various heights.

Now and again of low electrical interest, the abundance age limit is utilized to pump water into the higher store. At the point when the interest gets more noteworthy, water is delivered once more into the lower repository through a turbine. Pumped capacity plans at present give the most monetarily significant methods for enormous scope matrix energy stockpiling and improve the every day limit factor of the age framework. Pumped capacity isn't a fuel source, and shows up as a negative number in postings.


Related News

View more

Vehicle-to-grid could be ‘capacity on wheels’ for electricity networks

Vehicle-to-Grid (V2G) enables EV batteries to provide grid balancing, flexibility, and demand response, integrating renewables with bidirectional charging, reducing peaker plant reliance, and unlocking distributed energy storage from millions of connected electric vehicles.


Key Points

Vehicle-to-Grid (V2G) lets EVs export power via bidirectional charging to balance grids and support renewables.

✅ Turns parked EVs into distributed energy storage assets

✅ Delivers balancing services and demand response to the grid

✅ Cuts peaker plant use and supports renewable integration


“There are already many Gigawatt-hours of batteries on wheels”, which could be used to provide balance and flexibility to electrical grids, if the “ultimate potential” of vehicle-to-grid (V2G) technology could be harnessed.

That’s according to a panel of experts and stakeholders convened by our sister site Current±, which covers the business models and technologies inherent to the low carbon transition to decentralised and clean energy. Focusing mainly on the UK grid but opening up the conversation to other territories and the technologies themselves, representatives including distribution network operator (DNO) Northern Powergrid’s policy and markets director and Nissan Europe’s director of energy services debated the challenges, benefits and that aforementioned ultimate potential.

Decarbonisation of energy systems and of transport go hand-in-hand amid grid challenges from rising EV uptake, with vehicle fuel currently responsible for more emissions than electricity used for energy elsewhere, as Ian Cameron, head of innovation at DNO UK Power Networks says in the Q&A article.

“Furthermore, V2G technology will further help decarbonisation by replacing polluting power plants that back up the electrical grid,” Marc Trahand from EV software company Nuvve Corporation added, pointing to California grid stability initiatives as a leading example.

While the panel states that there will still be a place for standalone utility-scale energy storage systems, various speakers highlighted that there are over 20GWh of so-called ‘batteries on wheels’ in the US, capable of powering buildings as needed, and up to 10 million EVs forecast for Britain’s roads by 2030.

“…it therefore doesn’t make sense to keep building expensive standalone battery farms when you have all this capacity on wheels that just needs to be plugged into bidirectional chargers,” Trahand said.


Related News

View more

Which of the cleaner states imports dirty electricity?

Hourly Electricity Emissions Tracking maps grid balancing areas, embodied emissions, and imports/exports, revealing carbon intensity shifts across PJM, ERCOT, and California ISO, and clarifying renewable energy versus coal impacts on health and climate.


Key Points

An hourly method tracing generation, flows, and embodied emissions to quantify carbon intensity across US balancing areas.

✅ Hourly traces of imports/exports and generation mix

✅ Consumption-based carbon intensity by balancing area

✅ Policy insights for renewables, coal, health costs


In the United States, electricity generation accounts for nearly 30% of our carbon emissions. Some states have responded to that by setting aggressive renewable energy standards; others are hoping to see coal propped up even as its economics get worse. Complicating matters further is the fact that many regional grids are integrated, and as America goes electric the stakes grow, meaning power generated in one location may be exported and used in a different state entirely.

Tracking these electricity exports is critical for understanding how to lower our national carbon emissions. In addition, power from a dirty source like coal has health and environment impacts where it's produced, and the costs of these aren't always paid by the parties using the electricity. Unfortunately, getting reliable figures on how electricity is produced and where it's used is challenging, even for consumers trying to find where their electricity comes from in the first place, leaving some of the best estimates with a time resolution of only a month.

Now, three Stanford researchers—Jacques A. de Chalendar, John Taggart, and Sally M. Benson—have greatly improved on that standard, and they have managed to track power generation and use on an hourly basis. The researchers found that, of the 66 grid balancing areas within the United States, only three have carbon emissions equivalent to our national average, and they have found that imports and exports of electricity have both seasonal and daily changes. de Chalendar et al. discovered that the net results can be substantial, with imported electricity increasing California's emissions/power by 20%.

Hour by hour
To figure out the US energy trading landscape, the researchers obtained 2016 data for grid features called balancing areas. The continental US has 66 of these, providing much better spatial resolution on the data than the larger grid subdivisions. This doesn't cover everything—several balancing areas in Canada and Mexico are tied in to the US grid—and some of these balancing areas are much larger than others. The PJM grid, serving Pennsylvania, New Jersey, and Maryland, for example, is more than twice as large as Texas' ERCOT, in a state that produces and consumes the most electricity in the US.

Despite these limitations, it's possible to get hourly figures on how much electricity was generated, what was used to produce it, and whether it was used locally or exported to another balancing area. Information on the generating sources allowed the researchers to attach an emissions figure to each unit of electricity produced. Coal, for example, produces double the emissions of natural gas, which in turn produces more than an order of magnitude more carbon dioxide than the manufacturing of solar, wind, or hydro facilities. These figures were turned into what the authors call "embodied emissions" that can be traced to where they're eventually used.

Similar figures were also generated for sulfur dioxide and nitrogen oxides. Released by the burning of fossil fuels, these can both influence the global climate and produce local health problems.

Huge variation
The results were striking. "The consumption-based carbon intensity of electricity varies by almost an order of magnitude across the different regions in the US electricity system," the authors conclude. The low is the Bonneville Power grid region, which is largely supplied by hydropower; it has typical emissions below 100kg of carbon dioxide per megawatt-hour. The highest emissions come in the Ohio Valley Electric region, where emissions clear 900kg/MW-hr. Only three regional grids match the overall grid emissions intensity, although that includes the very large PJM (where capacity auction payouts recently fell), ERCOT, and Southern Co balancing areas.

Most of the low-emissions power that's exported comes from the Pacific Northwest's abundant hydropower, while the Rocky Mountains area exports electricity with the highest associated emissions. That leads to some striking asymmetries. Local generation in the hydro-rich Idaho Power Company has embodied emissions of only 71kg/MW-hr, while its imports, coming primarily from Rocky Mountain states, have a carbon content of 625kg/MW-hr.

The reliance on hydropower also makes the asymmetry seasonal. Local generation is highest in the spring as snow melts, but imports become a larger source outside this time of year. As solar and wind can also have pronounced seasonal shifts, similar changes will likely be seen as these become larger contributors to many of these regional grids. Similar things occur daily, as both demand and solar production (and, to a lesser extent, wind) have distinct daily profiles.

The Golden State
California's CISO provides another instructive case. Imports represent less than 30% of its total electric use in 2016, yet California electricity imports provided 40% of its embodied emissions. Some of these, however, come internally from California, provided by the Los Angeles Department of Water and Power. The state itself, however, has only had limited tracking of imported emissions, lumping many of its sources as "other," and has been exporting its energy policies to Western states in ways that shape regional markets.

Overall, the 2016 inventory provides a narrow picture of the US grid, as plenty of trends are rapidly changing our country's emissions profile, including the rise of renewables and the widespread adoption of efficiency measures and other utility trends in 2017 that continue to evolve. The method developed here can, however, allow for annual updates, providing us with a much better picture of trends. That could be quite valuable to track things like how the rapid rise in solar power is altering the daily production of clean power.

More significantly, it provides a basis for more informed policymaking. States that wish to promote low-emissions power can use the information here to either alter the source of their imports or to encourage the sites where they're produced to adopt more renewable power. And those states that are exporting electricity produced primarily through fossil fuels could ensure that the locations where the power is used pay a price that includes the health costs of its production.


Related News

View more

Germany turns its back on nuclear for good despite Europe's energy crisis

Germany nuclear phase-out underscores a high-stakes energy transition, trading reactors for renewables, LNG imports, and grid resilience to secure supply, cut emissions, and navigate climate policy, public opinion shifts, and post-Ukraine supply shocks.


Key Points

Germany's nuclear phase-out retires reactors, shifting to renewables, LNG, and grid upgrades for low-carbon power.

✅ Last three reactors: Neckarwestheim, Isar 2, and Emsland closed

✅ Supply secured via LNG imports, renewables, and grid flexibility

✅ Policy accelerated post-Fukushima; debate renewed after Ukraine war


The German government is phasing out nuclear power despite the energy crisis. The country is pulling the plug on its last three reactors, betting it will succeed in its green transition without nuclear power.

On the banks of the Neckar River, not far from Stuttgart in south Germany, the white steam escaping from the nuclear power plant in Baden-Württemberg will soon be a memory.

The same applies further east for the Bavarian Isar 2 complex and the Emsland complex, at the other end of the country, not far from the Dutch border.

While many Western countries depend on nuclear power, Europe's largest economy is turning the page, even if a possible resurgence of nuclear energy is debated until the end.

Germany is implementing the decision to phase out nuclear power taken in 2002 and accelerated by Angela Merkel in 2011, after the Fukushima disaster.

Fukushima showed that "even in a high-tech country like Japan, the risks associated with nuclear energy cannot be controlled 100 per cent", the former chancellor justified at the time.

The announcement convinced public opinion in a country where the powerful anti-nuclear movement was initially fuelled by fears of a Cold War conflict, and then by accidents such as Chernobyl.

The invasion of Ukraine on 24 February 2022 brought everything into question. Deprived of Russian gas, the flow of which was essentially interrupted by Moscow, Germany found itself exposed to the worst possible scenarios, from the risk of its factories being shut down to the risk of being without heating in the middle of winter.

With just a few months to go before the initial deadline for closing the last three reactors on 31 December, the tide of public opinion began to turn, and talk of a U-turn on the nuclear phaseout grew louder. 

"With high energy prices and the burning issue of climate change, there were of course calls to extend the plants," says Jochen Winkler, mayor of Neckarwestheim, where the plant of the same name is in its final days.

Olaf Scholz's government, which the Green Party - the most hostile to nuclear power - is part of, finally decided to extend the operation of the reactors to secure the supply until 15 April.

"There might have been a new discussion if the winter had been more difficult if there had been power cuts and gas shortages nationwide. But we have had a winter without too many problems," thanks to the massive import of liquefied natural gas, notes Mr Winkler.


Related News

View more

Is Hydrogen The Future For Power Companies?

Hydrogen Energy Transition accelerates green hydrogen, electrolyzers, renewables, and fuel cells, as the EU and US scale decarbonization, NextEra tests hydrogen-to-power, and DOE funds pilots to replace natural gas and cut CO2.


Key Points

A shift to deploy green hydrogen tech to decarbonize power, industry, and transport across EU and US energy systems.

✅ EU targets 40 GW electrolyzers plus 40 GW imports by 2030

✅ DOE funds pilots; NextEra trials hydrogen-to-power at Okeechobee

✅ Aims to replace natural gas, enable fuel cells, cut CO2


Last month, the European Union set out a comprehensive hydrogen strategy as part of its goal to achieve carbon neutrality for all its industries by 2050. The EU has an ambitious target to build out at least 40 gigawatts of electrolyzers within its borders by 2030 and also support the development of another 40 gigawatts of green hydrogen in nearby countries that can export to the region by the same date. The announcement came as little surprise, given that Europe is regarded as being far ahead of the United States in the shift to renewable energy, even as it looks to catch up on fuel cells with Asian leaders today.

But the hydrogen bug has finally arrived stateside: The U.S. Department of Energy has unveiled the H2@Scale initiative whereby a handful of companies including Cummins Inc. (NYSE: CMI), Caterpillar Inc.(NYSE: CAT), 3M Company (NYSE: MMM), Plug Power Inc.(NASDAQ: PLUG) and EV startup Nikola Corp.(NASDAQ: NKLA), even as the industry faces threats to the EV boom that investors are watching, will receive $64 million in government funding for hydrogen research projects.

Hot on the heels of the DoE initiative: American electric utility and renewable energy giant, NextEra Energy Inc.(NYSE: NEE), has unveiled an equally ambitious plan to start replacing its natural gas-powered plants with hydrogen.

During its latest earnings call, NextEra’s CFO Rebecca Kujawa said the company is “…particularly excited about the long-term potential of hydrogen” and discussed plans to start a pilot hydrogen project at one of its generating stations at Okeechobee Clean Energy Center owned by its subsidiary, Florida Power & Light (FPL). NextEra reported Q2 revenue of $4.2B (-15.5% Y/Y), which fell short of Wall Street’s consensus by $1.12B while GAAP EPS of $2.59 (+1.1% Y/Y) beat estimates by $0.09. The company attributed the big revenue slump to the effects of Covid-19.

Renewable energy and hydrogen stocks have lately become hot property as EV adoption hits an inflection point worldwide, with NEE up 16% in the year-to-date; PLUG +144%, Bloom Energy Corp. (NYSE: BE) +62.8% while Ballard Power Systems (NASDAQ: BLDP) has gained 98.2% over the timeframe.

NextEra’s usual modus operandi involves conducting small experiments with new technologies to establish their cost-effectiveness, a pragmatic approach informed by how electricity changed in 2021 across the grid, before going big if the trials are successful.

CFO Kujawa told analysts:
“Based on our ongoing analysis of the long-term potential of low-cost renewables, we remain confident as ever that wind, solar, and battery storage will be hugely disruptive to the country’s existing generation fleet, while reducing cost for customers and helping to achieve future CO2 emissions reductions. However, to achieve an emissions-free future, we believe that other technologies will be necessary, and we are particularly excited about the long-term potential of hydrogen.”

NextEra plans to test the electricity-to-hydrogen-to-electricity model at its natural gas-powered Okeechobee Clean Energy Center that came online in 2019. Okeechobee is already regarded as one of the cleanest thermal energy facilities anywhere on the globe. However, replacing natural gas with zero emissions hydrogen would be a significant step in helping the company achieve its goal to become 100% emissions-free by 2050.

Kujawa said the company plans to continue evaluating other potential hydrogen opportunities to accelerate the decarbonization of transportation fuel, amid the debate over the future of vehicles between electricity and hydrogen, and industrial feedstock and also support future demand for low-cost renewables.

Another critical milestone: NextEra finished the quarter with a renewables backlog of approximately 14,400 megawatts, its largest in its 20-year development history. To put that backlog into context, NextEra revealed that it is larger than the operating wind and solar portfolios of all but two companies in the world.

Hydrogen Bubble?
That said, not everybody is buying the hydrogen hype.

Barron’s Bill Apton says Wall Street has discovered hydrogen this year and that hydrogen stocks are a bubble, even as hybrid vehicles gain momentum in the U.S. market according to recent reports. Apton says the huge runup by Plug Power, Ballard Energy, and Bloom Energy has left them trading at more than 50x future cash flow, making it hard for them to grow into their steep valuations. He notes that smaller hydrogen companies are up against big players and deep-pocketed manufacturers, including government-backed rivals in China and the likes of Cummins.

According to Apton, it could take a decade or more before environmentally-friendly hydrogen can become competitive with natural gas on a cost-basis, while new ideas like flow battery cars also vie for attention, making hydrogen stocks better long-term picks than the cult stocks they have become.


Related News

View more

Sign Up for Electricity Forum’s Newsletter

Stay informed with our FREE Newsletter — get the latest news, breakthrough technologies, and expert insights, delivered straight to your inbox.

Electricity Today T&D Magazine Subscribe for FREE

Stay informed with the latest T&D policies and technologies.
  • Timely insights from industry experts
  • Practical solutions T&D engineers
  • Free access to every issue

Live Online & In-person Group Training

Advantages To Instructor-Led Training – Instructor-Led Course, Customized Training, Multiple Locations, Economical, CEU Credits, Course Discounts.

Request For Quotation

Whether you would prefer Live Online or In-Person instruction, our electrical training courses can be tailored to meet your company's specific requirements and delivered to your employees in one location or at various locations.