US Summer Energy Bills Crisis is driven by record heatwaves, soaring electricity prices, AC cooling demand, energy poverty risks, and LIHEAP relief, straining low-income households, vulnerable seniors, and budgets amid volatile utilities and peak demand.
Key Points
Rising household energy costs from extreme heat, higher electricity prices, and AC demand, straining vulnerable families.
✅ Record heatwaves drive peak electricity and cooling loads
✅ Tiered rates and volatile markets inflate utility bills
✅ LIHEAP aid and cooling centers offer short-term relief
As the sweltering heat of summer continues to grip much of the United States, American households are grappling with a staggering rise in energy bills. The combination of record-breaking temperatures and rising electricity prices is placing an unprecedented financial strain on families, raising concerns about the long-term impact on household budgets and overall well-being.
Record Heat and Energy Consumption
This summer has witnessed some of the hottest temperatures on record across the country. With many regions experiencing prolonged heatwaves, the demand for air conditioning and cooling systems has surged amid unprecedented electricity demand across parts of the U.S. The increased use of these energy-intensive appliances has led to a sharp rise in electricity consumption, which, combined with elevated energy prices, has pushed household energy bills to new heights.
The situation is particularly dire for households that are already struggling financially. Many families are facing energy bills that are not only higher than usual but are reaching levels that are unsustainable, underscoring electricity struggles for thousands of families across the country. This has prompted concerns about the potential for energy poverty, where individuals are forced to make difficult choices between paying for essential services and covering other necessary expenses.
Impact on Low-Income and Vulnerable Households
Low-income households and vulnerable populations are disproportionately affected by these soaring energy costs. For many, the financial burden of high energy bills is compounded by energy insecurity during the pandemic and other economic pressures, such as rising food prices and stagnant wages. The strain of paying for electricity during extreme heat can lead to tough decisions, including cutting back on other essential needs like healthcare or education.
Moreover, the heat itself poses a serious health risk, particularly for the elderly, children, and individuals with pre-existing health conditions. High temperatures can exacerbate conditions such as cardiovascular and respiratory illnesses, making the need for reliable cooling even more critical. For those struggling to afford adequate cooling, the risk of heat-related illnesses and fatalities increases significantly.
Utilities and Energy Pricing
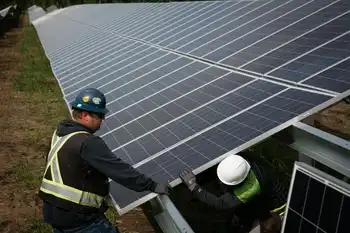
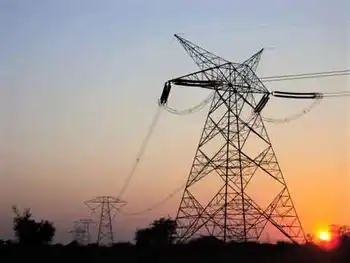
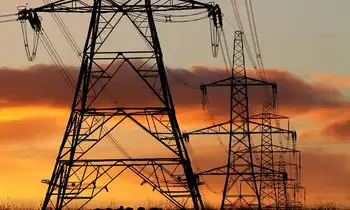
The sharp rise in energy bills can be attributed to several factors, including higher costs of electricity production and distribution. The ongoing transition to cleaner energy sources, while necessary for long-term environmental sustainability, has introduced short-term volatility in energy markets. Additionally, power-company supply chain crises and increased demand during peak summer months have contributed to higher prices.
Utilities are often criticized for their pricing structures, which can be complex and opaque. Some regions, including areas where California electricity bills soar under scrutiny, use tiered pricing models that charge higher rates as energy consumption increases. This can disproportionately impact households that need to use more energy during extreme heat, further exacerbating financial strain.
Government and Community Response
In response to the crisis, various government and community initiatives are being rolled out to provide relief. Federal and state programs aimed at assisting low-income households with energy costs are being expanded. These programs, such as the Low-Income Home Energy Assistance Program (LIHEAP), offer financial assistance to help with utility bills, but demand often outstrips available resources.
Local community organizations are also stepping in to offer support. Initiatives include distributing fans and portable air conditioners, providing temporary cooling centers, and offering financial assistance to help cover energy costs. These efforts are crucial in helping to mitigate the immediate impact of high energy bills on vulnerable households.
Long-Term Solutions and Sustainability
The current crisis highlights the need for long-term solutions to address both the causes and consequences of high energy costs. Investing in energy efficiency and renewable energy technologies can help reduce the overall demand for electricity and lower long-term costs. Improvements in building insulation, the adoption of energy-efficient appliances, and advancements in smart grid technologies to prevent summer power outages are all essential components of a sustainable energy future.
Furthermore, addressing income inequality and supporting economic stability are critical to ensuring that all households can manage their energy needs without facing financial hardship. Policymakers will need to consider a range of strategies, including financial support programs, regulatory reforms, and infrastructure investments, to create a more equitable and resilient energy system.
Conclusion
As American households endure the double burden of extreme summer heat and skyrocketing energy bills, the need for immediate relief and long-term solutions has never been clearer. The current crisis serves as a reminder of the broader challenges facing the nation’s energy system and the importance of addressing both short-term needs and long-term sustainability. By investing in efficient technologies, supporting vulnerable populations, and developing resilient infrastructure, the U.S. can work towards a future where energy costs are manageable, and everyone has access to the resources they need to stay safe and comfortable.
Related News