Hinkley Point C dome lift marks a nuclear reactor milestone in Somerset, as EDF used Big Carl crane to place a 245-tonne steel roof, enabling 2027 startup amid costs, delays, and precision indoor welding.
Key Points
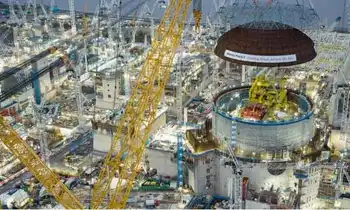
A 245-tonne dome lifted onto Hinkley Point C's first reactor, finishing the roof and enabling fit-out for a 2027 startup.
✅ 245-tonne steel dome lifted by Big Carl onto 44m-high reactor
✅ Indoor welding avoided weather defects seen at Flamanville
✅ Cost now £33bn; first power targeted by end of 2027
Engineers have lifted a steel roof onto a building which will house the first of two nuclear reactors at Hinkley Point in Somerset.
Hundreds of people helped with the delicate operation to get the 245-tonne steel dome into position.
It means the first reactor can be installed next year, ready to be switched on in June 2027.
Engineers at EDF said the "challenging job" was completed in just over an hour.
They first broke the ground on the new nuclear station in March 2017. Now, some 10,000 people work on what is Europe's largest building site.
Yet many analysts note that Europe is losing nuclear power even as demand for reliable energy grows.
They have faced delays from Covid restrictions and other recent setbacks, and the budget has doubled to £33bn, so getting the roof on the first of the two reactor buildings is a big deal.
EDF's nuclear island director Simon Parsons said it was a "fantastic night".
"Lifting the dome into place is a celebration of all the work done by a fantastic team. The smiles on people's faces this morning were something else.
"Now we can get on with the fitting of equipment, pipes and cables, including the first reactor which is on site and ready to be installed next year."
Nuclear minister Andrew Bowie hailed the "major milestone" in the building project, citing its role in the UK's green industrial revolution ambitions.
He said: "This is a key part of the UK Government's plans to revitalise nuclear."
But many still question whether Hinkley Point C will be worth all the money, especially after Hitachi's project freeze in Britain, with Roy Pumfrey of the Stop Hinkley campaign describing the project as "shockingly bad value".
Why lift the roof on?
The steel dome is bigger than the one on St Paul's Cathedral in London.
To lift it onto the 44-metre-high reactor building, they needed the world's largest land-based crane, dubbed Big Carl by engineers.
So why not just build the roof on top of the building?
The answer lies in a remote corner of Normandy in France, near a village called Flamanville.
EDF has been building a nuclear reactor there since 2007, ten years before they started in west Somerset.
The project is now a decade behind schedule and has still not been approved by French regulators.
Why? Because of cracks found in the precision welding on the roof of the reactor building.
In nuclear-powered France, they built the roof in situ, out in the open.
Engineers have decided welding outside, exposed to wind and rain, compromised the high standards needed for a nuclear reactor.
So in Somerset they built a temporary workshop, which looks like a fair sized building itself. All the welding has been done inside, and then the completed roof was lifted into place.
Is it on time or on budget?
No, neither. When Hinkley C was first approved a decade ago, EDF said it would cost £14bn.
Four years later, in 2017, they finally started construction. By now the cost had risen to £19.5bn, and EDF said the plant would be finished by the end of 2025.
Today, the cost has risen to £33bn, and it is now hoped Hinkley C will produce electricity by the end of 2027.
"Nobody believes it will be done by 2027," said campaigner Roy Pumfrey.
"The costs keep rising, and the price of Hinkley's electricity will only get dearer," they added.
On the other hand, the increase in costs is not a problem for British energy bill payers, or the UK government.
EDF agreed to pay the full cost of construction, including any increases.
When I met Grant Shapps, then the UK Energy Secretary, at the site in April, he shrugged off the cost increases.
He said: "I think we should all be rather pleased it is not the British tax payer - it is France and EDF who are paying."
In return, the UK government agreed a set rate for Hinkley's power, called the Strike Price, back in 2013. The idea was this would guarantee the income from Hinkley Point for 35 years, allowing investors to get their money back.
Will it be worth the money?
Back in 2013, the Strike Price was set at £92.50 for each megawatt hour of power. At the time, the wholesale price of electricity was around £50/MWh, so Hinkley C looked expensive.
But since then, global shocks like the war in Ukraine have increased the cost of power substantially, and advocates argue next-gen nuclear could deliver smaller, cheaper, safer designs.
Related News