Global Electricity Demand Surge underscores rising coal generation, lagging renewables deployment, and escalating emissions, as nations prioritize reliable power; nuclear energy and grid decarbonization emerge as pivotal solutions to the electricity transition.
Key Points
A rapid post-lockdown rise in power consumption, outpacing renewables growth and driving higher coal use and emissions.
✅ Coal generation rises faster than wind and solar additions
✅ Emissions increase as economies prioritize reliable baseload power
✅ Nuclear power touted for rapid grid decarbonization
By Robert Bryce
As the Covid lockdowns are easing, the global economy is recovering and that recovery is fueling blistering growth in electricity use. The latest data from Ember, the London-based “climate and energy think tank focused on accelerating the global electricity transition,” show that global power demand soared by about 5% in the first half of 2021. That’s faster growth than was happening back in 2018 when electricity use was increasing by about 4% per year.
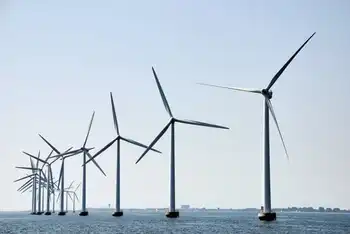
The numbers from Ember also show that despite lots of talk about the urgent need to reduce greenhouse gas emissions, coal demand for power generation continues to grow and emissions from the electric sector continue to grow: up by 5% over the first half of 2019. In addition, they show that while about half of the growth in electricity demand was met by wind and solar, as low-emissions sources are set to cover almost all new demand over the next three years, overall growth in electricity use is still outstripping the growth in renewables.
The soaring use of electricity, and increasing emissions from power generation confirm the sage wisdom of Rasheed Wallace, the volatile former power forward with the Detroit Pistons and other NBA teams, and now an assistant coach at the University of Memphis, who coined the catchphrase: “Ball don’t lie.” If Wallace or one of his teammates was called for a foul during a basketball game that he thought was undeserved, and the opposing player missed the ensuing free throws, Wallace would often holler, “ball don’t lie,” as if the basketball itself was pronouncing judgment on the referee’s errant call.
I often think about Wallace’s catchphrase while looking at global energy and power trends and substitute my own phrase: numbers don’t lie.
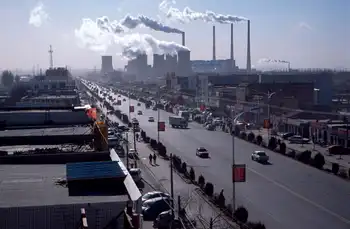
Over the past few weeks Ember, BP, and the International Energy Agency have all published reports which come to the same two conclusions: that countries all around the world — and China's electricity sector in particular — are doing whatever they need to do to get the electricity they need to grow their economies. Second, they are using lots of coal to get that juice.
As I discuss in my recent book, A Question of Power: Electricity and the Wealth of Nations, Electricity is the world’s most important and fastest-growing form of energy. The Ember data proves that. At a growth rate of 5%, global electricity use will double in about 14 years, and as surging electricity demand is putting power systems under strain around the world, the electricity sector also accounts for the biggest single share of global carbon dioxide emissions: about 25 percent. Thus, if we are to have any hope of cutting global emissions, the electricity sector is pivotal. Further, the soaring use of electricity shows that low-income people and countries around the world are not content to stay in the dark. They want to live high-energy lives with access to all the electronic riches that we take for granted.
Ember’s data clearly shows that decarbonizing the global electric grid will require finding a substitute for coal. Indeed, coal use may be plummeting in the U.S. and western Europe, where U.S. electricity consumption has been declining, but over the past two years, several developing countries including Mongolia, China, Bangladesh, Vietnam, Kazakhstan, Pakistan, and India, all boosted their use of coal. This was particularly obvious in China, where, between the first half of 2019 and the first half of 2021, electricity demand jumped by about 14%. Of that increase, coal-fired generation provided roughly twice as much new electricity as wind and solar combined. In Pakistan, electricity demand jumped by about 7%, and coal provided more than three times as much new electricity as nuclear and about three times as much as hydro. (Wind and solar did not grow at all in Pakistan over that period.)
Hate coal all you like, but its century-long persistence in power generation proves its importance. That persistence proves that climate change concerns are not as important to most consumers and policymakers as reliable electricity. In 2010, Roger Pielke Jr. dubbed this the Iron Law of Climate Policy which says “When policies on emissions reductions collide with policies focused on economic growth, economic growth will win out every time.” Pielke elaborated on that point, saying the Iron Law is a “boundary condition on policy design that is every bit as limiting as is the second law of thermodynamics, and it holds everywhere around the world, in rich and poor countries alike. It says that even if people are willing to bear some costs to reduce emissions (and experience shows that they are), they are willing to go only so far.”
Over the past five years, I’ve written a book about electricity, co-produced a feature-length documentary film about it (Juice: How Electricity Explains the World), and launched a podcast that focuses largely on energy and power. I’m convinced that Pielke’s claim is exactly right and should be extended to electricity and dubbed the Iron Law of Electricity which says, “when forced to choose between dirty electricity and no electricity, people will choose dirty electricity every time.” I saw this at work in electricity-poor places all over the world, including India, Lebanon, and Puerto Rico.
Pielke, a professor at the University of Colorado as well as a highly regarded author on the politics of climate change and sports governance, has since elaborated on the Iron Law. During an interview in Juice, he explained it thusly: “The Iron Law says we’re not going to reduce emissions by willingly getting poor. Rich people aren't going to want to get poorer, poor people aren't going to want to get poorer.” He continued, “If there is one thing that we can count on it is that policymakers will be rewarded by populations if they make people wealthier. We're doing everything we can to try to get richer as nations, as communities, as individuals. If we want to reduce emissions, we really have only one place to go and that's technology.”
Pielke’s point reminds me of another of my favorite energy analysts, Robert Rapier, who made a salient point in his Forbes column last week. He wrote, “Despite the blistering growth rate of renewables, it’s important to keep in mind that overall global energy consumption is growing. Even though global renewable energy consumption has increased by about 21 exajoules in the past decade, overall energy consumption has increased by 51 exajoules. Increased fossil fuel consumption made up most of this growth, with every category of fossil fuels showing increased consumption over the decade.”
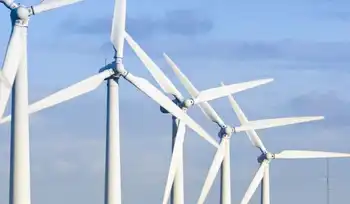
The punchline here – despite my tangential reference to Rasheed Wallace — is obvious: The claims that massive reductions in global carbon dioxide emissions must happen soon are being mocked by the numbers. Countries around the world are acting in their interest, particularly when it comes to their electricity needs and that is resulting in big increases in emissions. As Ember concludes in their report, wind and solar are growing, and some analyses suggest renewables could eclipse coal by 2025, but the “electricity transition” is “not happening fast enough.”
Ember explains that in the first half of 2021, wind and solar output exceeded the output of the world’s nuclear reactors for the first time. It also noted that over the past two years, “Nuclear generation fell by 2% compared to pre-pandemic levels, as closures at older plants across the OECD, especially amid debates over European nuclear trends, exceeded the new capacity in China.” While that may cheer anti-nuclear activists at groups like Greenpeace and Friends of the Earth, the truth is obvious: the only way – repeat, the only way – the electric sector will achieve significant reductions in carbon dioxide emissions is if we can replace lots of coal-fired generation with nuclear reactors and do so in relatively short order, meaning the next decade or so. Renewables are politically popular and they are growing, but they cannot, will not, be able to match the soaring demand for the electricity that is needed to sustain modern economies and bring developing countries out of the darkness and into modernity.
Countries like China, Vietnam, India, and others need an alternative to coal for power generation. They need new nuclear reactors that are smaller, safer, and cheaper than the existing designs. And they need it soon. I will be writing about those reactors in future columns.
Related News