Bill proposed energy ratings when homes sold

By Toronto Star


Protective Relay Training - Basic

Our customized live online or in‑person group training can be delivered to your staff at your location.

  • Live Online
  • 12 hours Instructor-led
  • Group Training Available
Regular Price:
$699
Coupon Price:
$599
Reserve Your Seat Today
Provincial legislators expressed support for a private members' bill that would make energy-efficiency audits mandatory for all home sellers.

The Home Energy Rating Act, if passed by Queen's Park, would require anyone selling a house or low-rise building to disclose the results of a home-energy audit to prospective buyers.

Sellers of new homes would also have to supply energy-efficiency ratings before making a sale.

"I think we've got all-party support for this," said Liberal backbencher Phil McNeely, who introduced the bill.

McNeely said homebuyers are looking at energy prices and becoming increasingly concerned about the higher cost of owning a home, not just buying it.

He said efficiency ratings will spur greater demand for new and resale homes that use less energy, ultimately increasing their property value compared with less-efficient homes and pressuring new home builders to go beyond the minimum standards in the building code.

"We totally endorse this bill," said Peter Hwang, co-founder and chief executive of Toronto-based EnWise Power Solutions Inc., which does home energy audits and retrofit work for homeowners.

"If it does anything it heightens awareness of energy efficiency, making it one of the most important ways of improving a home,'' he said.

Ken Elsey, president of the Canadian Energy Efficiency Alliance, called it "the most significant piece of legislation in years" because it uncovers the true cost of home ownership and will pressure sellers to do efficiency upgrades before they put their property on the market.

"It will also serve as an economic and employment stimulus," said Elsey, referring to the increased demand for energy auditors, retro-fitters and energy-efficient appliances and materials.

The requirement would apply to all newly built homes in 2010, followed in 2011 by detached, semi-detached and multi-unit residential buildings put on the market for resale.

In 2012, those leasing buildings would also have to supply the ratings.

McNeely said the bill passed its second reading and now goes to committee, where most private members' bills end up dying.

He's counting on Energy and Infrastructure Minister George Smitherman to carry it from there.

"If the minister likes it, then he could pick it up and put it into legislation fairly quickly," McNeely added.

Related News

Clean energy jobs energize Pennsylvania: Clean Energy Employment Report

Pennsylvania Clean Energy Employment surges, highlighting workforce growth in energy efficiency, solar, wind, grid and storage, and alternative transportation, supporting COVID-19 recovery, high-wage jobs, manufacturing, construction, and statewide economic resilience.


Key Points

Jobs across clean power, efficiency, grid, storage, and advanced transport fueling Pennsylvania's workforce growth.

✅ 8.7% job growth from 2017-2019, outpacing statewide average

✅ 97,000+ employed across efficiency, solar, wind, grid, and fuels

✅ 75% earn above median; strong full-time opportunities


The 2020 Pennsylvania Clean Energy Employment Report has been released, and Gov. Tom Wolf is energized by it.

This "comes at an opportune time, as government and industry leaders look to strengthen Pennsylvania's workforce and economy in response to the challenges of the COVID-19 pandemic," Wolf said Monday in a prepared statement. "This detailed analysis of data and trends in clean energy employment ... demonstrates the sector was a top job generator statewide, and shows which industries were hiring and looking for trained workers."

Foremost among the findings, released Monday, is that the clean energy sector was responsible for adding 7,794 jobs from 2017 through 2019. That is an 8.7% average job growth rate, well above the 1.9% overall average in the state, according to a news release from Wolf's office.

This report lists employment data in five industries: energy efficiency; clean energy generation; alternative transportation; clean grid and storage; and clean fuels, while some cleaner states still import dirty electricity in regional markets.

The energy efficiency industry was the biggest clean energy employer in the state last year, with more than 71,400 state residents working in construction, technology and manufacturing jobs related to energy-efficient systems.

Solar energy workers comprised the largest share of the clean energy generation workforce – 35.4%, or 5,173 individuals. Solar employment increased 8.3% from 2017 to 2019, while there was a slight decline nationwide amid clean energy job losses reported in May.

Wind energy firms employed 2,937, and policy moves such as Ontario's clean electricity regulations signal broader market shifts, with more than 21% of those roles in manufacturing.

Job losses, though, were recorded in nuclear generation (minus 4.5%) and coal generation (minus 8.6%) over the two-year period, as electricity deregulation remains a point of debate in the sector. This mirrors national declines in both categories.

Federal efforts to support coal community revitalization are channeling clean energy projects to hard-hit regions.

Natural gas electric generation capacity doubled across Pennsylvania over the past decade; even as residents could face winter electricity price increases according to recent reports, employment still grew 13.4% from 2017 through 2019. But increasing output from unconventional wells has outpaced demand, sparking reductions in siting and drilling for new wells.

The Clean Energy Employment Report was released along with – and as part of – the 2020 Pennsylvania Energy Employment Report, which asserts that energy remains a large employer in the state, and new clean energy funding announcements underscore the sector's momentum. As of the last quarter of 2019, according to the larger report, energy accounted for 269,031 jobs, or 4.5% of the overall statewide workforce.

Wolf, in summary, said: "This report shows that workforce training investment decisions can benefit Pennsylvanians right now and position the state going forward to grow and improve livelihoods, the economy and our environment."


Related News

View more

COVID-19 closures: It's as if Ottawa has fallen off the electricity grid

Ontario Electricity Demand Drop During COVID-19 reflects a 1,000-2,000 MW decline as IESO balances the grid, shifts peak demand later, throttles generators and baseload nuclear, and manages exports amid changing load curves.


Key Points

An about 10% reduction in Ontario's load, shifting peaks and requiring IESO grid balancing measures.

✅ Demand down 1,000-2,000 MW; roughly 10% below normal.

✅ Peak shifts later in morning as home use rises.

✅ IESO throttles generators; baseload nuclear stays online.


It’s as if the COVID-19 epidemic had tripped a circuit breaker, shutting off all power to a city the size of Ottawa.

Virus-induced restrictions that have shut down large swaths of normal commercial life across Canada has led to a noticeable drop in demand for power in Ontario and reflect a global demand dip according to reports, insiders said on Friday.

Terry Young, vice-president with the Independent Electricity System Operator, said planning was underway for further declines in usage and for whether Ontario will embrace more clean power in the long term, given the delicate balance that needs to be maintained between supply and demand.

“We’re now seeing demand that is running about 1,000 to 2,000 megawatts less than we would normally see,” Young said. “You’re essentially seeing a city the size of Ottawa drop off demand during the day.”

At the high end, a 2,000 megawatt reduction would be close to the equivalent peak demand of Ottawa and London, Ont., combined.

The decline, in the order of 10 per cent from the 17,000 to 18,000 megawatts of usage that might normally be expected and similar to the UK’s 10% drop reported during lockdowns, began last week, Young said. The downward trend became more noticeable as governments and health authorities ordered non-essential businesses to close and people to stay home. However, residential and hospital usage has climbed.

Experts say frequent hand-washing and staying away from others is the most effective way to curb the spread of the highly contagious coronavirus, which poses a special risk to older people and those with underlying health conditions. As a result, factories and other big users have reduced production or closed entirely.

Because electricity cannot be stored, generators need to throttle back their output as domestic demand shrinks and exports to places such as the United States, including New York City, which is also being hit hard by the coronavirus, fall.

“We’re watching this carefully,” Young said. “We’re able to manage this drop, but it’s something we obviously have to keep watching…and making sure we’re not over-generating electricity.”

Turning off generation, especially for nuclear plants, is an intensive process, as are restarts and would likely happen only if the downward demand trend intensifies significantly, amid concerns over Ontario’s electricity getting dirtier if baseload is displaced. However, one of North America’s largest generators, Bruce Power near Kincardine, Ont., said it had a large degree of flexibility to scale down or up.

“We have the ability to provide one-third of our output as a dynamic response, which is unique to our facility,” said James Scongack, an executive vice-president with Bruce Power. “We developed this coming out of the 2008 downturn and it’s been a critical system asset for the last decade.”

“We don’t see there being a scenario where our baseload will not be needed,” he said, even as some warn Ontario may be short of electricity in the coming years.

The province’s publicly owned Ontario Power Generation said it was also in conversations with the system operator, which provides direction to generators, and is often cited in the Ontario election discussion.

One clear shift in normal work-day usage with so many people staying at home has been the change in demand patterns. Typically, Young said, there’s a peak from about 7 a.m. to 8 a.m. as people wake and get ready to go to work or school. The peak is now occurring later in the morning, Young said.


Related News

View more

Customers on the hook for $5.5 billion in deferred BC Hydro operating costs: report

BC Hydro Deferred Regulatory Assets detail $5.5 billion in costs under rate-regulated accounting, to be recovered from ratepayers, highlighting B.C. Utilities Commission oversight, audit scrutiny, financial reporting impacts, and public utility governance.


Key Points

BC Hydro defers costs as regulatory assets to recover from ratepayers, influencing rates and financial reporting.

✅ $5.5B in deferred costs recorded as net regulatory assets

✅ Rate impacts tied to B.C. Utilities Commission oversight

✅ Auditor General to assess accounting and governance


Auditor General Carol Bellringer says BC Hydro has deferred $5.5 billion in expenses that it plans to recover from ratepayers in the future, as rates to rise by 3.75% over two years.

Bellringer focuses on the deferred expenses in a report on the public utility's use of rate-regulated accounting to control electricity rates for customers.

"As of March 31, 2018, BC Hydro reported a total net regulatory asset of $5.455 billion, which is what ratepayers owe," says the report. "BC Hydro expects to recover this from ratepayers in the future. For BC Hydro, this is an asset. For ratepayers, this is a debt."

She says rate-regulated accounting is used widely across North America, but cautions that Hydro has largely overridden the role of the independent B.C. Utilities Commission to regulate rates.

"We think it's important for the people of B.C. and our members of the legislative assembly to better understand rate-regulated accounting in order to appreciate the impact it has on the bottom line for BC Hydro, for government as a whole, for ratepayers and for taxpayers, especially following a three per cent rate increase in April 2018," Bellringer said in a conference call with reporters.

Last June, the B.C. government launched a two-phase review of BC Hydro to find cost savings and look at the direction of the Crown utility, amid calls for change from advocates.

The review came shortly after a planned government rate freeze was overturned by the utilities commission, which resulted in a three per cent rate increase in April 2018.

A statement by BC Hydro and the government says a key objective of the review due this month is to enhance the regulatory oversight of the commission.

Bellringer's office will become BC Hydro's auditor next year — and will be assessing the impact of regulation on the utility's financial reporting.

"It is a complex area and confidence in the regulatory system is critical to protect the public interest," wrote Bellringer.


Related News

View more

Power outage update: 252,596 remain without electricity Wednesday

North Carolina Power Outages continue after Hurricane Florence, with Wilmington and Eastern Carolina facing flooding, storm damage, and limited access as Duke Energy crews and mutual aid work on restoration across affected counties.


Key Points

Outages after Hurricane Florence, with Wilmington and Eastern Carolina hardest hit as crews restore service amid floods.

✅ Over 250,000 outages statewide as of early Wednesday

✅ Wilmington cut off by flooding, hindering utility access

✅ Duke Energy and EMC crews conduct phased restoration


Power is slowly being restored to Eastern Carolina residents after Hurricane Florence made landfall near Wilmington on Friday, September 15, a scenario echoed by storm-related outages in Tennessee in recent days.

On Monday, more than half a million people remained without power across the state, a situation comparable to post-typhoon electricity losses in Hong Kong reported elsewhere.

As of Wednesday morning at 1am, the Dept. of Public Safety reports 252,596 total power outages in North Carolina, and utilities continue warning about copper theft hazards during restoration.

More than half of those customers are in Eastern Carolina.

More than 32,000 customers are without power in Carteret County and roughly 21,000 are without power in Onslow County.

In Craven County, roughly 15,000 people remain without power Wednesday morning.

Many of the state's outages are effecting the Wilmington area, where Florence made landfall and widespread flooding is still cutting off the city from outside resources, similar to how a fire-triggered outage in Los Angeles disrupted service regionally.

Heavy rain, strong winds and now flooded roadways have hindered power crews, challenges that utility climate adaptation aims to address while many of them have out-of-state or out-of-town help working to restore power to so many people.

Here's a breakdown of current outages by utility company:

DUKE ENERGY PROGRESS - 

  • 1,350 in Beaufort Co. 
  • 10,706 in Carteret Co. 
  • 2,716 in Pamlico Co. 
  • 7,422 in Craven Co. 
  • 1,687 in Jones Co. 
  • 13,319 in Onslow Co. 
  • 7,452 in Pender Co. 
  • 48,281 in New Hanover Co. 
  • 5,257 in Duplin Co. 
  • 488 in Lenoir Co. 
  • 1,231 in Pitt Co.


JONES-ONSLOW EMC - 10,964 total 

  • 7,699 in Onslow Co. 
  • 2,366 in Pender Co. 
  • 816 in Jones Co.

TIDELAND EMC - 

  • 174 in Beaufort Co.
  • 1,521 in Craven Co.
  • 1,693 in Pamlico Co.

CARTERET-CRAVEN ELECTRIC CO OP- 

  • 21,974 in Carteret Co. 
  • 6,553 in Craven Co.
  • 216 in Jones Co.


Related News

View more

Hydro One launches Ultra-Low Overnight Electricity Price Plan

Ultra-Low Overnight Price Plan delivers flexible electricity pricing from Hydro One and the Ontario Energy Board, with TOU, tiered options, off-peak EV charging savings, balanced billing, and an online calculator to optimize bills.


Key Points

An Ontario pricing option with ultra-low night rates, helping Hydro One customers save by shifting usage to off-peak.

✅ Four periods with ultra-low overnight rate for EV charging

✅ Compare TOU vs tiered with Hydro One's online calculator

✅ Balanced billing and due date choice support budget control


Hydro One has announced that customers have even more choice and flexibility when it comes to how they are billed for electricity with the company's launch of the Ontario Energy Board's new Ultra-Low Overnight Electricity Price Plan for customers. A new survey of Ontario customers, conducted by Innovative Research Group, shows that 74 per cent of Ontarians find having choice between electricity pricing plans useful.

"As their trusted energy advisor, we want our customers to know we have the insights and tools to help them make the right choice when it comes to their electricity plans," said Teri French, Executive Vice President, Safety, Operations and Customer Experience. "We know that choice and flexibility are important to our customers, and we are proud to now offer them a third option so they can select the plan that best fits their lifestyle."

The same survey revealed that fewer than half of Ontarians are familiar with either tiered or the new ultra-low overnight price plans. To better support its customers Hydro One is providing an online calculator to help them choose which pricing plan best suits their lifestyle. The company also offers additional flexibility and assistance in managing household budgets by providing customers with the ability to choose their billing due date and flatten usage spikes from temperature fluctuations through balanced billing.

During the pandemic, Ontario introduced electricity relief to support families, small businesses and farms, complementing these customer options.

"By offering families and small businesses more choice, we are putting them back in control of their energy bills," said Todd Smith, Minister of Energy. "Starting today Hydro One customers have a new option - the Ultra-Low Electricity Price Plan - which could help them save money each year, while making our province's grid more efficient."

Electricity price plan options

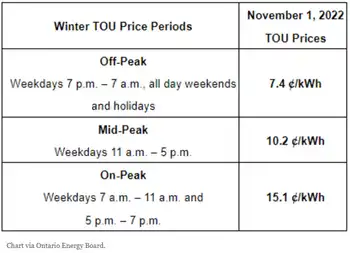
  • New Ultra-Low Overnight price plan (ULO): Designed for customers who use more electricity at night, such as those who charge their electric vehicle, this new price plan can help customers keep costs down and take control of their electricity bill by shifting usage to the ultra-low overnight price period and related off-peak electricity rates when province-wide electricity demand is lower.
  • This plan has four price periods that are the same in the summer as they are in the winter and includes an ultra-low overnight rate.
  • Time-of-Use price plan (TOU): TOU provides customers with more control over their electricity bill by adjusting their usage habits with time-of-use rates used in other jurisdictions as well.
  • In this plan, electricity prices change throughout each weekday, when demand is on-peak, and peak hydro rates can affect overall costs.
  • Tiered price plan (RPP): Tiered pricing provides customers with the flexibility to use electricity at any time of day at the same low price up until the threshold is exceeded during the month, after that usage is charged at a higher price.
  • For residential customers, the winter period (November 1 – April 30) threshold is 1,000 kWh per month and the summer period (May 1 – October 31) threshold is 600 kWh per month. 
  • For small business customers, the threshold is 750 kWh throughout the year, while broader stable electricity pricing supports industrial and commercial companies.


Related News

View more

India is now the world’s third-largest electricity producer

India Electricity Production 2017 surged to 1,160 BU, ranking third globally; rising TWh output with 334 GW capacity, strong renewables and thermal mix, 7% CAGR in generation, and growing demand, investments, and FDI inflows.


Key Points

India's 2017 power output reached 1,160 BU, third globally, supported by 334 GW capacity, rising renewables, and 7% CAGR.

✅ 1,160 BU generated; third after China and the US

✅ Installed capacity 334 GW; 65% thermal, rising renewables

✅ Generation CAGR ~7%; demand, FDI, investments rising


India now generates around 1,160.1 billion units of electricity in financial year 2017, up 4.72% from the previous year, and amid surging global electricity demand that is straining power systems. The country is behind only China which produced 6,015 terrawatt hours (TWh. 1 TW = 1,000,000 megawatts) and the US (4,327 TWh), and is ahead of Russia, Japan, Germany, and Canada.


India’s electricity production grew 34% over seven years to 2017, and the country now produces more energy than Japan and Russia, which had 27% and 8.77% more electricity generation capacity installed, respectively, than India seven years ago.

India produced 1,160.10 billion units (BU) of electricity–one BU is enough to power 10 million households (one household using average of about 3 units per day) for a month–in financial year (FY) 2017. Electricity production stood at 1,003.525 BU between April 2017-January 2018, according to a February 2018 report by India Brand Equity Foundation (IBEF), a trust established by the commerce ministry.

#google#

With a production of 1,423 BU in FY 2016, India was the third largest producer and the third largest consumer of electricity in the world, behind China (6,015 BU) and the United States (4,327 BU).

With an annual growth rate of 22.6% capacity addition over a decade to FY 2017, renewables beat other power sources–thermal, hydro and nuclear. Renewables, however, made up only 18.79% of India’s energy, up 68.65% since 2007, and globally, low-emissions sources are expected to cover most demand growth in the coming years. About 65% of installed capacity continues to be thermal.

As of January 2018, India has installed power capacity of 334.4 gigawatt (GW), making it the fifth largest installed capacity in the world after European Union, China, United States and Japan, and with much of the fleet coal-based, imported coal volumes have risen at times amid domestic supply constraints.

The government is targeting capacity addition of around 100 GW–the current power production of United Kingdom–by 2022, as per the IBEF report.


Electricity generation grew at 7% annually

India achieved a 34.48% growth in electricity production by producing 1,160.10 BU in 2017 compared to 771.60 BU in 2010–meaning that in these seven years, electricity production in India grew at a compound annual growth rate (CAGR) of 7.03%, while thermal power plants' PLF has risen recently amid higher demand and lower hydro.


Generation capacity grew at 10% annually

Of 334.5 GW installed capacity as of January 2018–up 60% from 132.30 GW in 2007–thermal installed capacity was 219.81 GW. Hydro and renewable energy installed capacity totaled 44.96 GW and 62.85 GW, respectively, said the report.

The CAGR in installed capacity over a decade to 2017 was 10.57% for thermal power, 22.06% for renewable energy–the fastest among all sources of power–2.51% for hydro power and 5.68% for nuclear power.


Growing demand, higher investments will drive future growth

Growing population and increasing penetration of electricity connections, along with increasing per-capita usage would provide further impetus to the power sector, said the report.

Power consumption is estimated to increase from 1,160.1 BU in 2016 to 1,894.7 BU in 2022, as per the report, though electricity demand fell sharply in one recent period.

Increasing investment remained one of the driving factors of power sector growth in the country.

Power sector has a 100% foreign direct investment (FDI) permit, which boosted FDI inflows in the sector.

Total FDI inflows in the power sector reached $12.97 billion (Rs 83,713 crore) during April 2000 to December 2017, accounting for 3.52% of FDI inflows in India, the report said.


Related News

View more

Sign Up for Electricity Forum’s Newsletter

Stay informed with our FREE Newsletter — get the latest news, breakthrough technologies, and expert insights, delivered straight to your inbox.

Electricity Today T&D Magazine Subscribe for FREE

Stay informed with the latest T&D policies and technologies.
  • Timely insights from industry experts
  • Practical solutions T&D engineers
  • Free access to every issue

Download the 2025 Electrical Training Catalog

Explore 50+ live, expert-led electrical training courses –

  • Interactive
  • Flexible
  • CEU-cerified