Smart EV Charging orchestrates vehicle-to-grid (V2G), demand response, and fast charging to balance the power grid, integrating renewables, electrolyzers for hydrogen, and megawatt chargers for fleets with advanced control and co-optimization.
Key Points
Smart EV charging coordinates EV load to stabilize the grid, cut peaks, and integrate renewable energy efficiently.
✅ Reduces peak demand via coordinated, flexible load control
✅ Enables V2G services with renewables and battery storage
✅ Supports megawatt fast charging for heavy-duty fleets
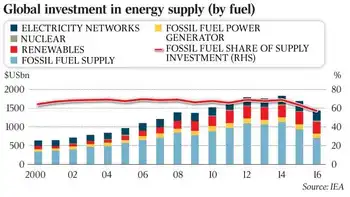
As electric vehicle (EV) sales continue to rev up in the United States, the power grid is in parallel contending with the greatest transformation in its 100-year history: the large-scale integration of renewable energy and power electronic devices. The expected expansion of EVs will shift those challenges into high gear, causing cities to face gigawatt-growth in electricity demand, as analyses of EV grid impacts indicate, and higher amounts of variable energy.
Coordinating large numbers of EVs with the power system presents a highly complex challenge. EVs introduce variable electrical loads that are highly dependent on customer behavior. Electrified transportation involves co-optimization with other energy systems, like natural gas and bulk battery storage, including mobile energy storage flexibility for new operational options. It could involve fleets of automated ride-hailing EVs and lead to hybrid-energy truck stops that provide hydrogen and fast-charging to heavy-duty vehicles.
Those changes will all test the limits of grid integration, but the National Renewable Energy Laboratory (NREL) sees opportunity at the intersection of energy systems and transportation. With powerful resources for simulating and evaluating complex systems, several NREL projects are determining the coordination required for fast charging, balancing electrical supply and demand, and efficient use of all energy assets.
Smart and Not-So-Smart Control
To appreciate the value of coordinated EV charging, it is helpful to imagine the opposite scenario.
"Our first question is how much benefit or burden the super simple, uncoordinated approach to electric vehicle charging offers the grid," said Andrew Meintz, the researcher leading NREL's Electric Vehicle Grid Integration team, as well as the RECHARGE project for smart EV charging. "Then we compare that to the 'whiz-bang,' everything-is-connected approach. We want to know the difference in value."
In the "super simple" approach, Meintz explained that battery-powered electric vehicles grow in market share, exemplified by mass-market EVs, without any evolution in vehicle charging coordination. Picture every employee at your workplace driving home at 5 p.m. and charging their vehicle. That is the grid's equivalent of going 0 to 100 mph, and if it does not wreck the system, it is at least very expensive. According to NREL's Electrification Futures Study, a comprehensive analysis of the impacts of widespread electrification across all U.S. economic sectors, in 2050 EVs could contribute to a 33% increase in energy use during peak electrical demand, underscoring state grid challenges that make these intervals costly when energy reserves are procured. In duck curve parlance, EVs will further strain the duck's neck.
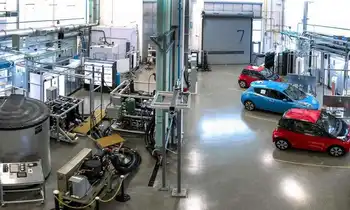
The Optimization and Control Lab's Electric Vehicle Grid Integration bays allow researchers to determine how advanced high power chargers can be added safely and effectively to the grid, with the potential to explore how to combine buildings and EV charging. Credit: Dennis Schroeder, NREL
Meintz's "whiz-bang" approach instead imagines EV control strategies that are deliberate and serve to smooth, rather than intensify, the upcoming demand for electricity. It means managing both when and where vehicles charge to create flexible load on the grid.
At NREL, smart strategies to dispatch vehicles for optimal charging are being developed for both the grid edge, where consumers and energy users connect to the grid, as in RECHARGEPDF, and the entire distribution system, as in the GEMINI-XFC projectPDF. Both projects, funded by the U.S. Department of Energy's (DOE's) Vehicle Technologies Office, lean on advanced capabilities at NREL's Energy Systems Integration Facility to simulate future energy systems.
At the grid edge, EVs can be co-optimized with distributed energy resources—small-scale generation or storage technologies—the subject of a partnership with Eaton that brought industry perspectives to bear on coordinated management of EV fleets.
At the larger-system level, the GEMINI-XFC project has extended EV optimization scenarios to the city scale—the San Francisco Bay Area, to be specific.
"GEMINI-XFC involves the highest-ever-fidelity modeling of transportation and the grid," said NREL Research Manager of Grid-Connected Energy Systems Bryan Palmintier.
"We're combining future transportation scenarios with a large metro area co-simulationPDF—millions of simulated customers and a realistic distribution system model—to find the best approaches to vehicles helping the grid."
GEMINI-XFC and RECHARGE can foresee future electrification scenarios and then insert controls that reduce grid congestion or offset peak demand, for example. Charging EVs involves a sort of shell game, where loads are continually moved among charging stations to accommodate grid demand.
But for heavy-duty vehicles, the load is harder to hide. Electrified truck fleets will hit the road soon, creating power needs for electric truck fleets that translate to megawatts of localized demand. No amount of rerouting can avoid the requirements of charging heavy-duty vehicles or other instances of extreme fast-charging (XFC). To address this challenge, NREL is working with industry and other national laboratories to study and demonstrate the technological buildout necessary to achieve 1+ MW charging stationsPDF that are capable of fast charging at very high energy levels for medium- and heavy-duty vehicles.
To reach such a scale, NREL is also considering new power conversion hardware based on advanced materials like wide-bandgap semiconductors, as well as new controllers and algorithms that are uniquely suited for fleets of charge-hungry vehicles. The challenge to integrate 1+ MW charging is also pushing NREL research to higher power: Upcoming capabilities will look at many-megawatt systems that tie in the support of other energy sectors.
Renewable In-Roads for Hydrogen
At NREL, the drive toward larger charging demands is being met with larger research capabilities. The announcement of ARIES opens the door to energy systems integration research at a scale 10-times greater than current capabilities: 20 MW, up from 2 MW. Critically, it presents an opportunity to understand how mobility with high energy demands can be co-optimized with other utility-scale assets to benefit grid stability.
"If you've got a grid humming along with a steady load, then a truck requires 500 kW or more of power, it could create a large disruption for the grid," said Keith Wipke, the laboratory program manager for fuel cells and hydrogen technologies at NREL.
Such a high power demand could be partially served by battery storage systems. Or it could be hidden entirely with hydrogen production. Wipke's program, with support from the DOE's Hydrogen and Fuel Cell Technologies Office, has been performing studies into how electrolyzers—devices that use electricity to break water into hydrogen and oxygen—could offset the grid impacts of XFC. These efforts are also closely aligned with DOE's H2@Scale vision for affordable and effective hydrogen use across multiple sectors, including heavy-duty transportation, power generation, and metals manufacturing, among others.
"We're simulating electrolyzers that can match the charging load of heavy-duty battery electric vehicles. When fast charging begins, the electrolyzers are ramped down. When fast charging ends, the electrolyzers are ramped back up," Wipke said. "If done smoothly, the utility doesn't even know it's happening."
NREL Researchers Rishabh Jain, Kazunori Nagasawa, and Jen Kurtz are working on how grid integration of electrolyzers—devices that use electricity to break water into hydrogen and oxygen—could offset the grid impacts of extreme fast-charging. Credit: National Renewable Energy Laboratory
As electrolyzers harness the cheap electrons from off-demand periods, a significant amount of hydrogen can be produced on site. That creates a natural energy pathway from discount electricity into a fuel. It is no wonder, then, that several well-known transportation and fuel companies have recently initiated a multimillion-dollar partnership with NREL to advance heavy-duty hydrogen vehicle technologies.
"The logistics of expanding electric charging infrastructure from 50 kW for a single demonstration battery electric truck to 5,000 kW for a fleet of 100 could present challenges," Wipke said. "Hydrogen scales very nicely; you're basically bringing hydrogen to a fueling station or producing it on site, but either way the hydrogen fueling events are decoupled in time from hydrogen production, providing benefits to the grid."
The long driving range and fast refuel times—including a DOE target of achieving 10-minutes refuel for a truck—have already made hydrogen the standout solution for applications in warehouse forklifts. Further, NREL is finding that distributed electrolyzers can simultaneously produce hydrogen and improve voltage conditions, which can add much-needed stability to a grid that is accommodating more energy from variable resources.
Those examples that co-optimize mobility with the grid, using diverse technologies, are encouraging NREL and its partners to pursue a new scale of systems integration. Several forward-thinking projects are reimagining urban mobility as a mix of energy solutions that integrate the relative strengths of transportation technologies, which complement each other to fill important gaps in grid reliability.
The Future of Urban Mobility
What will electrified transportation look like at high penetrations? A few NREL projects offer some perspective. Among the most experimental, NREL is helping the city of Denver develop a smart community, integrated with electrified mobility and featuring automated charging and vehicle dispatch.
On another path to advanced mobility, Los Angeles has embarked on a plan to modernize its electricity system infrastructure, reflecting California EV grid stability goals—aiming for a 100% renewable energy supply by 2045, along with aggressive electrification targets for buildings and vehicles. Through the Los Angeles 100% Renewable Energy Study, the city is currently working with NREL to assess the full-scale impacts of the transition in a detailed analysis that integrates diverse capabilities across the laboratory.
The transition would include the Port of Long Beach, the busiest container port in the United States.
At the port, NREL is applying the same sort of scenario forecasting and controls evaluation as other projects, in order to find the optimal mix of technologies that can be integrated for both grid stability and a reliable quality of service: a mix of hydrogen fuel-cell and battery EVs, battery storage systems, on-site renewable generation, and extreme coordination among everything.
"Hydrogen at ports makes sense for the same reason as trucks: Marine applications have big power and energy demands," Wipke said. "But it's really the synergies between diverse technologies—the existing infrastructure for EVs and the flexibility of bulk battery systems—that will truly make the transition to high renewable energy possible."
Like the Port of Long Beach, transportation hubs across the nation are adapting to a complex environment of new mobility solutions. Airports and public transit stations involve the movement of passengers, goods, and services at a volume exceeding anywhere else. With the transition to digitally connected electric mobility changing how airports plan for the future, NREL projects such as Athena are using the power of high-performance computing to demonstrate how these hubs can maximize the value of passenger and freight mobility per unit of energy, time, and/or cost.
The growth in complexity for transportation hubs has just begun, however. Looking ahead, fleets of ride-sharing EVs, automated vehicles, and automated ride-sharing EV fleets could present the largest effort to manage mobility yet.
A Self-Driving Power Grid
To understand the full impact of future mobility-service providers, NREL developed the HIVE (Highly Integrated Vehicle Ecosystem) simulation framework. HIVE combines factors related to serving mobility needs and grid operations—such as a customer's willingness to carpool or delay travel, and potentially time-variable costs of recharging—and simulates the outcome in an integrated environment.
"Our question is, how do you optimize the management of a fleet whose primary purpose is to provide rides and improve that fleet's dispatch and charging?" said Eric Wood, an NREL vehicle systems engineer.
HIVE was developed as part of NREL's Autonomous Energy Systems research to optimize the control of automated vehicle fleets. That is, optimized routing and dispatch of automated electric vehicles.
The project imagines how price signals could influence dispatch algorithms. Consider one customer booking a commute through a ride-hailing app. Out of the fleet of vehicles nearby—variously charged and continually changing locations—which one should pick up the customer?
Now consider the movements of thousands of passengers in a city and thousands of vehicles providing transportation services. Among the number of agents, the moment-to-moment change in energy supply and demand, and the broad diversity in vendor technologies, "we're playing with a lot of parameters," Wood said.
But cutting through all the complexity, and in the midst of massive simulations, the end goal for vehicle-to-grid integration is consistent:
"The motivation for our work is that there are forecasts for significant load on the grid from the electrification of transportation," Wood said. "We want to ensure that this load is safely and effectively integrated, while meeting the expectations and needs of passengers."
The Port of Long Beach uses a mix of hydrogen fuel-cell and battery EVs, battery storage systems, on-site renewable generation, and extreme coordination among everything. Credit: National Renewable Energy Laboratory
True Replacement without Caveats
Electric vehicles are not necessarily helpful to the grid, but they can be. As EVs become established in the transportation sector, NREL is studying how to even out any bumps that electrified mobility could cause on the grid and advance any benefits to commuters or industry.
"It all comes down to load flexibility," Meintz said. "We're trying to decide how to optimally dispatch vehicle charging to meet quality-of-service considerations, while also minimizing charging costs."
Related News