Wind could provide 20 per cent of power: study

By The Independent


NFPA 70e Training

Our customized live online or in‑person group training can be delivered to your staff at your location.

  • Live Online
  • 6 hours Instructor-led
  • Group Training Available
Regular Price:
$199
Coupon Price:
$149
Reserve Your Seat Today
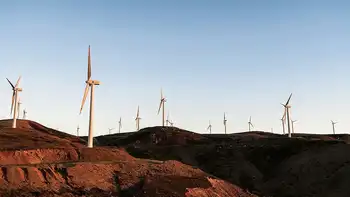
Wind power could meet about a fifth of the world's electricity demand within 20 years, an industry group and environmental watchdog Greenpeace predicted in a new report released just recently.

The global market for wind power grew 41.7 percent on year in 2009, beating average annual growth of 28.6 percent over the past 13 years, said Steve Sawyer, secretary general of the Global Wind Energy Council, or GWEC.

China ranked second in the world in installed wind generating capacity in 2009 and was the largest buyer of wind technology, Sawyer told reporters at the launch of GWEC and Greenpeace's Global Wind Energy Outlook 2010 report.

"We would expect China to continue to be the largest market and perhaps even be the overall largest market in the world by the end of this year," he said.

The report's "advanced scenario" — its most optimistic outlook — projects the world's combined installed wind turbines would produce 2,600 terawatt hours TWh of electricity by 2020 — equal to 11.5 to 12.3 percent of power demand.

By 2030, wind energy would produce 5,400 TWh - 18.8 to 21.8 percent of the world's power supply, the report said.

The more conservative "reference" scenario based on figures from the UN's International Energy Agency saw wind power triple in the next decade to cover up to 4.8 percent of electricity - equal to Europe's current total production.

The "moderate" scenario based on current industry figures would see wind power meet up to 9.5 percent of the world's power demand by 2020, the report said.

"For more than the last 10 years, the actual performance of the wind industry has exceeded our advanced scenario every time," said Sawyer.

Under the advanced forecast, 1.6 billion tonnes of carbon dioxide emissions would be saved each year, the report said.

This would increase to 3.3 billion tonnes of CO2 saved each year by 2030.

The cumulative amounts of CO2 saved would be 10 billion tonnes by 2020 and 34 billion tonnes by 2030, the report said.

When asked to compare China's wind power industry to the U.S., Sawyer said Beijing was showing more leadership than Washington in alternative energy.

"At the moment, the Chinese market has most of the advantages in the sense that there's a clear and supportive policy framework and very clear government support for developing a domestic industry," Sawyer said.

"Neither of those have really been the case in the United States."

Related News

Pacific Northwest's Renewable Energy Goals Hindered

Pacific Northwest Transmission Bottleneck slows clean energy progress as BPA's aging grid constrains renewable interconnections, delaying wind, solar, and data center growth; decarbonization targets depend on transmission upgrades, new substations, and policy reform.


Key Points

An interconnection and capacity shortfall on BPA's aging grid that delays renewables and impedes clean energy goals.

✅ BPA approvals lag: 1 of 469 projects since 2015.

✅ Yakama solar waits for substation upgrades until 2027.

✅ Data centers and decarbonization targets face grid constraints.


Oregon and Washington have set ambitious targets to decarbonize their power sectors, aiming for 100% clean electricity in the coming decades. However, a significant obstacle stands in the way: the region's aging and overburdened transmission grid, underscoring why 100% renewables remain elusive even as momentum builds.

The Grid Bottleneck

The BPA operates a transmission system that is nearly a century old in some areas, and its capacity has not expanded sufficiently to accommodate the influx of renewable energy projects, reflecting stalled grid spending in many parts of the U.S., according to recent analyses. Since 2015, 469 large renewable projects have applied to connect to the BPA's grid; however, only one has been approved—a stark contrast to other regions in the country. This bottleneck has left numerous wind and solar projects in limbo, unable to deliver power to the grid.

One notable example is the Yakama Nation's solar project. Despite receiving a $32 million federal grant under the bipartisan infrastructure law as part of a broader grid overhaul for renewables, the tribe faces significant delays. The BPA estimates that it will take until 2027 to complete the necessary upgrades to the transmission system, including a new substation, before the solar array can be connected. This timeline poses a risk of losing federal funding if the project isn't operational by 2031.

Economic and Environmental Implications

The slow pace of grid expansion has broader implications for the region's economy and environmental goals. Data centers and other energy-intensive industries are increasingly drawn to the Pacific Northwest due to its clean energy potential, while interregional projects like the Wyoming-to-California wind link illustrate how transmission access can unlock supply. However, without adequate infrastructure, these industries may seek alternatives elsewhere. Additionally, the inability to integrate renewable energy efficiently hampers efforts to reduce greenhouse gas emissions and combat climate change.

Policy Challenges and Legislative Efforts

Efforts to address the grid limitations through state-level initiatives have faced challenges, even as a federal rule to boost transmission advances nationally. In 2025, both Oregon and Washington considered legislation to establish state bonding authorities aimed at financing transmission upgrades. However, these bills failed to pass, leaving the BPA as the primary entity responsible for grid expansion. The BPA's unique structure—operating as a self-funded federal agency without direct state oversight—has made it difficult for regional leaders to influence its decision-making processes.

Looking Ahead

The Pacific Northwest's renewable energy aspirations hinge on modernizing its transmission infrastructure, aligning with decarbonization strategies that emphasize grid buildout. While the BPA has proposed several projects to enhance grid capacity, the timeline for completion remains uncertain. Without significant investment and policy reforms, the region risks falling behind in the transition to a clean energy future. Stakeholders across Oregon and Washington must collaborate to advocate for necessary changes and ensure that the grid can support the growing demand for renewable energy.

The Pacific Northwest's commitment to clean energy is commendable, but achieving these goals requires overcoming substantial infrastructure challenges, and neighboring jurisdictions such as British Columbia have pursued B.C. regulatory streamlining to accelerate projects. Addressing the limitations of the BPA's transmission system is critical to unlocking the full potential of renewable energy in the region. Only through concerted efforts at the federal, state, and local levels can Oregon and Washington hope to realize their green energy ambitions.


Related News

View more

Ford's Washington Meeting: Energy Tariffs and Trade Tensions with U.S

Ontario-U.S. Energy Tariff Dispute highlights cross-border trade tensions, retaliatory tariffs, export surcharges, and White House negotiations as Doug Ford meets U.S. officials to de-escalate pressure over steel, aluminum, and energy supplies.


Key Points

A trade standoff over energy exports and tariffs, sparked by Ontario's surcharge and U.S. duties on steel and aluminum.

✅ 25% Ontario energy surcharge paused before White House talks

✅ U.S. steel and aluminum tariffs reduced from 50% to 25%

✅ Potential energy supply cutoff remains leverage in negotiations


Ontario Premier Doug Ford's recent high-stakes diplomatic trip to Washington, D.C., underscores the delicate trade tensions between Canada and the United States, particularly concerning energy exports and Canada's electricity exports across the border. Ford's potential use of tariffs or even halting U.S. energy supplies, amid Ontario's energy independence considerations, remains a powerful leverage tool, one that could either de-escalate or intensify the ongoing trade conflict between the two neighboring nations.

The meeting in Washington follows a turbulent series of events that began with Ontario's imposition of a 25% surcharge on energy exports to the U.S. This move came in retaliation to what Ontario perceived as unfair treatment in trade agreements, a step that aligned with Canadian support for tariffs at the time. In response, U.S. President Donald Trump's administration threatened its own set of tariffs, specifically targeting Canadian steel and aluminum, which further escalated tensions. U.S. officials labeled Ford's threat to cut off U.S. electricity exports and energy supplies as "egregious and insulting," warning of significant economic retaliation.

However, shortly after these heated exchanges, Trump’s commerce secretary, Howard Lutnick, extended an invitation to Ford for a direct meeting at the White House. Ford described this gesture as an "olive branch," signaling a potential de-escalation of the dispute. In the lead-up to this diplomatic encounter, Ford agreed to pause the energy surcharge, allowing the meeting to proceed, amid concerns tariffs could spike NY energy prices, without further escalating the crisis. Trump's administration responded by lowering its proposed 50% tariff on Canadian steel and aluminum to a more manageable 25%.

The outcome of the meeting, which is set to address these critical issues, could have lasting implications for trade relations between Canada and the U.S. If Ford and Lutnick can reach an agreement, the potential for tariff imposition on energy exports, though experts advise against cutting Quebec's energy exports due to broader risks, could be resolved. However, if the talks fail, it is likely that both countries could face further retaliatory measures, compounding the economic strain on both sides.

As Canada and the U.S. continue to navigate these complex issues, where support for Canadian energy projects has risen, the outcome of Ford's meeting with Lutnick will be closely watched, as it could either defuse the tensions or set the stage for a prolonged trade battle.


Related News

View more

Nevada on track to reach RPS mandate of 50% renewable electricity by 2030: report

Nevada Renewable Portfolio Standard 2030 targets 50% clean energy, advancing solar, geothermal, and wind, cutting GHG emissions, phasing out coal, and expanding storage, EV infrastructure, and in-state renewables under PUCN oversight and tax abatements.


Key Points

A state mandate requiring 50% of electricity from renewables by 2030, driving solar, geothermal, wind, and storage.

✅ 50% clean power by 2030; 100% carbon-free target by 2050

✅ Growth in solar, geothermal, wind; coal phase-out; natural gas remains

✅ RETA incentives spur 6.1 GW capacity, jobs, and in-state investment


Nevada is on track to meet its Renewable Portfolio Standard of 50% of electricity generated by renewable energy sources by 2030, according to the Governor's Office of Energy's annual Status of Energy Report.

Based on compliance reports the Public Utilities Commission of Nevada has received, across all providers, about 20% of power is currently generated by renewable resources, and, nationally, renewables ranked second in 2020 as filings show Nevada's investor-owned utility and other power providers have plans to reach the state's ambitious RPS of 50% by 2030, according to the report released Jan. 28.

"Because transportation and electricity generation are Nevada's two largest contributors to greenhouse gas emissions, GOE's program work in 2021 underscored our focus on transportation electrification and reaching the state's legislatively required renewable portfolio standard," GOE Director David Bobzien said in a statement Jan. 28. "While electricity generated from renewable resources currently accounts for about 25% of the state's electricity, a share similar to projections that renewables will soon provide about one-fourth of U.S. electricity overall, we continue to collaborate with the Public Utilities Commission of Nevada, electricity providers, the renewable energy industry and conservation organizations to ensure Nevada reaches our target of 50% clean energy by 2030."

The state's RPS, enacted in 1997 and last modified in 2019, requires an increase in renewable energy, starting with 22% in 2020 and increasing to 50% by 2030. The increase in renewables will reduce GHG emissions and help the state reach its goal of 100% carbon-free power by 2050, while states like Rhode Island have a 100% by 2030 plan, highlighting varying timelines.

Renewable additions
The state added 1.332 GW of renewable capacity in 2021 as part of the Renewable Energy Tax Abatement program, at a time when U.S. renewable energy hit a record 28% in April, for a total renewable capacity of 6.117 GW, according to the report.

The RETA program awards partial sales and use tax and partial property-tax abatements to eligible renewable energy facilities, which increase Nevada's tax revenue and create jobs in a growing industry. Eligible projects must employ at least 50% Nevada workers, pay 175% of Nevada's average wage during construction, and offer health care benefits to workers and their dependents.

Since its adoption in 2010, the GOE has approved 60 projects, including large-scale solar PV, solar thermal, biomass, geothermal and wind projects throughout the state, according to the report. Projects granted abatements in 2021 include:

  • 100-MW Citadel Solar Project
  • 150-MW Dry Lake Solar + Storage Project
  • 714-MW Gemini Solar Project
  • 55-MW North Valley Power Geothermal Project
  • 113-MW Boulder Flats Solar Project
  • 200-MW Arrow Canyon Solar Project

"Nevada does not produce fossil fuels of any significant amount, and gasoline, jet fuel and natural gas for electricity or direct use must be imported," according to the report. "Transitioning to domestically produced renewable resources and electrified transportation can provide cost savings to Nevada residents and businesses, as seen in Idaho's largely renewable mix today, while reducing GHG emissions. About 86% of the fuel for energy that Nevada consumes comes from outside the state."

Phasing out coal plants
Currently, more than two-thirds of the state's electricity is produced by natural gas-fired power plants, with renewables covering most of the remaining generation, according to the report. Nevada continues to phase out its remaining coal power plants, as renewables surpassed coal nationwide in 2022, which provide less than 10% of produced electricity.

"Nevada has seen a significant increase in capturing its abundant renewable energy resources such as solar and geothermal," according to the report. "Renewable energy production continues to grow, powering Nevada homes and business and serves to diversify the state's economy by exporting solar and geothermal to neighboring states, as California neared 100% renewable electricity for the first time. Nevada has more than tripled its renewable energy production since 2011."


Related News

View more

Which of the cleaner states imports dirty electricity?

Hourly Electricity Emissions Tracking maps grid balancing areas, embodied emissions, and imports/exports, revealing carbon intensity shifts across PJM, ERCOT, and California ISO, and clarifying renewable energy versus coal impacts on health and climate.


Key Points

An hourly method tracing generation, flows, and embodied emissions to quantify carbon intensity across US balancing areas.

✅ Hourly traces of imports/exports and generation mix

✅ Consumption-based carbon intensity by balancing area

✅ Policy insights for renewables, coal, health costs


In the United States, electricity generation accounts for nearly 30% of our carbon emissions. Some states have responded to that by setting aggressive renewable energy standards; others are hoping to see coal propped up even as its economics get worse. Complicating matters further is the fact that many regional grids are integrated, and as America goes electric the stakes grow, meaning power generated in one location may be exported and used in a different state entirely.

Tracking these electricity exports is critical for understanding how to lower our national carbon emissions. In addition, power from a dirty source like coal has health and environment impacts where it's produced, and the costs of these aren't always paid by the parties using the electricity. Unfortunately, getting reliable figures on how electricity is produced and where it's used is challenging, even for consumers trying to find where their electricity comes from in the first place, leaving some of the best estimates with a time resolution of only a month.

Now, three Stanford researchers—Jacques A. de Chalendar, John Taggart, and Sally M. Benson—have greatly improved on that standard, and they have managed to track power generation and use on an hourly basis. The researchers found that, of the 66 grid balancing areas within the United States, only three have carbon emissions equivalent to our national average, and they have found that imports and exports of electricity have both seasonal and daily changes. de Chalendar et al. discovered that the net results can be substantial, with imported electricity increasing California's emissions/power by 20%.

Hour by hour
To figure out the US energy trading landscape, the researchers obtained 2016 data for grid features called balancing areas. The continental US has 66 of these, providing much better spatial resolution on the data than the larger grid subdivisions. This doesn't cover everything—several balancing areas in Canada and Mexico are tied in to the US grid—and some of these balancing areas are much larger than others. The PJM grid, serving Pennsylvania, New Jersey, and Maryland, for example, is more than twice as large as Texas' ERCOT, in a state that produces and consumes the most electricity in the US.

Despite these limitations, it's possible to get hourly figures on how much electricity was generated, what was used to produce it, and whether it was used locally or exported to another balancing area. Information on the generating sources allowed the researchers to attach an emissions figure to each unit of electricity produced. Coal, for example, produces double the emissions of natural gas, which in turn produces more than an order of magnitude more carbon dioxide than the manufacturing of solar, wind, or hydro facilities. These figures were turned into what the authors call "embodied emissions" that can be traced to where they're eventually used.

Similar figures were also generated for sulfur dioxide and nitrogen oxides. Released by the burning of fossil fuels, these can both influence the global climate and produce local health problems.

Huge variation
The results were striking. "The consumption-based carbon intensity of electricity varies by almost an order of magnitude across the different regions in the US electricity system," the authors conclude. The low is the Bonneville Power grid region, which is largely supplied by hydropower; it has typical emissions below 100kg of carbon dioxide per megawatt-hour. The highest emissions come in the Ohio Valley Electric region, where emissions clear 900kg/MW-hr. Only three regional grids match the overall grid emissions intensity, although that includes the very large PJM (where capacity auction payouts recently fell), ERCOT, and Southern Co balancing areas.

Most of the low-emissions power that's exported comes from the Pacific Northwest's abundant hydropower, while the Rocky Mountains area exports electricity with the highest associated emissions. That leads to some striking asymmetries. Local generation in the hydro-rich Idaho Power Company has embodied emissions of only 71kg/MW-hr, while its imports, coming primarily from Rocky Mountain states, have a carbon content of 625kg/MW-hr.

The reliance on hydropower also makes the asymmetry seasonal. Local generation is highest in the spring as snow melts, but imports become a larger source outside this time of year. As solar and wind can also have pronounced seasonal shifts, similar changes will likely be seen as these become larger contributors to many of these regional grids. Similar things occur daily, as both demand and solar production (and, to a lesser extent, wind) have distinct daily profiles.

The Golden State
California's CISO provides another instructive case. Imports represent less than 30% of its total electric use in 2016, yet California electricity imports provided 40% of its embodied emissions. Some of these, however, come internally from California, provided by the Los Angeles Department of Water and Power. The state itself, however, has only had limited tracking of imported emissions, lumping many of its sources as "other," and has been exporting its energy policies to Western states in ways that shape regional markets.

Overall, the 2016 inventory provides a narrow picture of the US grid, as plenty of trends are rapidly changing our country's emissions profile, including the rise of renewables and the widespread adoption of efficiency measures and other utility trends in 2017 that continue to evolve. The method developed here can, however, allow for annual updates, providing us with a much better picture of trends. That could be quite valuable to track things like how the rapid rise in solar power is altering the daily production of clean power.

More significantly, it provides a basis for more informed policymaking. States that wish to promote low-emissions power can use the information here to either alter the source of their imports or to encourage the sites where they're produced to adopt more renewable power. And those states that are exporting electricity produced primarily through fossil fuels could ensure that the locations where the power is used pay a price that includes the health costs of its production.


Related News

View more

Parked Electric Cars Earn $1,530 From Europe's Power Grids

Vehicle-to-Grid Revenue helps EV owners earn income via V2G, demand response, and ancillary services by exporting stored energy, supporting grid balancing, smart charging, and renewable integration with two-way charging infrastructure.


Key Points

Income EV owners earn by selling battery power to the grid for balancing, response, and flexibility services.

✅ Earn up to about $1,530 annually in Denmark trials

✅ Requires V2G-compatible EVs and two-way smart chargers

✅ Provides ancillary services and supports renewable integration


Electric car owners are earning as much as $1,530 a year just by parking their vehicle and feeding excess power back into the grid, effectively selling electricity back to the grid under V2G schemes.

Trials in Denmark carried out by Nissan and Italy’s biggest utility Enel Spa showed how batteries inside electric cars could, using vehicle-to-grid technology, help balance supply and demand at times and provide a new revenue stream for those who own the vehicles.

Technology linking vehicles to the grid marks another challenge for utilities already struggling to integrate wind and solar power into their distribution system. As the use of plug-in cars spreads, grid managers will have to pay closer attention and, with proper management, to when motorists draw from the system and when they can smooth variable flows.

For example, California's grid stability efforts include leveraging EVs as programs expand.

“If you blindingly deploy in the market a massive number of electric cars without any visibility or control over the way they impact the electricity grid, you might create new problems,” said Francisco Carranza, director of energy services at Nissan Europe in an interview with Bloomberg New Energy Finance.


While the Tokyo-based automaker has trials with more than 100 cars across Europe, only those in Denmark are able to earn money by feeding power back into the grid. There, fleet operators collected about 1,300 euros ($1,530) a year using the two-way charge points, said Carranza.

Restrictions on accessing the market in the U.K. means the company needs to reach about 150 cars before they can get paid for power sent back to the grid. That could be achieved by the end of this year, he said.

“It’s feasible,” he said. “It’s just a matter of finding the appropriate business model to deploy the business wide-scale.’’

Electric car demand globally is expected to soar, challenging state power grids and putting further pressure on grid operators to find new ways of balancing demand. Power consumption from vehicles will grow to 1,800 terawatt-hours in 2040 from just 6 terawatt-hours now, according to Bloomberg New Energy Finance.


Related News

View more

Washington State's Electric Vehicle Rebate Program

Washington EV Rebate Program drives EV adoption with incentives, funding, and clean energy goals, cutting greenhouse gas emissions. Residents embrace electric vehicles as charging infrastructure expands, supporting sustainable transportation and state climate targets.


Key Points

Washington EV Rebate Program provides incentives to cut EV costs, accelerate adoption, and support clean energy targets.

✅ Over half of allocated funding already utilized statewide.

✅ Incentives lower upfront costs and spur EV demand.

✅ Charging infrastructure expansion remains a key priority.


Washington State has reached a significant milestone in its electric vehicle (EV) rebate program, with more than half of the allocated funding already utilized. This rapid uptake highlights the growing interest in electric vehicles as residents seek more sustainable transportation options. As the state continues to prioritize environmental initiatives, this development showcases both the successes and challenges of promoting electric vehicle adoption.

A Growing Demand for Electric Vehicles

The substantial drawdown of rebate funds indicates a robust demand for electric vehicles in Washington. As consumers become increasingly aware of the environmental benefits associated with EVs—such as reduced greenhouse gas emissions and improved air quality—more individuals are making the switch from traditional gasoline-powered vehicles. Additionally, rising fuel prices and advancements in EV technology, alongside zero-emission incentives are further incentivizing this shift.

Washington's rebate program, which offers financial incentives to residents who purchase or lease eligible electric vehicles, plays a critical role in making EVs more accessible. The program helps to lower the upfront costs associated with purchasing electric vehicles, and similar approaches like New Brunswick EV rebates illustrate how regional incentives can boost adoption, thus encouraging more drivers to consider these greener alternatives. As the state moves toward its goal of a more sustainable transportation system, the popularity of the rebate program is a promising sign.

The Impact of Funding Utilization

With over half of the rebate funding already used, the program's popularity raises questions about the sustainability of its financial support and the readiness of state power grids to accommodate rising EV demand. Originally designed to spur adoption and reduce barriers to entry for potential EV buyers, the rapid depletion of funds could lead to future challenges in maintaining the program’s momentum.

The Washington State Department of Ecology, which oversees the rebate program, will need to assess the current funding levels and consider future allocations to meet the ongoing demand. If the funds run dry, it could slow down the adoption of electric vehicles, potentially impacting the state’s broader climate goals. Ensuring a consistent flow of funding will be essential for keeping the program viable and continuing to promote EV usage.

Environmental Benefits and Climate Goals

The increasing adoption of electric vehicles aligns with Washington’s ambitious climate goals, including a commitment to reduce carbon emissions significantly by 2030. The state aims to transition to a clean energy economy and has set a target for all new vehicles sold by 2035 to be electric, and initiatives such as the hybrid-electric ferry upgrade demonstrate progress across the transportation sector. The success of the rebate program is a crucial step in achieving these objectives.

As more residents switch to EVs, the overall impact on air quality and carbon emissions can be profound. Electric vehicles produce zero tailpipe emissions, which contributes to improved air quality, particularly in urban areas that struggle with pollution. The transition to electric vehicles can also help to reduce dependence on fossil fuels, further enhancing the state’s sustainability efforts.

Challenges Ahead

While the current uptake of the rebate program is encouraging, there are challenges that need to be addressed. One significant issue is the availability of EV models. Although the market is expanding, not all consumers have equal access to a variety of electric vehicle options. Affordability remains a barrier for many potential buyers, especially in lower-income communities, but targeted supports like EV charger rebates in B.C. can ease costs for households. Ensuring that all residents can access EVs and the associated incentives is vital for equitable participation in the transition to electric mobility.

Additionally, there are concerns about charging infrastructure. For many potential EV owners, the lack of accessible charging stations can deter them from making the switch. Expanding charging networks, particularly in underserved areas, is essential for supporting the growing number of electric vehicles on the road, and B.C. EV charging expansion offers a regional model for scaling access.

Looking to the Future

As Washington continues to advance its electric vehicle initiatives, the success of the rebate program is a promising indication of changing consumer attitudes toward sustainable transportation. With more than half of the funding already used, the focus will need to shift to sustaining the program and ensuring that it meets the needs of all residents, while complementary incentives like home and workplace charging rebates can amplify its impact.

Ultimately, Washington’s commitment to electric vehicles is not just about rebates; it’s about fostering a comprehensive ecosystem that supports clean energy, infrastructure, and equitable access. By addressing these challenges head-on, the state can continue to lead the way in the transition to electric mobility, benefiting both the environment and its residents in the long run.


Related News

View more

Sign Up for Electricity Forum’s Newsletter

Stay informed with our FREE Newsletter — get the latest news, breakthrough technologies, and expert insights, delivered straight to your inbox.

Electricity Today T&D Magazine Subscribe for FREE

Stay informed with the latest T&D policies and technologies.
  • Timely insights from industry experts
  • Practical solutions T&D engineers
  • Free access to every issue

Live Online & In-person Group Training

Advantages To Instructor-Led Training – Instructor-Led Course, Customized Training, Multiple Locations, Economical, CEU Credits, Course Discounts.

Request For Quotation

Whether you would prefer Live Online or In-Person instruction, our electrical training courses can be tailored to meet your company's specific requirements and delivered to your employees in one location or at various locations.